Ethereum (ETH) Price Outlook: Potential Breakout Near $3,650 Amid Bullish Divergence and A
November 18, 2025
Ethereum (ETH) is showing signs of a possible upward move as technical patterns and on-chain metrics converge near the $3,650 resistance level.
Traders and analysts are closely monitoring whether the cryptocurrency can maintain support above $3,000–$3,100 amid broader market volatility.
Recent data from blockchain analytics platform Glassnode and historical price studies suggest growing optimism among long-term holders and institutional participants, pointing to a market that may be poised for short-term recovery.
Bullish Structure Persists Despite Market Pressure
Over the past week, ETH has experienced several short-term dips, testing market resilience. Analysts from Swallow Academy, a research firm specializing in technical market structure, noted that buyers have maintained strong support levels, particularly near $3,100.
Ethereum is forming an ascending triangle pattern, characterized by higher lows converging toward a horizontal resistance line, which often signals consolidation before a potential breakout. Historically, ascending triangles have broken upward in roughly 68–77% of cases, though outcomes vary with market conditions, and strong trading volume is required to confirm any breakout.
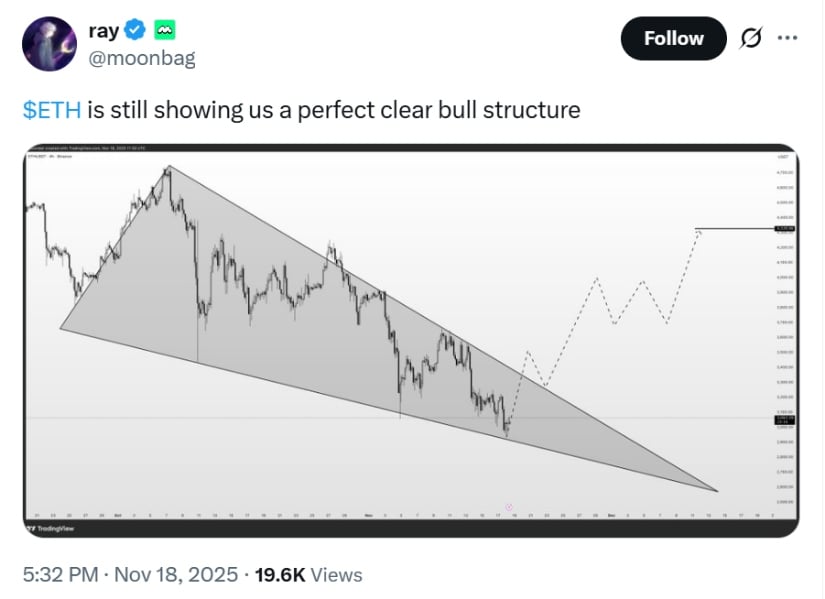
$ETH continues to exhibit a well-defined bullish structure, signaling sustained upward momentum in the market. Source: ray via X
Market Structure Break (MSB): A confirmed MSB occurs when the price decisively moves beyond the previous swing high or low. A break above current resistance could support renewed upward momentum, while failure to break could result in continued sideways movement.
Key Indicators and Volatility Windows
Ethereum is currently in a defined volatility cycle, with elevated market activity expected around November 20, 2025. Technical indicators provide mixed signals:
-
HA-Low Indicator (1D): This daily indicator helps identify potential short-term trend exhaustion. A recent print suggests a local bottom may be forming, implying that a reversal could be possible if broader support holds.
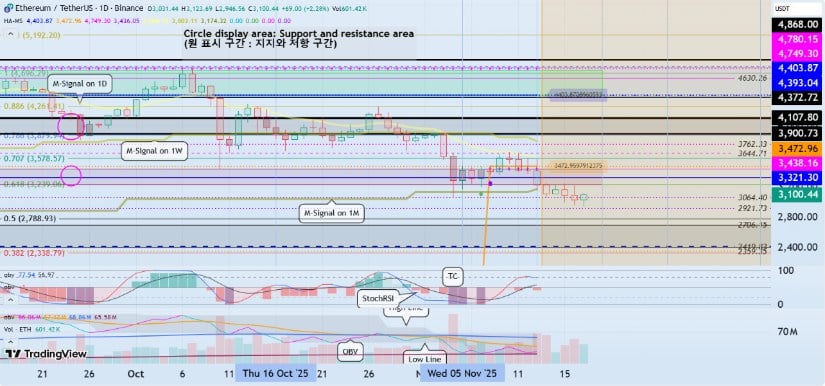
Ethereum (ETH) remains at a critical support zone, with key indicators suggesting a potential uptrend if momentum holds above $3,025–$3,473. Source: readCrypto on TradingView
-
M-Signal Level (Daily, $3,472.96): Acts as a benchmark for price stability; staying above this level would indicate the uptrend remains intact, while failure could introduce renewed downside pressure.
Analysts warn that Ethereum could face significant support between $3,025 and $2,419 if it fails to maintain these critical thresholds.
Technical Support and Resistance
On the weekly chart, Ethereum continues to trade above its 200-week moving average, historically a strong long-term support zone. Meanwhile, the 50-week moving average is providing overhead resistance, creating a narrow compression band reminiscent of Ethereum’s April 2025 correction phase. According to a CryptoQuant report by analyst Burak Kesmeci, Ethereum recovered above the 200-week MA during that period, illustrating its role as a long-term stabilizing factor.
Accumulation Behavior: Long-term holder wallets have increased their holdings from 10 million ETH to over 27 million ETH in 2025, signaling confidence in future growth. While these data points point to potential bullish sentiment, it does not guarantee price appreciation.
Market Sentiment and Bullish Divergence
Ethereum’s daily RSI (Relative Strength Index) is showing bullish divergence, meaning the indicator forms higher lows even as price trades lower, often signaling early recovery potential. This observation was highlighted by Muro (@MuroCrypto), a technical analyst with a following of over 120,000 on social media who specializes in trend and momentum studies.
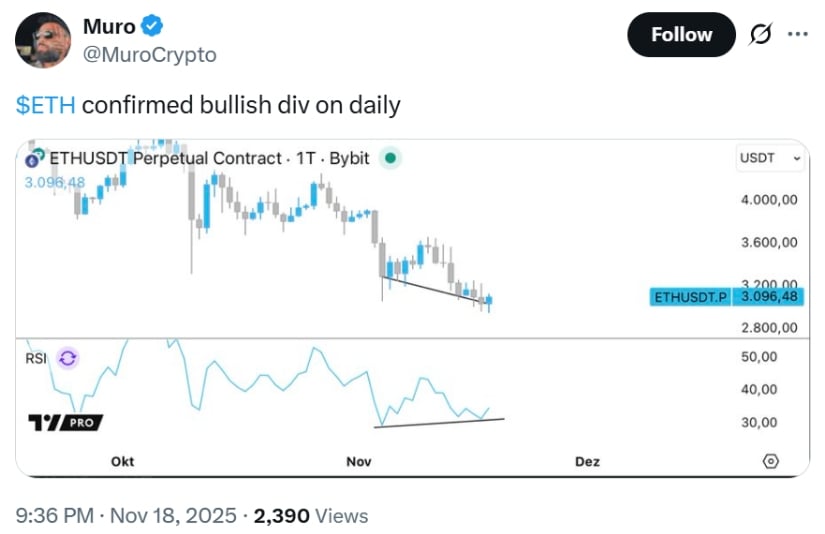
$ETH has confirmed a daily bullish divergence, signaling potential upward momentum in the near term. Source: Muro via X
Despite this divergence, the $3,500–$3,650 zone remains key resistance. A decisive move above the ascending triangle’s upper boundary ($3,200–$3,350) could accelerate momentum, but analysts caution that historical patterns are not guarantees of future performance.
Scenarios for Traders and Holders
-
Short-term traders: A breakout above $3,650 may indicate renewed bullish momentum and potential intraday opportunities.
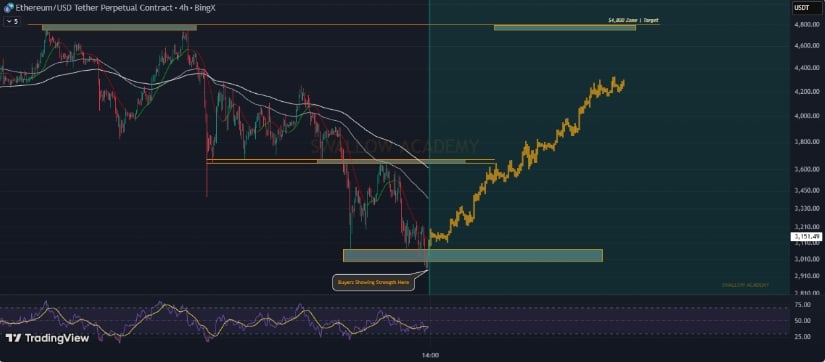
$ETH’s recent dip showed strong buying support, creating a potential short-term bullish opportunity. Key resistance sits at $3,650, aligned with the 200 EMA. Source: SwallowAcademy on TradingView
-
Long-term holders: Maintaining levels above the 200-week MA may suggest continued structural support, even if short-term volatility persists.
-
Cautious participants: Failure to hold above $3,472 could result in consolidation or a deeper retracement, emphasizing the importance of risk management.
Risks and Uncertainties
While technical indicators and on-chain data suggest a positive bias, Ethereum’s price remains sensitive to broader market factors, including macroeconomic events and crypto market sentiment.
Historical patterns like ascending triangles and bullish divergences carry no guarantees, and traders should consider alternative outcomes, including sideways movement or retracement to major support levels.
Final Thoughts
Ethereum’s near-term direction will depend on whether buying pressure can sustain current support levels and whether the market generates sufficient momentum to overcome resistance. Indicators, accumulation trends, and structural patterns provide reasons for cautious optimism, but uncertainty remains high.
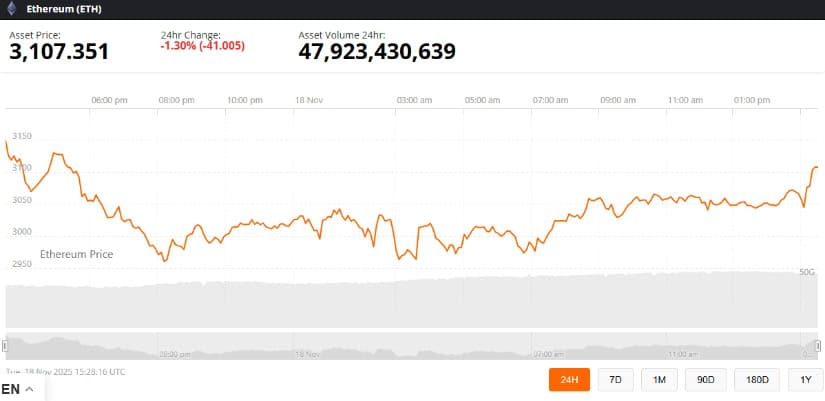
Ethereum was trading at around 3,107.35, down 1.30% in the last 24 hours at press time. Source: Ethereum price via Brave New Coin
Traders and holders should closely monitor key support and resistance levels, volatility windows, and on-chain activity as the market approaches late November, keeping in mind that price predictions are probabilistic, not certain.
Search
RECENT PRESS RELEASES
Related Post

