Ethereum (ETH) Price Prediction: Fusaka Upgrade, Record TPS, and Bullish Chart Structure P
November 16, 2025
While these developments indicate strengthening fundamentals, price confirmation signals remain crucial before a clear bullish trend can be validated.
Recent analysis conducted using TradingView chart data, on-chain metrics from Glassnode, and Layer 2 throughput statistics from L2Beat shows that Ethereum’s network conditions are improving in several key areas, including block capacity, fee reduction, and transaction execution speed.
With these shifts underway, analysts are closely watching the upcoming Fusaka upgrade, along with exchange reserve trends and technical chart structures, to assess whether Ethereum can sustain momentum toward a potential all-time high.
Ethereum Prepares for Key Milestone
Ethereum (ETH) continues moving toward an important protocol enhancement with the upcoming Fusaka upgrade, scheduled for early December 2025. This assessment is based on information from Ethereum Foundation documentation, recent developer calls, and discussions available in public GitHub repositories.
Crypto analyst Cas Abbé also commented on the significance of this phase, stating on X that “$ETH is quietly preparing for one of its most important structural improvements in years.” (Source: CasAbbe—November 2025).
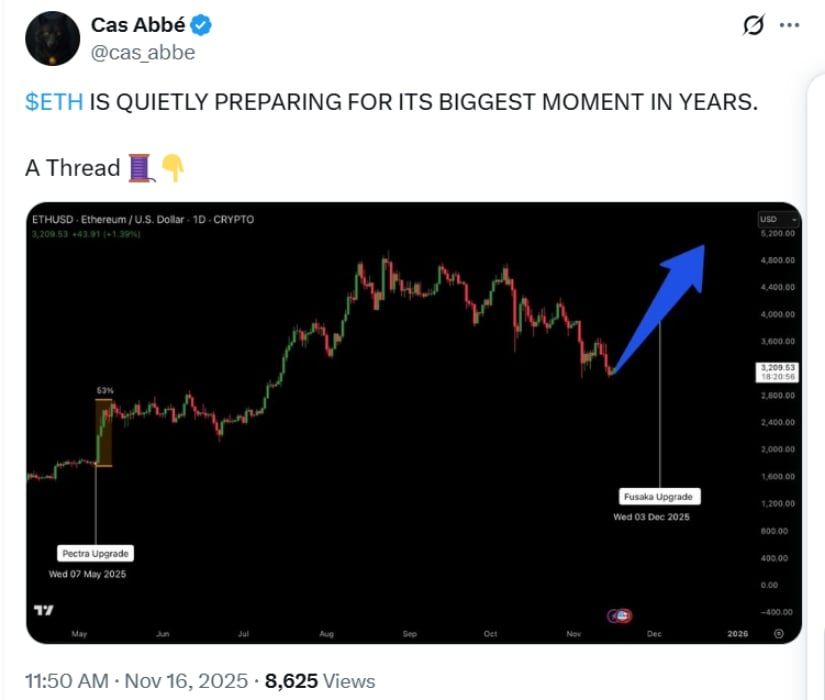
Ethereum appears to be quietly positioning itself for one of its most significant developments in years. Source: Cas Abbé via X
The Fusaka upgrade introduces two core improvements. The first is PeerDAS, or Peer Data Availability Sampling, which is designed to reduce bandwidth requirements for nodes and make it easier for Layer 2 networks to publish data efficiently. In practice, this could help lower Layer 2 transaction fees and improve data propagation for high-throughput rollups.
The second major enhancement is the introduction of Verkle Trees, a more advanced data structure that allows faster and lighter verification of Ethereum’s state. This change is expected to benefit light clients, reduce hardware needs for validation, and support broader network decentralization by making node participation more accessible.
According to technical documentation and research notes from Ethereum contributors, these upgrades together could expand Ethereum’s effective block space to around 150 million gas. However, the outcome will depend on real-world performance after rollout and how quickly Layer 2 networks integrate the new capabilities.
Record Transaction Throughput Signals Network Progress
Data from L2Beat and EigenDA throughput reports show Ethereum recently reached a seven-day average of 24,192 transactions per second (TPS)—the highest recorded to date when combining mainnet and Layer 2 activity.
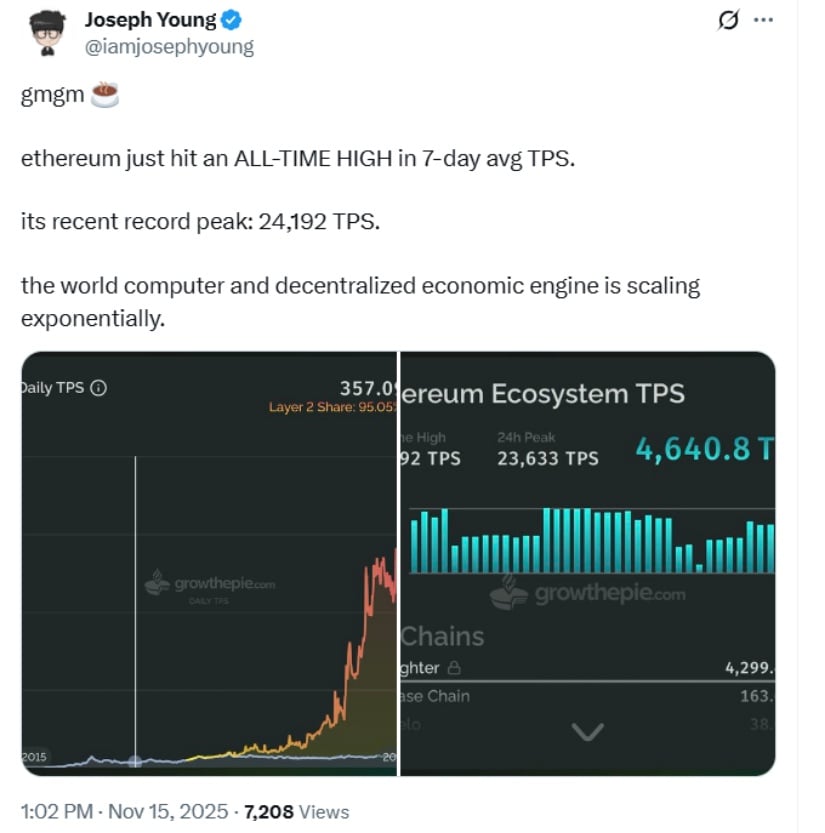
Ethereum reached a new 7-day average TPS all-time high of 24,192, highlighting its exponential scaling as a global decentralized computing and economic platform. Source: Joseph Young via X
The Lighter rollup ecosystem accounts for roughly 4,000 TPS, according to its public dashboards. This marks a substantial improvement over historical mainnet capacity, where Ethereum previously managed <30 TPS before major scaling initiatives.
Much of this growth stems from the Dencun upgrade (implemented in early 2025), which introduced proto-danksharding, significantly reducing L2 data costs.
Even Ethereum co-founder Vitalik Buterin commented on the scaling progress.
“Ethereum is scaling. The improvements across rollups are becoming visible.”
Current Market Dynamics and ETH Price Today
At the time of writing, Ethereum trades around $3,186, based on aggregated pricing from CoinMarketCap and TradingView.
Key market observations (based on Glassnode data):
-
Exchange reserves have declined to 15.5M ETH, the lowest level in several years.(This metric was evaluated using a 30-day rolling average.)
-
ETH supply growth remains negative, driven by EIP-1559 burn mechanics.
-
Trading volume has dropped roughly 60% in the past 24 hours to about $23.4B, indicating short-term caution despite improving fundamentals.
Technical Analysis: Curved Trendline Structure and Breakout Conditions
A review of Ethereum’s daily chart on TradingView shows the development of a curved trendline structure, a pattern that technical analysts often associate with a gradual transition from price consolidation to potential upward momentum.
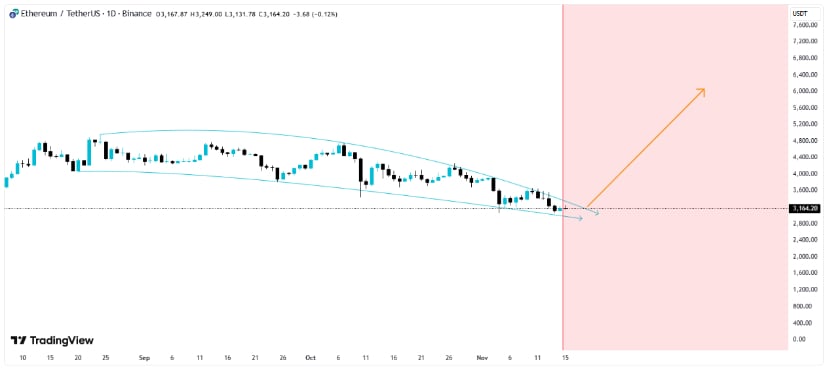
Ethereum’s curved trendline hints at a shift from accumulation to an upward trend, with a confirmed breakout potentially pushing ETH to $6,000–$7,000 and sparking broader market momentum. Source: Traderscorpion on TradingView
Curved trendlines are considered relevant because they indicate that each successive pullback becomes slightly shallower, suggesting buyers are stepping in earlier over time. When this type of structure appears alongside increasing trading volume, it can signal that market participants are beginning to support a stronger trend, although confirmation is still required from price action and broader market conditions.
A potential breakout scenario for Ethereum has been modeled using Fibonacci extensions and historical volatility ranges.
If ETH manages to move decisively above the curved trendline with strong confirmation signals—such as a noticeable increase in trading volume relative to the seven-day average, momentum indicators like the RSI pushing above 60 and a daily candle closing above the key resistance area between $3,450 and $3,550—the next projected targets cluster in the $6,000 to $7,000 region.
Market Sentiment and Expanded Risk Considerations
While multiple indicators lean bullish, sentiment remains mixed.
Caution signals identified:
-
RSI and MACD show weakening upward momentum on the daily timeframe.
-
Price exhaustion signals appear after each attempt to break resistance.
-
Open interest fluctuations indicate uneven confidence among derivatives traders.
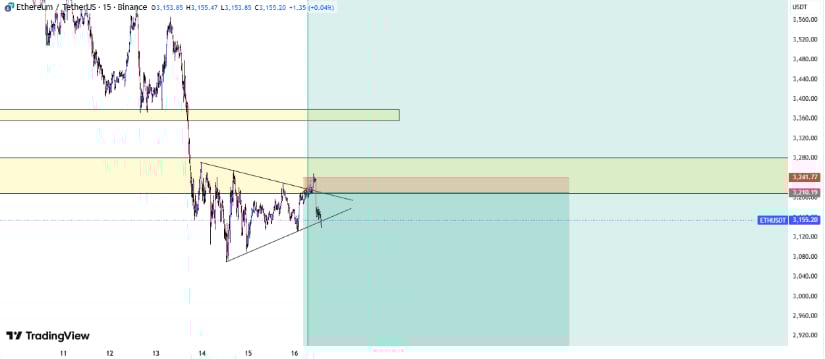
Opening a controlled, high-risk short on ETH (1:10 R:R) amid exhaustion, weakening momentum, and strong resistance, with a quick exit if invalidated. Source: khongorzul0317 on TradingView
Additional macro risks to consider:
-
Shifts in U.S. regulatory policy related to staking or exchange oversight.
-
Liquidity rotations driven by BTC dominance cycles.
-
Global macroeconomic pressures, including inflation readings and the Federal Reserve rate outlook.
Because of these uncertainties, analysts recommend that traders rely on confirmation signals rather than pre-breakout positioning.
Ethereum Forecast 2025 and Beyond
Ethereum’s long-term outlook for 2025 and later will largely depend on the successful rollout of the Fusaka upgrade and the continued expansion of Layer 2 scaling solutions. If these developments function as intended, they may help reinforce Ethereum’s role across decentralized finance, NFTs, restaking protocols, and enterprise blockchain applications. However, the price trajectory will continue to be shaped by both market-specific and macroeconomic conditions.
Under a more optimistic but still conditional scenario, a confirmed breakout above the curved trendline, supported by rising market liquidity, could open the possibility for Ethereum to move toward the $6,000 to $7,000 range.
This remains contingent on sustained volume, healthy risk appetite, and follow-through from buyers. A neutral outcome is also plausible, in which Ethereum trades within a broad consolidation band between roughly $2,900 and $3,500 while the network integrates new technical capabilities over time. On the other hand, a failure to maintain structural support near the $2,850 area—especially if combined with weaker macroeconomic sentiment—could result in a deeper retracement.
Search
RECENT PRESS RELEASES
Related Post


