Ethereum Eyes $3,000, But ETH Price Shows Key Resistance Ahead
May 13, 2025
Ethereum (ETH) shows signs of strength and caution after a sharp 49% rally in the past week. While its market cap has returned above $300 billion and EMA indicators remain bullish, momentum indicators are starting to cool.
The ADX has dropped from 61 to 47.99, and RSI has fallen from 86 to 63, suggesting the uptrend may be losing steam. However, buyers are still active, and if ETH breaks above key resistance, the next leg higher could take it past $3,000.
Ethereum’s DMI indicator shows that its ADX has dropped from 61 to 47.99, signaling a weakening trend strength.
The ADX (Average Directional Index) measures the intensity of a trend, with values above 25 indicating a strong trend and above 40 suggesting very strong momentum.
A declining ADX, even if still elevated, may indicate that the current trend is losing steam, despite analysts recently pointing out that Ethereum could overtake Bitcoin.
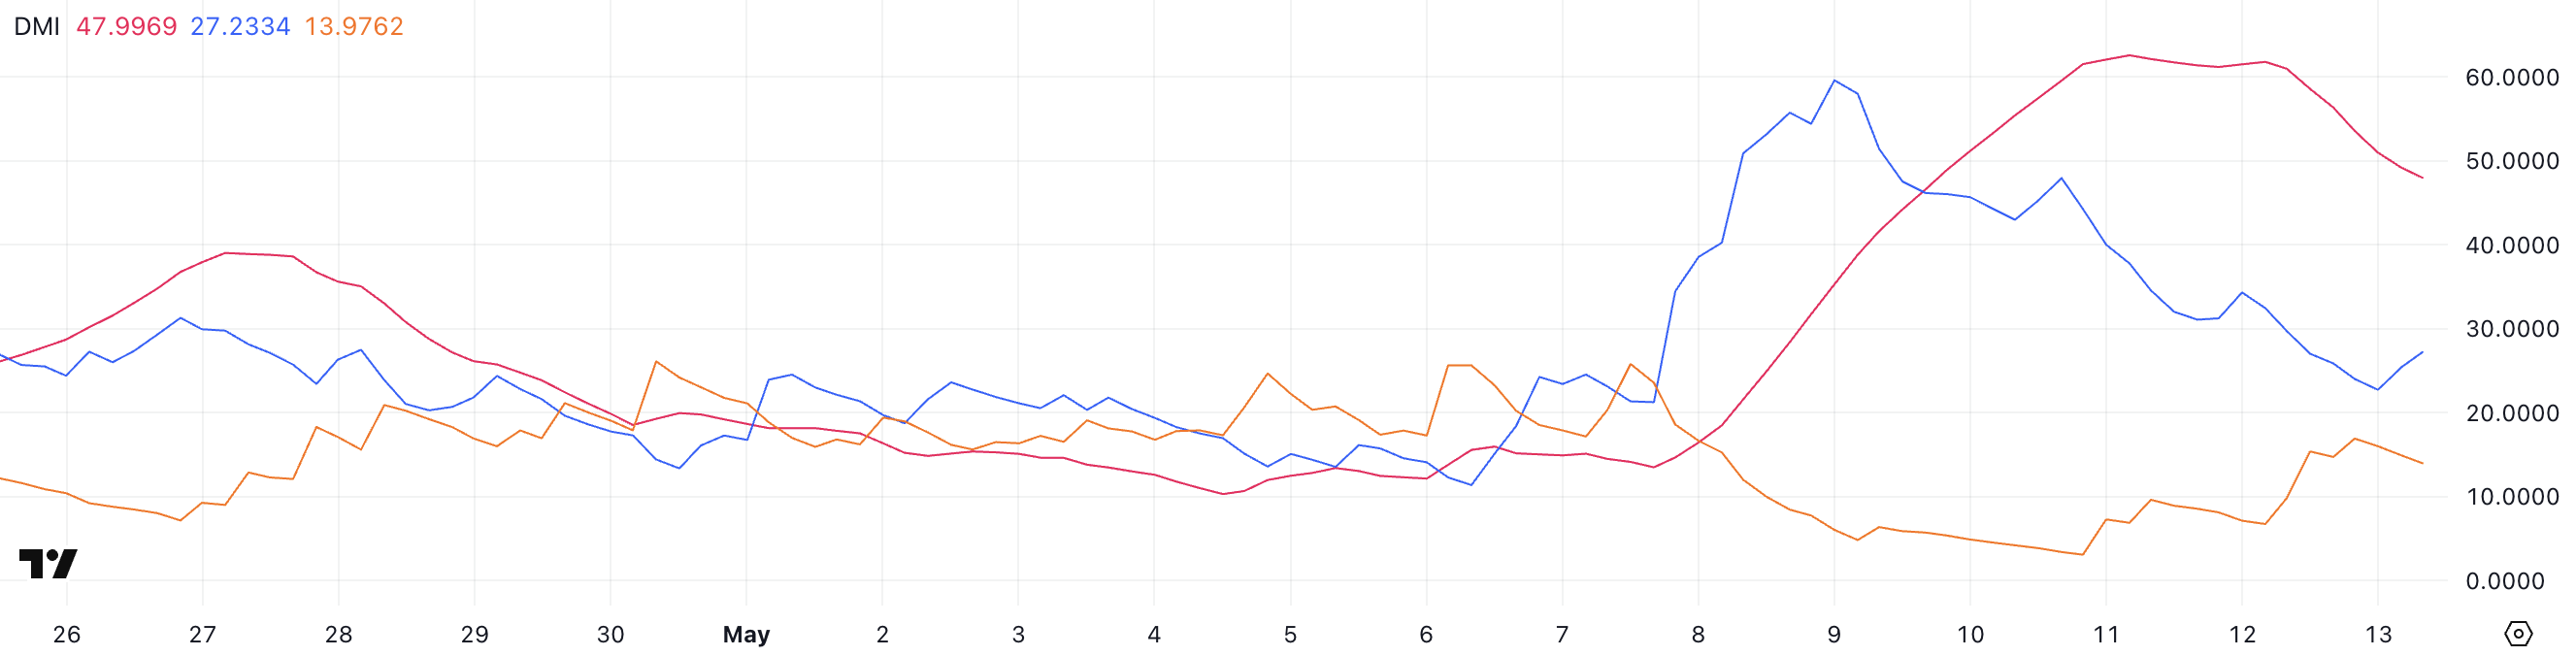
The +DI line has fallen sharply from 47.96 to 27.2, showing that bullish momentum has cooled significantly.
Meanwhile, the -DI line has climbed from 3.39 to 13.97, suggesting that bearish pressure is starting to rise.
While the trend still favors the bulls, the gap between +DI and -DI is narrowing, and if this continues, Ethereum could face a short-term pullback or enter a consolidation phase. However, in the last hours +DI went up and -DI went down, suggesting ETH buyers are trying to maintain their control.
Ethereum RSI Cools From Overbought Zone but Remains Bullish
Ethereum’s RSI has dropped to 63 from a high of 86 three days ago, after holding above the overbought threshold of 70 for three straight days.
Interestingly, despite the recent dip, RSI has bounced from 54 just a few hours ago, suggesting some renewed buying interest in the short term.
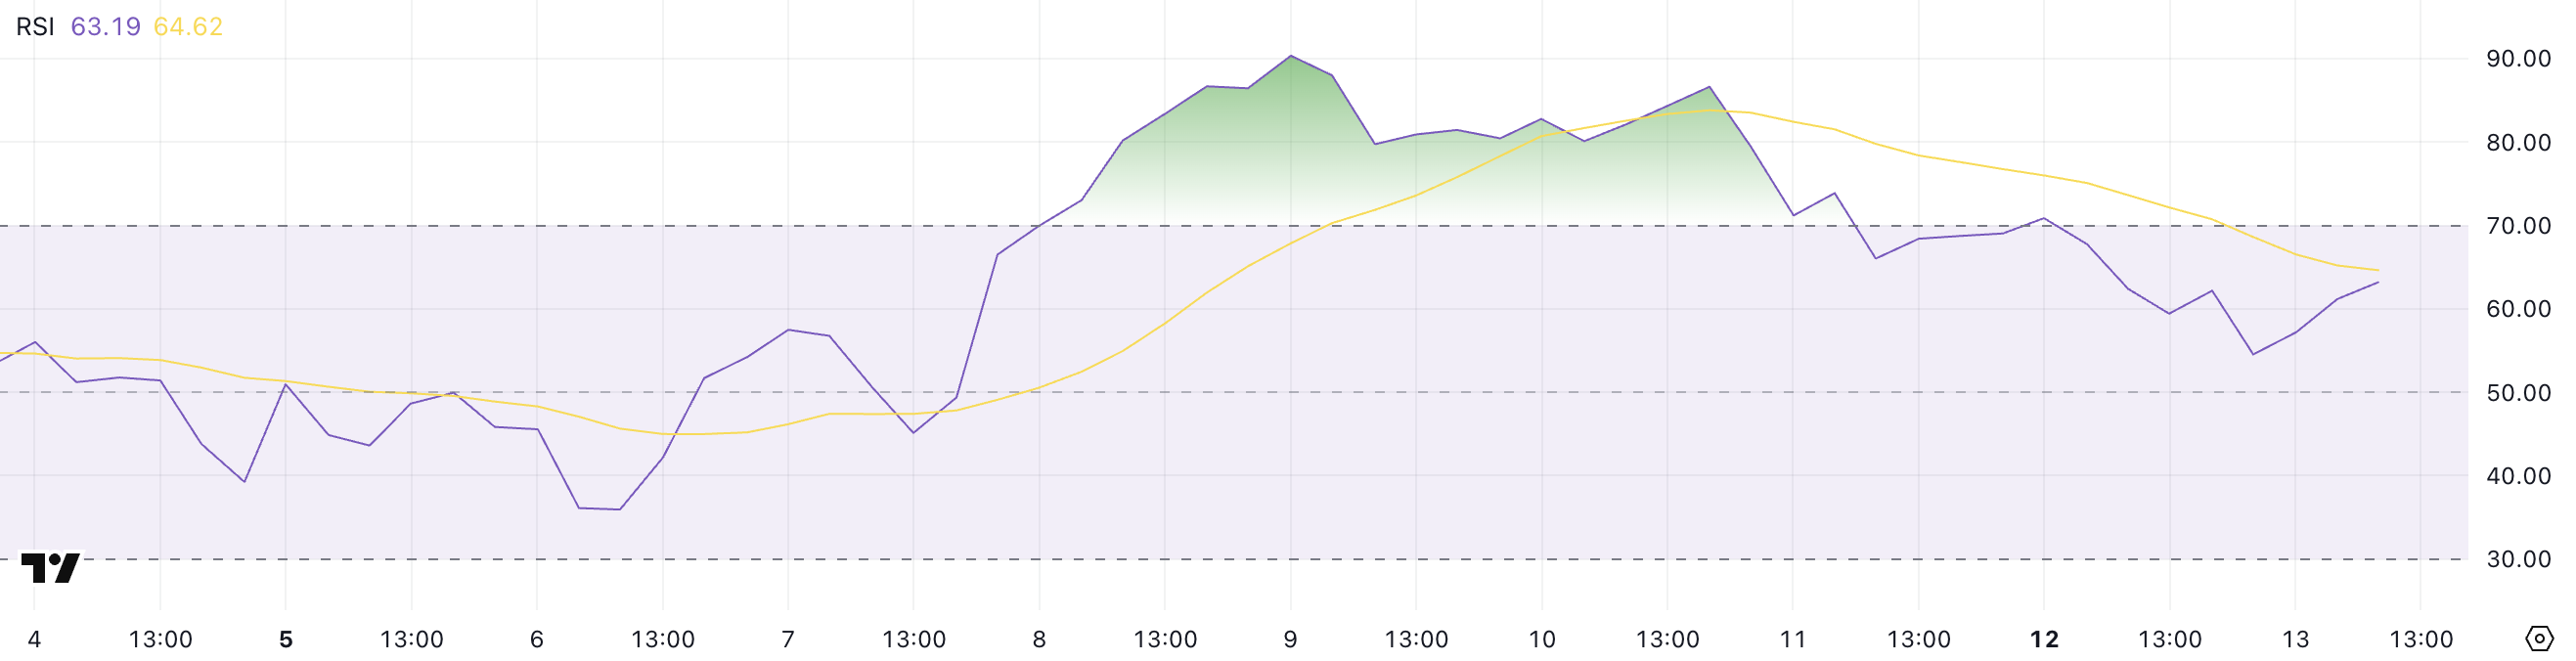
RSI (Relative Strength Index) is a momentum indicator that ranges from 0 to 100. Readings above 70 typically indicate overbought conditions and potential for a pullback, while readings below 30 suggest oversold conditions and a possible bounce. Values between 50 and 70 generally point to moderate bullish momentum.
At 63, Ethereum’s RSI shows that the asset has cooled off from recent overbought levels but still maintains underlying bullish strength. This could mean the market is resetting after a strong rally, allowing room for another leg up if buying continues.
Ethereum price is up 43.5% over the past seven days, with its market cap climbing back above $300 billion. Its EMA lines continue to show a strong bullish structure, reinforcing the current uptrend.
However, ETH recently tested the $2,617 resistance and failed to break through.
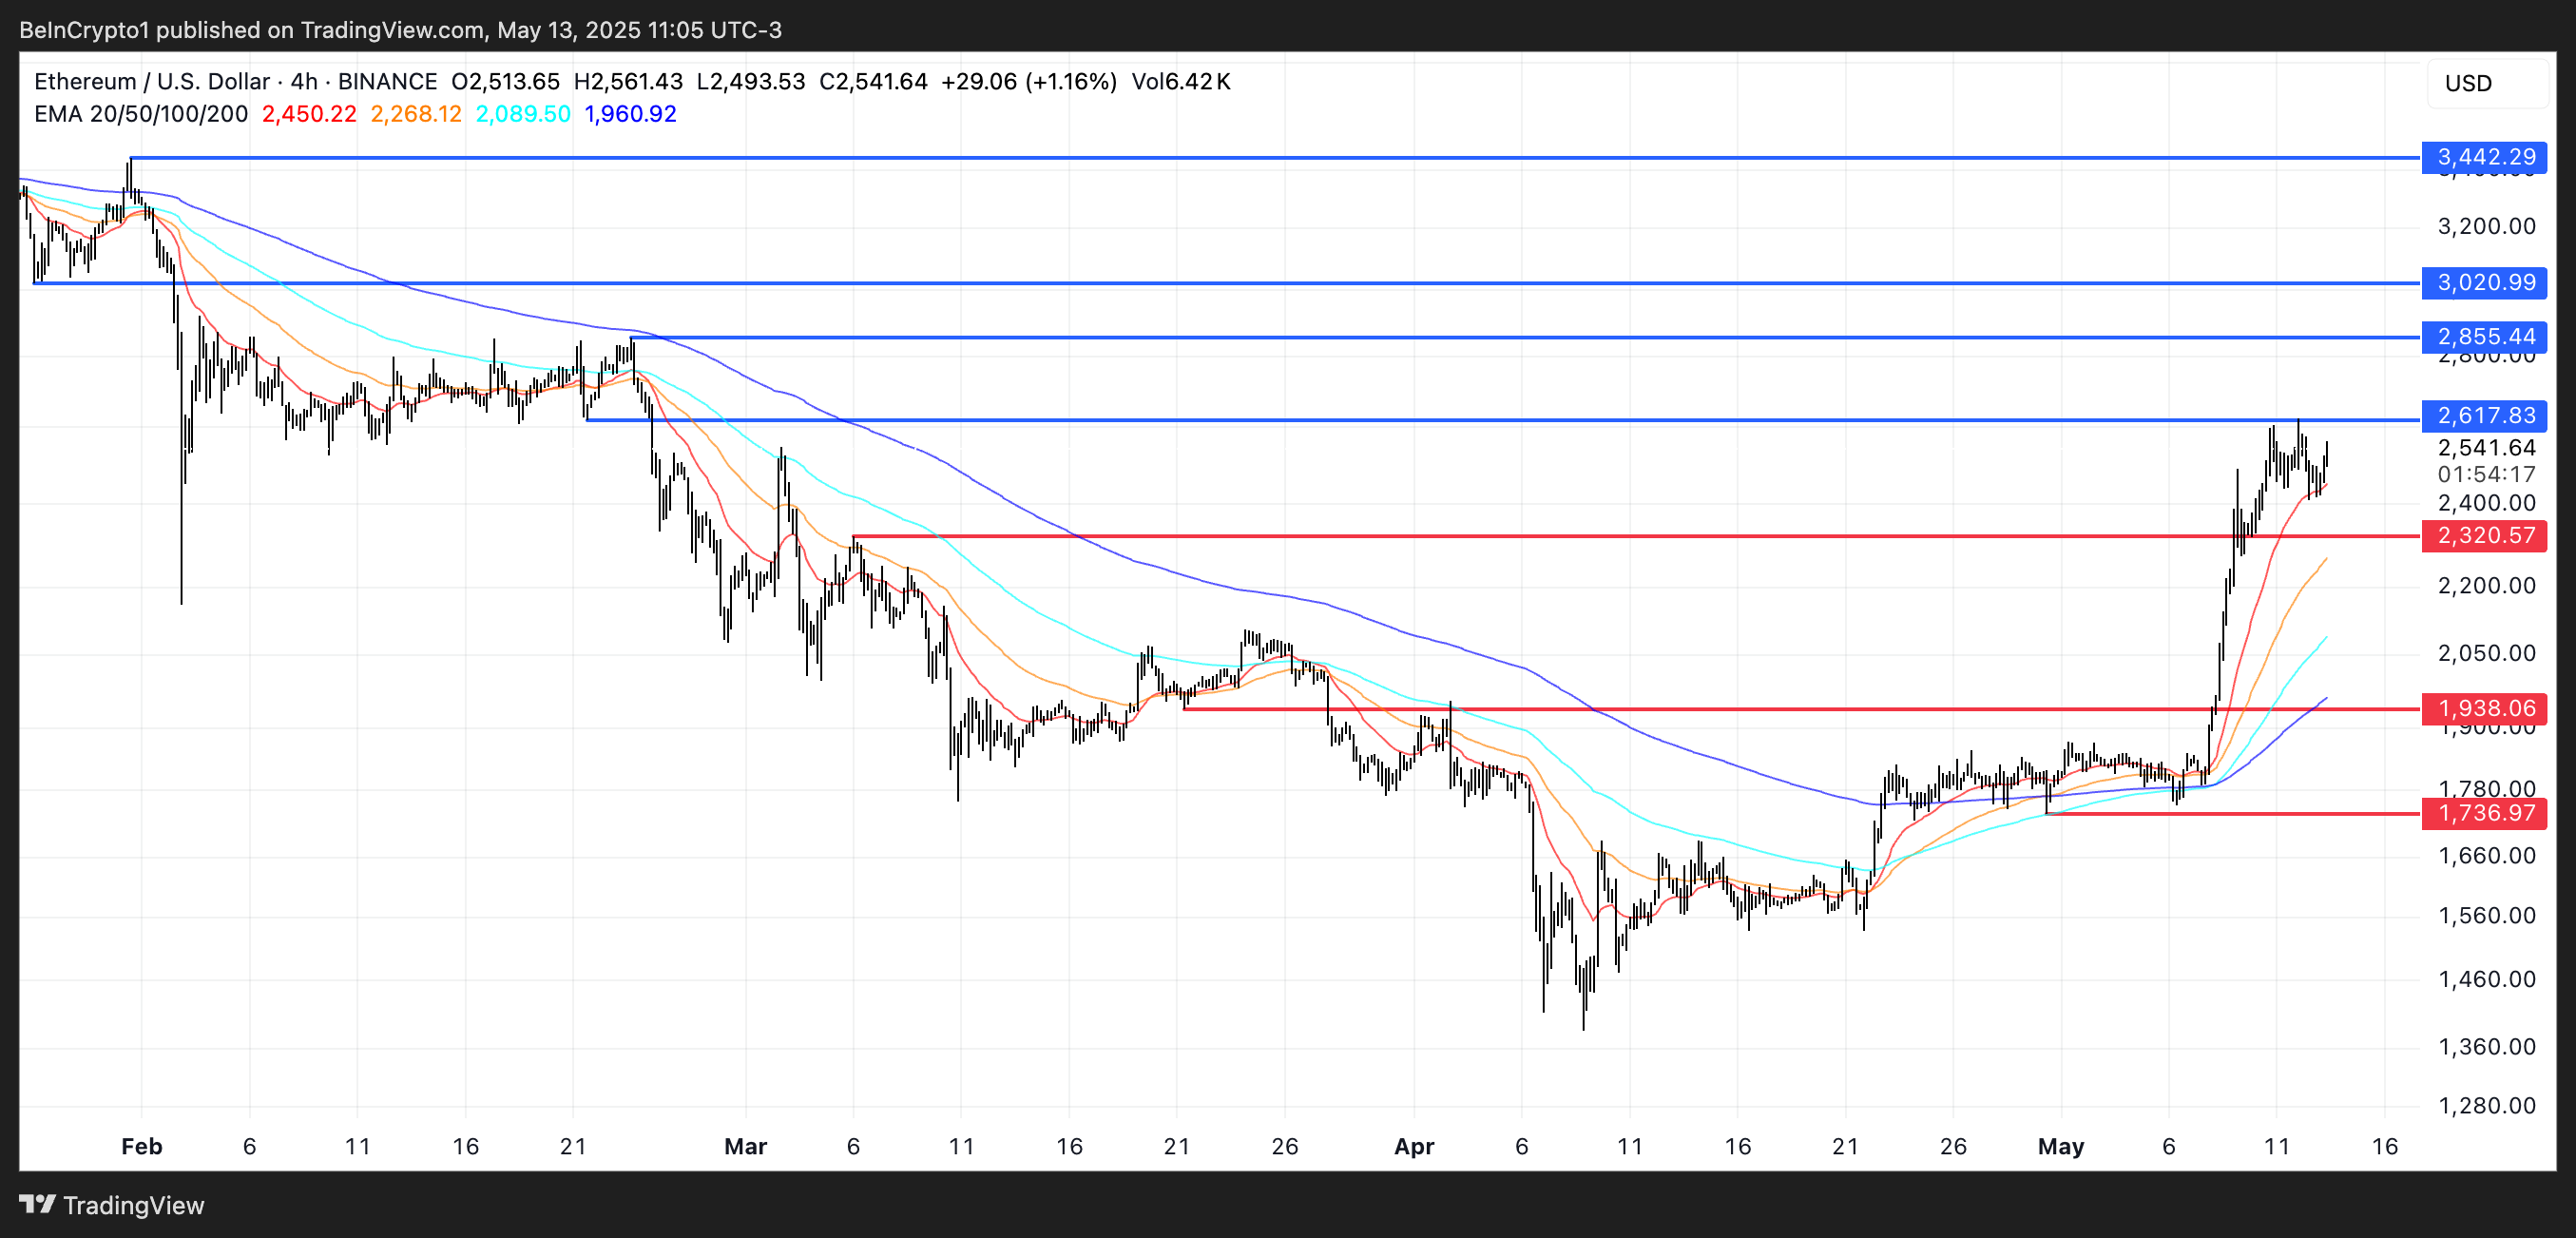
A successful breakout above that level could open the path toward $2,855 and even $3,000 for the first time since early February, with a possible extension to $3,442 if momentum accelerates.
On the downside, the $2,320 support is key. If ETH tests and loses that level, the price could slide to $1,938. A stronger bearish move might push it further down to $1,736.
Disclaimer
In line with the Trust Project guidelines, this price analysis article is for informational purposes only and should not be considered financial or investment advice. BeInCrypto is committed to accurate, unbiased reporting, but market conditions are subject to change without notice. Always conduct your own research and consult with a professional before making any financial decisions. Please note that our Terms and Conditions, Privacy Policy, and Disclaimers have been updated.

Search
RECENT PRESS RELEASES
Related Post


