Ethereum Faces Critical Support Test at $2,456 as Whale Activity Signals Potential 80% Ral
June 1, 2025
Despite major technical headwinds, Ethereum (ETH/USD) trades around $2,500 on Monday and has been holding mostly steady over the past 24 h
Written by:
Arslan Butt
•
Monday, June 2, 2025
•
3 min read
Quick overview
- Ethereum is currently trading around $2,500, facing bearish momentum after a recent decline from the $2,724 resistance level.
- Key support at the 200-day EMA around $2,456 is critical, with potential declines toward $2,302 if this level fails.
- Despite negative technical indicators, on-chain data suggests institutional accumulation, indicating a possible trend reversal.
- Security concerns have arisen from Ethereum’s Pectra upgrade, highlighting the need for user education regarding smart contract vulnerabilities.
Despite major technical headwinds, Ethereum ETH/USD trades around $2,500 on Monday and has been holding mostly steady over the past 24 hours. With technical signs pointing to possible downside concerns and on-chain data showing institutional accumulation might drive a significant rise, the second-largest cryptocurrency in the world finds itself in a critical juncture.
ETH/USD Technical Analysis Reveals Bearish Momentum Building
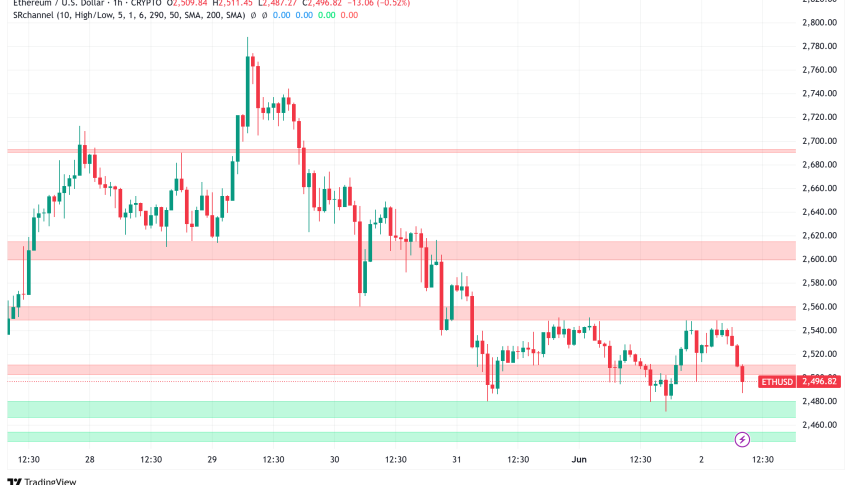
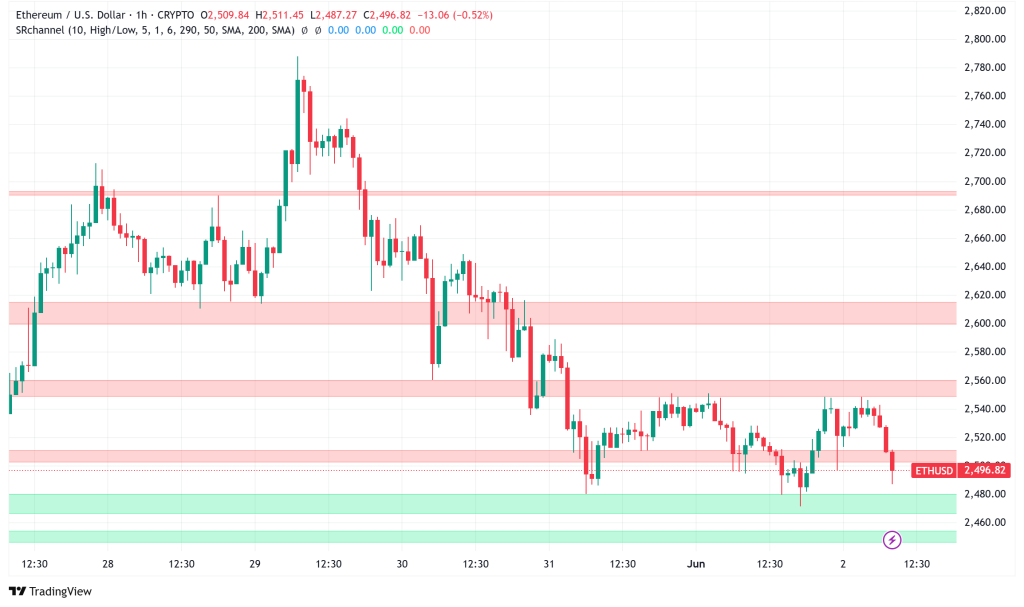
Ethereum’s price action has turned increasingly bearish following Thursday’s loss at the $2,724 resistance level. This led Friday’s sharp 5.7% decline. Since then, the bitcoin has had irregular support around its 200-day Exponential Moving Average (EMA) at $2,456 throughout weekend trading sessions.
From technical standpoint, ETH bulls have a worrying picture. Having been turned down from overbought levels close to 70 last week, the daily chart’s Relative Strength Index (RSI) currently reads 54. Now pointing down toward the neutral 50 level, the indicator indicates fading positive momentum over several timeframes.
The MACD indicator has shown a negative crossover, so confirming momentum’s weakness and implying a possible continuation of the declining trend, so augmenting the pessimistic attitude. The hourly RSI has dropped below the key 50 level while the hourly MACD is gathering momentum in the bearish zone on shorter timesframes.
ETH/USD
Key Support Levels Could Determine ETH’s Next Move
The 200-day EMA around $2,456 is under close observation by market watchers after it has given vital support over the weekend. Should this level fail to hold, technical study indicates ETH could prolong its fall toward the next significant support at $2,302, corresponding with the 50-day EMA.
Any possible recovery faces several obstacles shown by the immediate resistance structure. First opposition is at $2,550; the more important $2,600 level follows. Near $2,620, the first main resistance zone corresponds with the 50% Fibonacci retracing level of the most recent downward movement from $2,787 to the $2,470 low.
A break below the $2,470 support zone could set off more selling activity, therefore guiding ETH toward $2,420 and finally the $2,350-$2,320 support cluster.
ETH Whale Activity Suggests Institutional Accumulation
Although the technical assessment is negative, on-chain data reveals an astonishing tale of institutional accumulation. After May 19, Ethereum’s average order size on Binance has notably dropped, according to analysis by pseudonymous crypto analyst Darkfost, indicating new whale interest in the coin.
Dividing total trading volume by the number of trades produces this statistic indicating which of retail traders or large institutional investors influence market activity. The present indications suggest that large investors are preparing themselves for a possible trend reversal.
Particularly in December 2023, just before ETH surged from $2,200 to $4,000, displaying an incredible 80% rise, the last time this indicator displayed like levels. Based on this past trend, analysts think Ethereum might be preparing for yet another notable rise higher in the next months.
Security Concerns Emerge with Pectra Upgrade
Ethereum deals fresh security concerns as technical and on-chain indicators present a conflicting picture. Market maker Wintermute has found malicious contracts using Ethereum’s most recent Pectra upgrade’s EIP-7702 capability, which lets smart contracts temporary wallet delegation.
According to research, over 97% of EIP-7702 delegations were approved to contracts with same code used to automatically drain ETH from hacked addresses. Recent losses of $146,550 by hostile batch transactions by one user emphasize the need of user education and security consciousness.
Ethereum Price Prediction and Market Outlook
For Ethereum, the confluence of negative technical indicators with positive whale accumulation produces a complex market dynamic. A break below the $2,456 support would lead a near-term decline towards $2,300, therefore reflecting a probable 8% decrease from current levels.
Should ETH defend the 200-day EMA and break over $2,724 resistance, the road towards the psychologically critical $3,000 mark will most likely open. Targeting the $4,000-$ 4,500 zone over the next 3-6 months, a prolonged break above current resistance levels could perhaps imply upside potential of 60-80% based on prior whale accumulation patterns.
- Check out our free forex signals
- Follow the top economic events on FX Leaders economic calendar
- Trade better, discover more Forex Trading Strategies
- Open a FREE Trading Account
Related Articles
Search
RECENT PRESS RELEASES
Related Post


