Ethereum Price Analysis: Can ETH Stabilize, or Is Another Pullback Brewing?
November 24, 2025
Ethereum remains under heavy pressure as the broader crypto market continues its correction. With the price losing key support levels and sentiment growing increasingly cautious, all eyes are on whether ETH can stabilize above major zones, or if another leg down is coming.
Technical Analysis
By Shayan
The Daily Chart
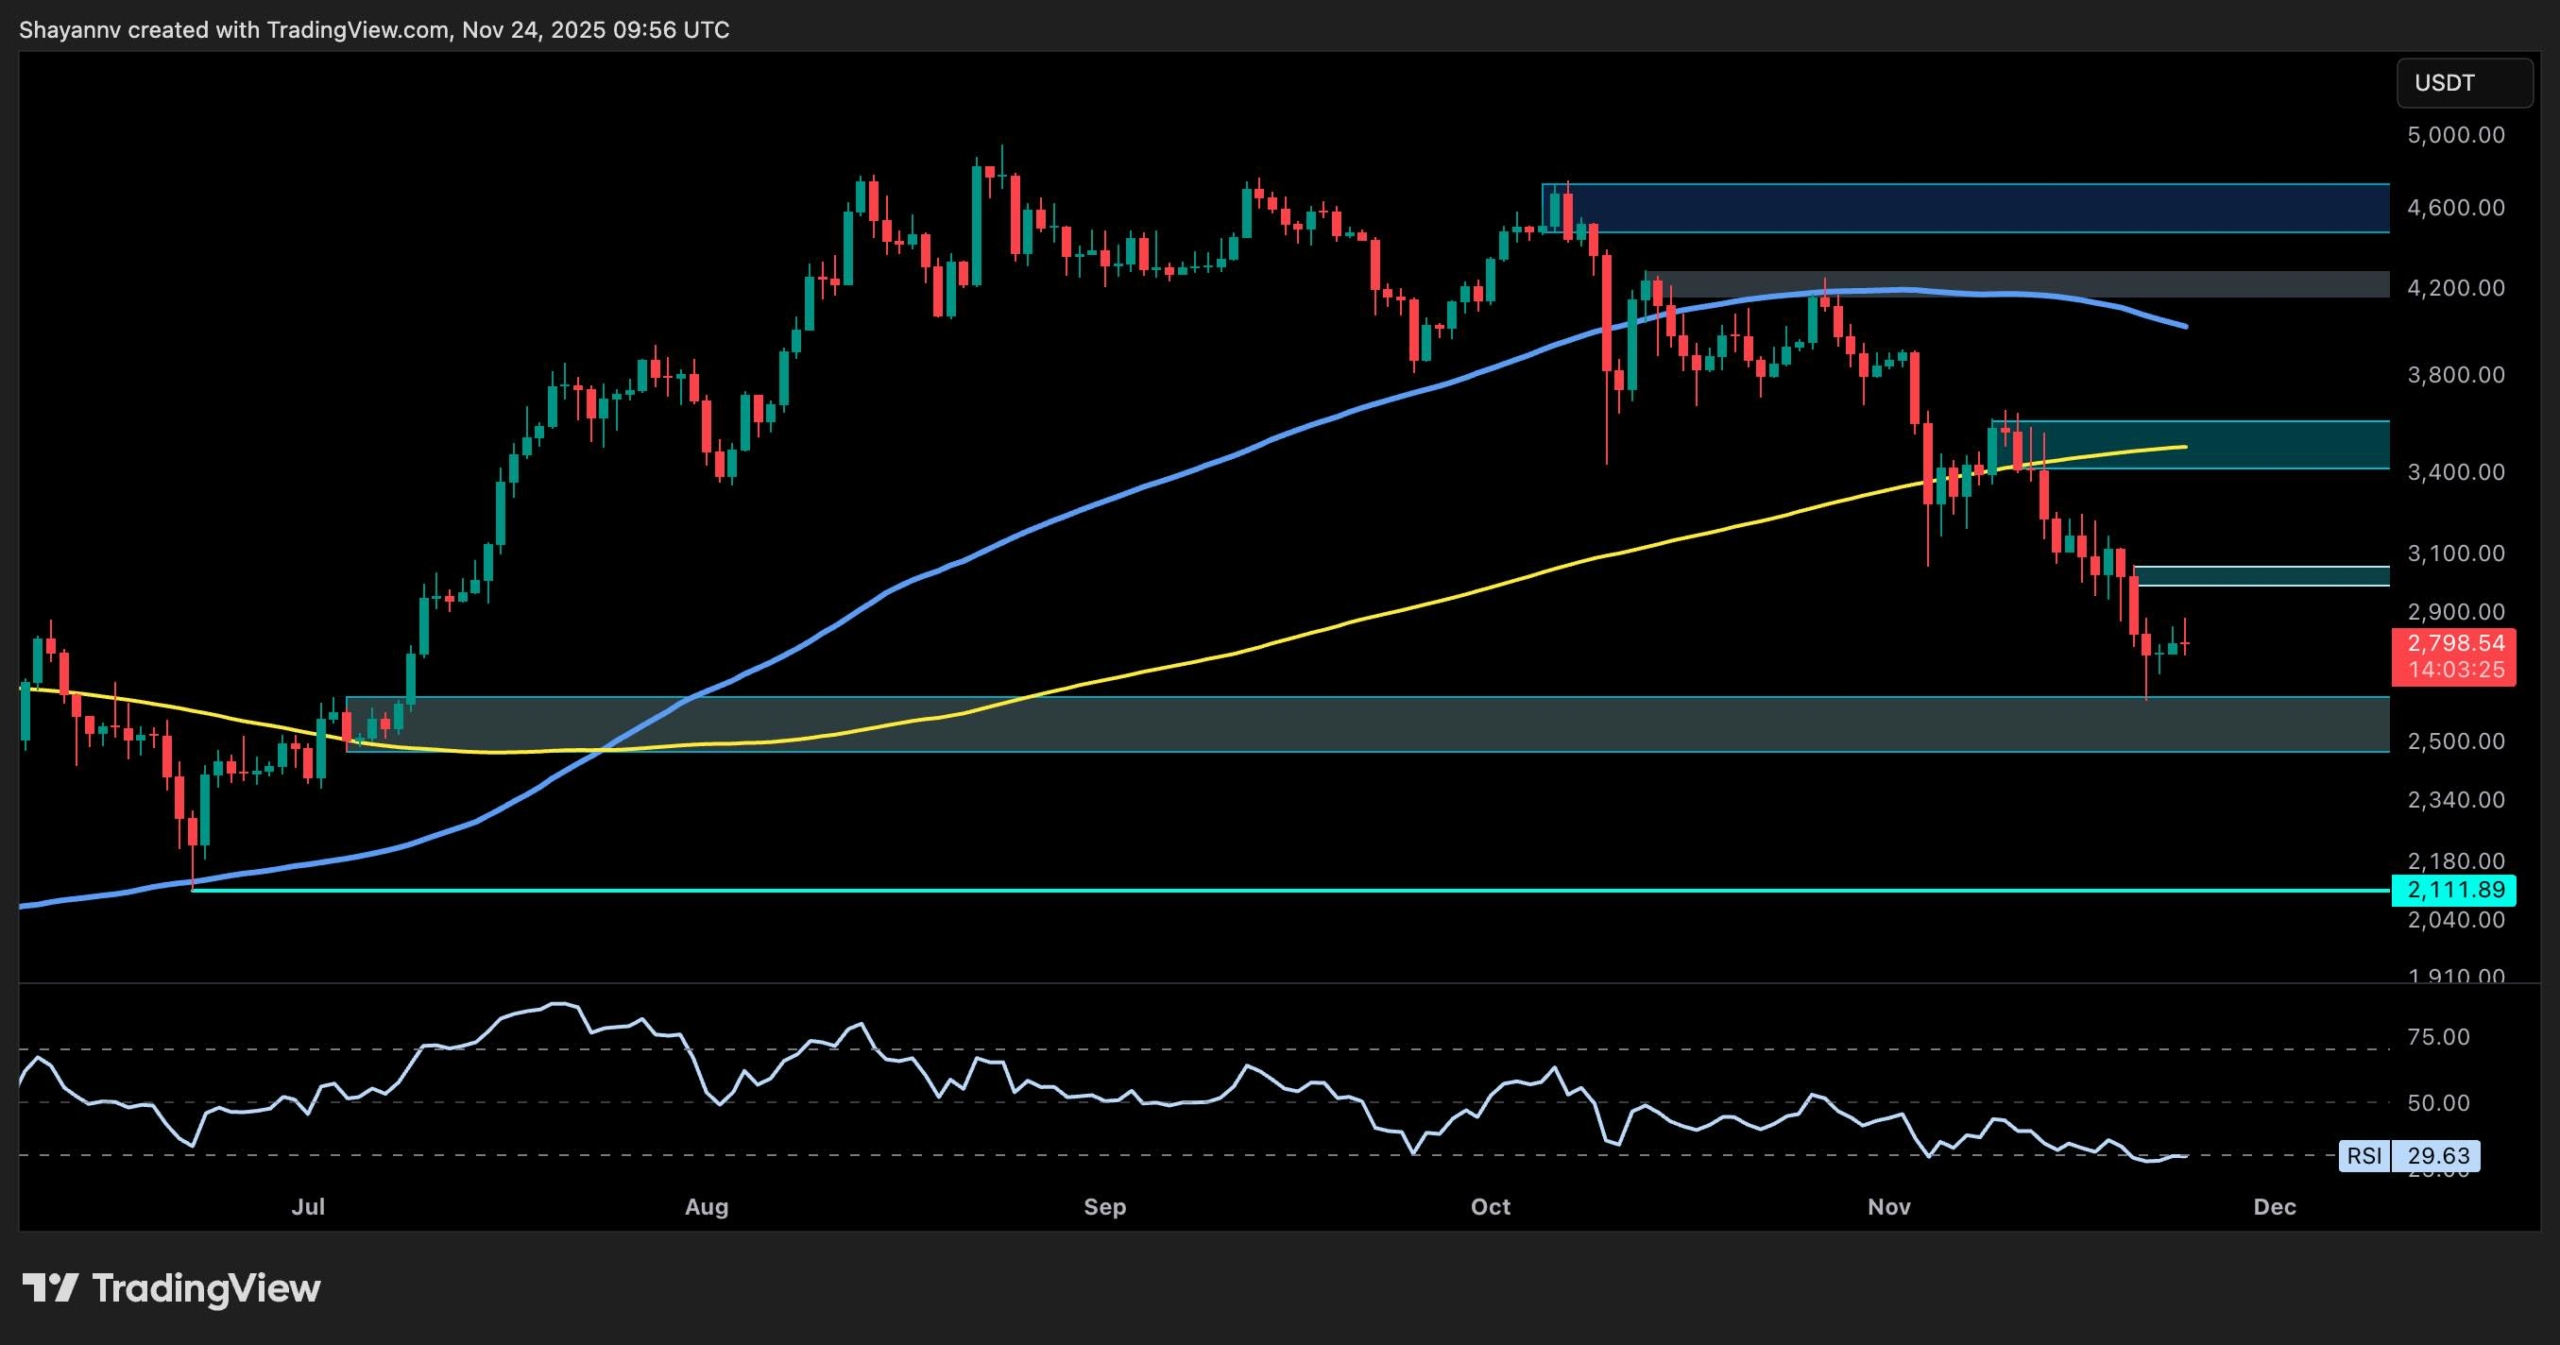
On the daily timeframe, ETH has fallen below both its 100-day and 200-day moving averages, currently hovering around $2,800. This breakdown came after several days of consolidation near the $3,000 level, which acted as a weak support before the market finally cracked.
The RSI also sits deep near the oversold territory around 30, reflecting strong bearish momentum. If the asset fails to reclaim the $3,000–$3,100 zone soon, the next significant support lies around $2,500, a previous demand zone that could act as a potential bounce area.
The 4-Hour Chart
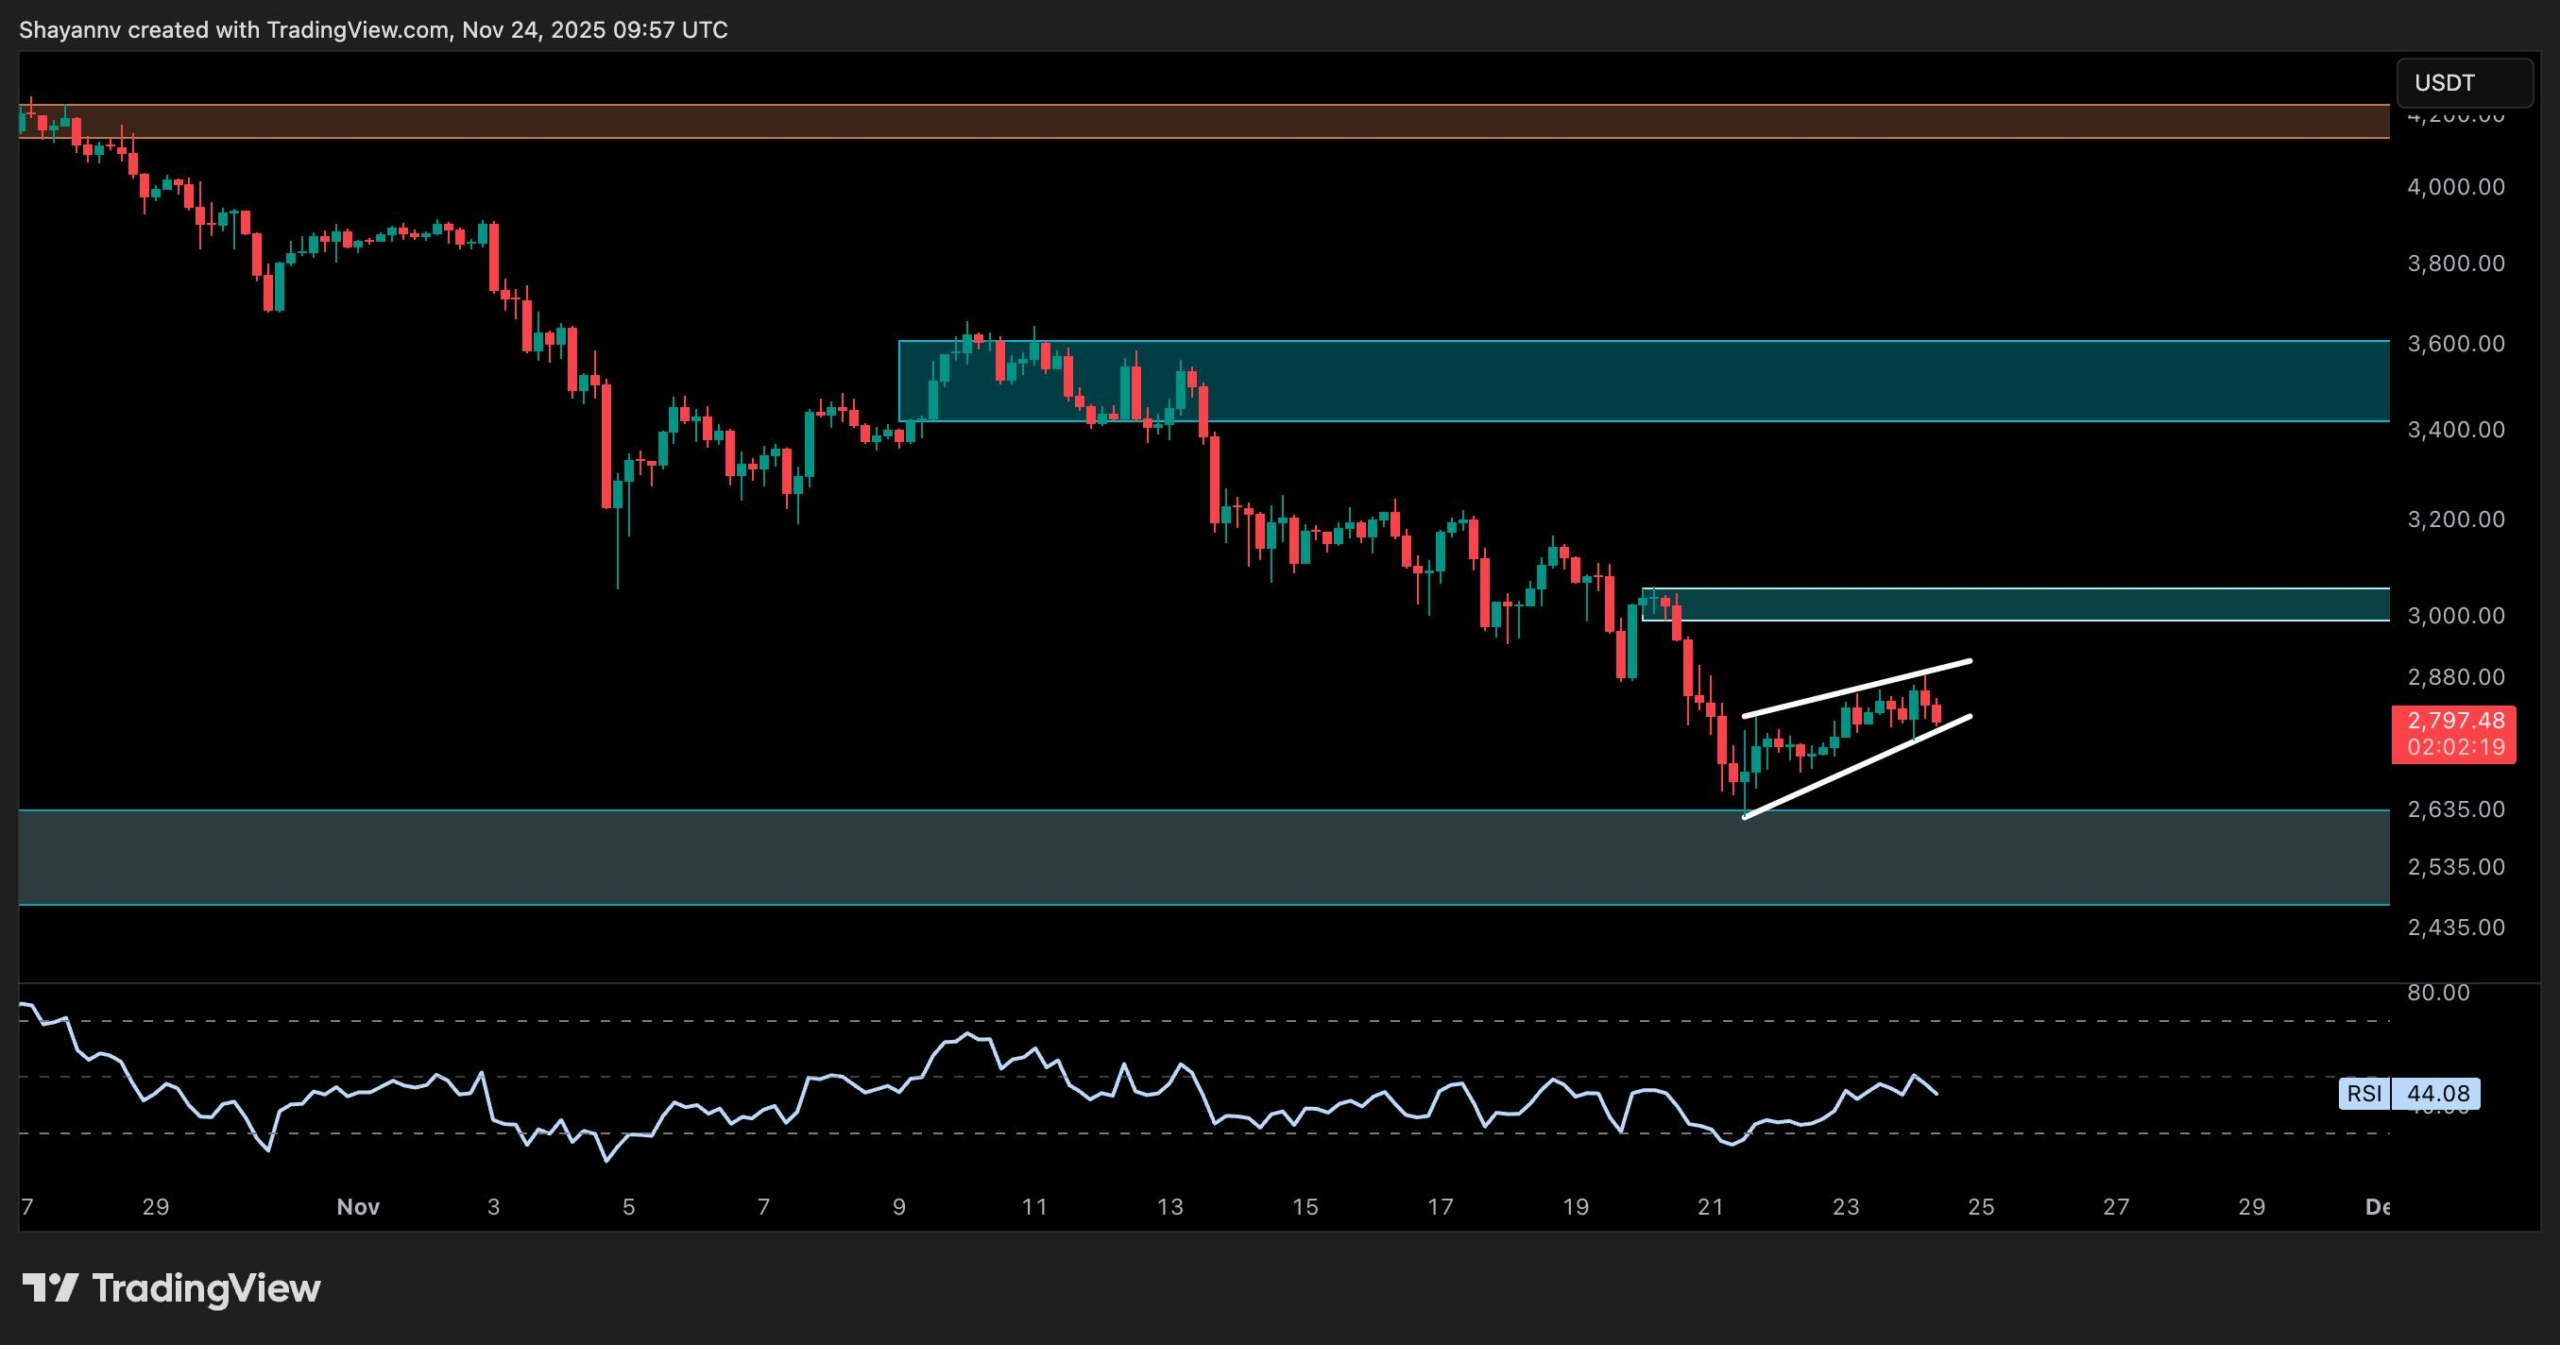
Zooming into the 4-hour chart, ETH has formed a bearish rising wedge pattern during its recent relief move, typically a continuation setup in downtrends. The price is now on the verge of breaking below the wedge, indicating sellers are still in control.
If this breakdown is confirmed, another test of the $2,500 support area will be very likely. The RSI on this timeframe is also trending downward, failing to break above 50, which shows momentum is still favoring the sellers.
As a result, it might all come down to the $2,500 level: whether it can hold the price or break down and pave the way for a much deeper retracement.
On-Chain Analysis
Exchange Netflows
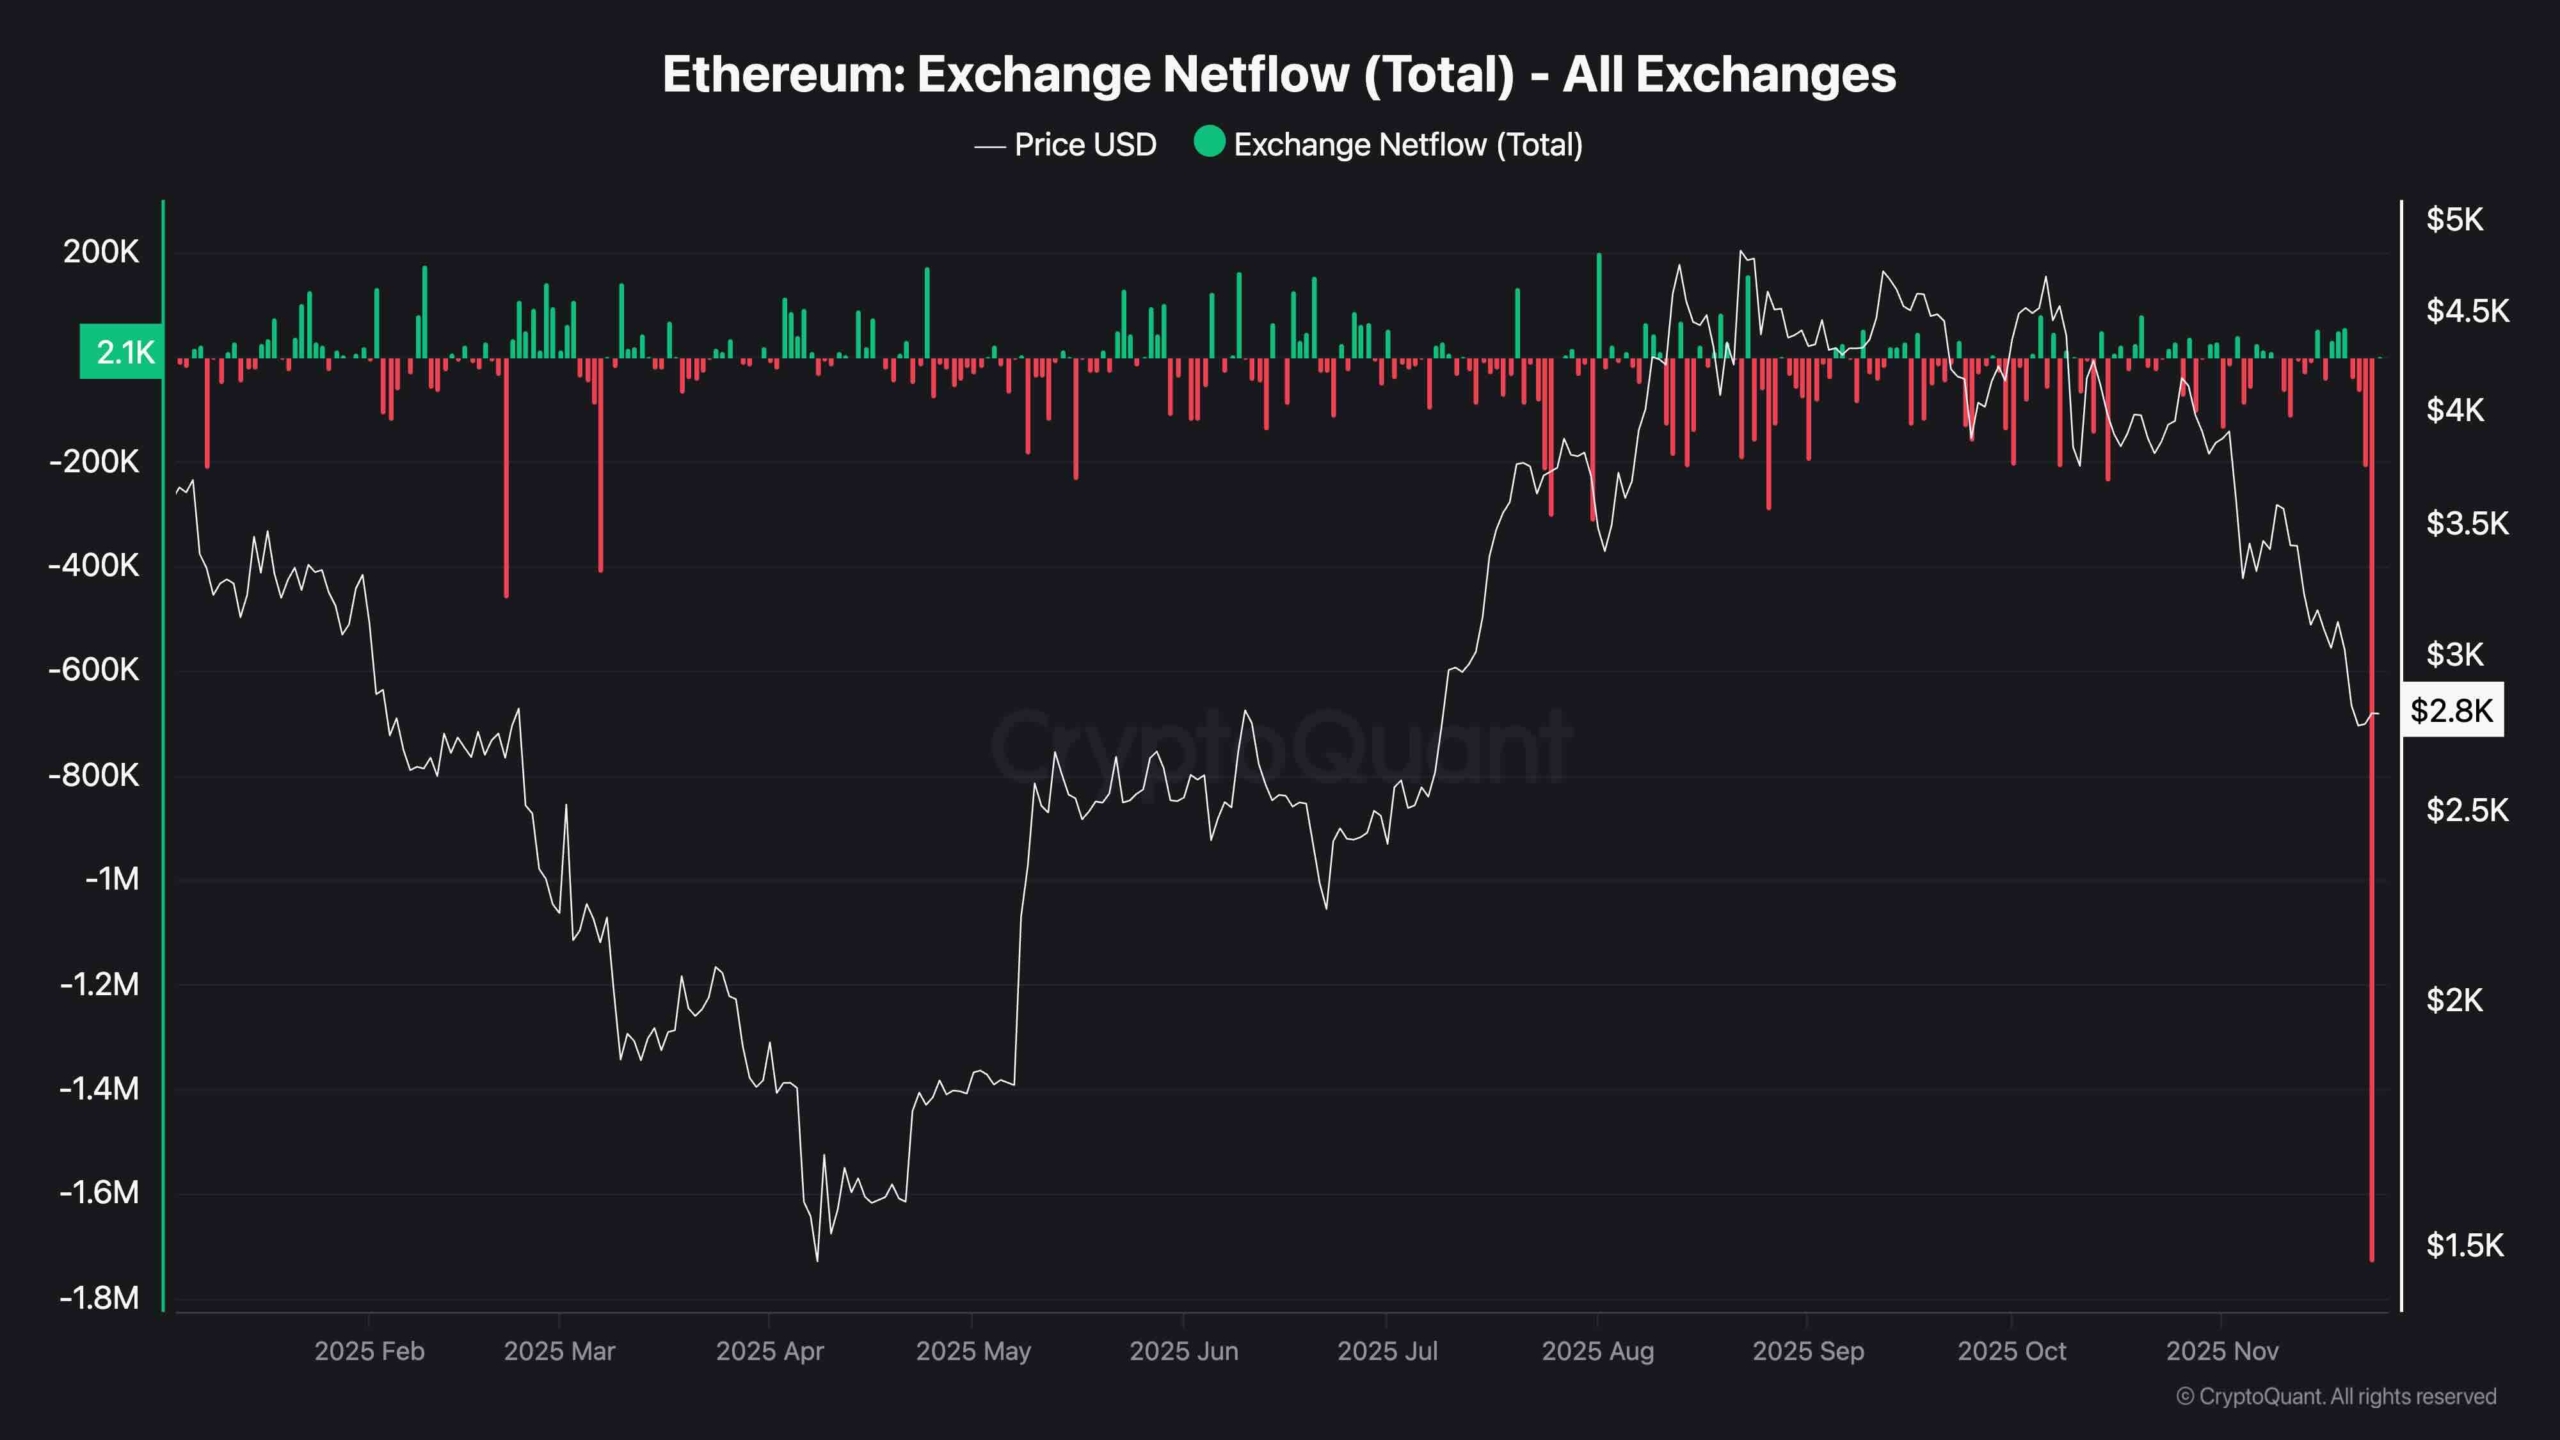
On Sunday, November 23rd, Ethereum saw a sharp spike in outflows from exchanges, resulting in one of the largest negative netflows of recent years. This means a significant amount of ETH was withdrawn from centralized exchanges.
There are a few possible interpretations: whales or institutions could be moving funds to cold wallets amid price weakness, anticipating accumulation opportunities, or long-term holding. Alternatively, it could indicate users avoiding custodial risk in fear of further selloffs.
Either way, this kind of behavior typically reduces immediate selling pressure on exchanges but doesn’t guarantee a bottom unless accompanied by bullish price action or strong inflows to DeFi and staking platforms. For now, this netflow data shows some signs of cautious accumulation but not full-blown reversal optimism.
SECRET PARTNERSHIP BONUS for CryptoPotato readers: Use this link to register and unlock $1,500 in exclusive BingX Exchange rewards (limited time offer).
Disclaimer: Information found on CryptoPotato is those of writers quoted. It does not represent the opinions of CryptoPotato on whether to buy, sell, or hold any investments. You are advised to conduct your own research before making any investment decisions. Use provided information at your own risk. See Disclaimer for more information.
Cryptocurrency charts by TradingView.
Search
RECENT PRESS RELEASES
Related Post


