Ethereum Price Analysis: Is Today’s 8% Decline the Start of a Bigger Correction for ETH?
December 1, 2025
Ethereum’s recent rally into the $3,000 zone has quickly stalled, as the market once again reacted to a dense liquidity cluster and the dominant downtrend structure.
Both the technical structure and on-chain liquidation data suggest that ETH remains in a corrective phase, with critical support levels now coming into focus as the market approaches an important decision point.
Technical Analysis
By Shayan
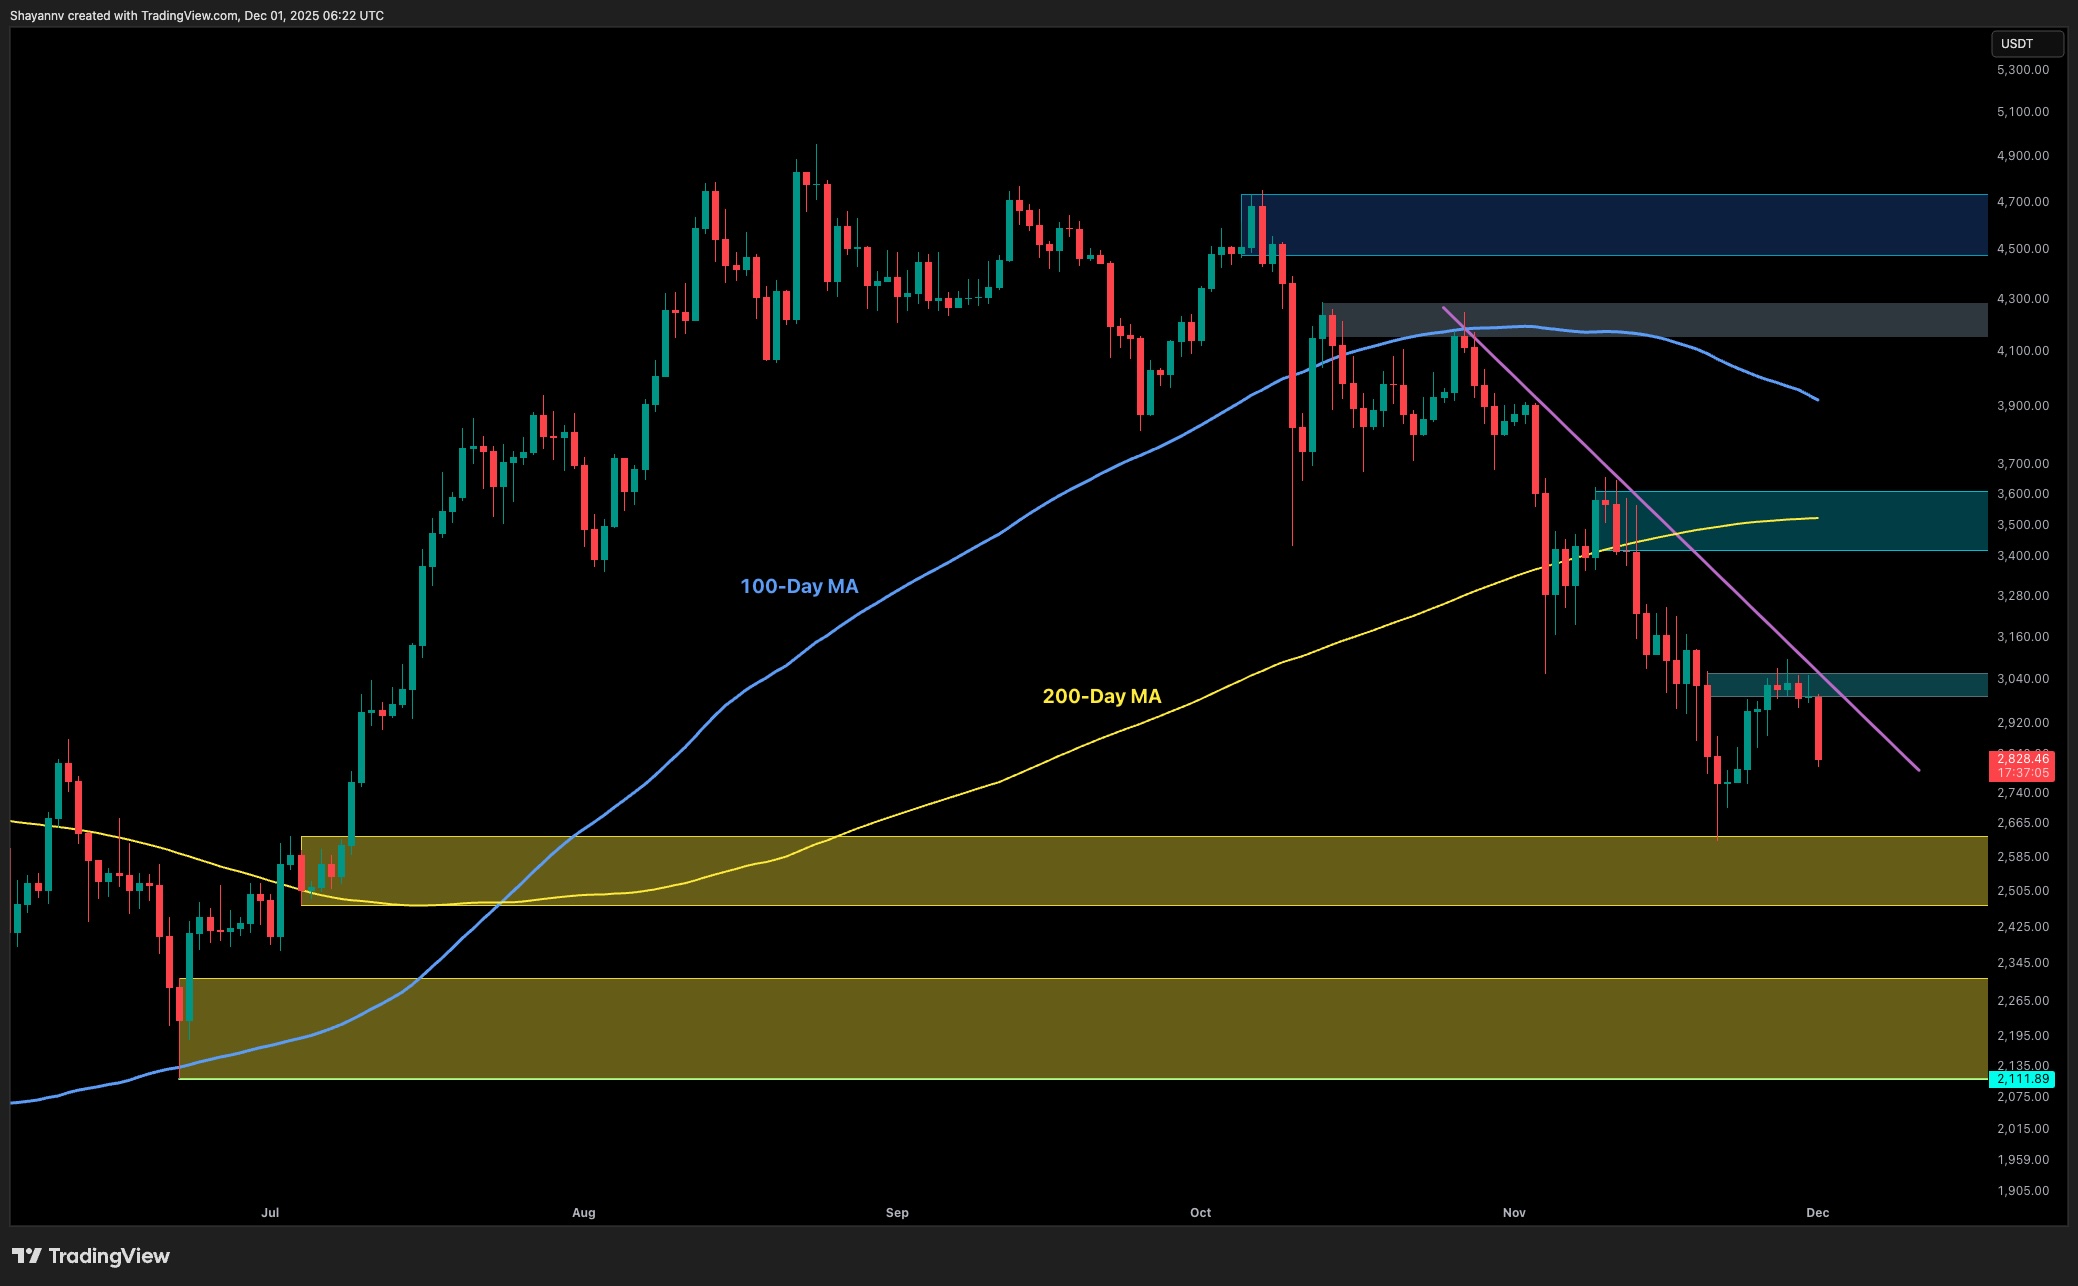
The Daily Chart
Ethereum continues to trade below both the 100-day and 200-day moving averages, confirming the medium-term bearish market structure. The breakdown from $3,200 initiated a sustained correction that carried the price into the $2,630–$2,680 decision point, the final significant HTF support before the broader macro accumulation range.
The recent attempt to reclaim the descending trendline on the daily chart failed, reinforcing bearish order flow. Unless Ethereum can recover above the $3,200–$3,350 region and print a structurally higher high, rallies into the mid-range are likely to encounter supply absorption rather than continuation.
If the current daily support fails to hold, the $2,110–$2,200 macro demand zone becomes the next logical liquidity magnet and represents the high-timeframe accumulation area from which the previous multi-month rally originated.
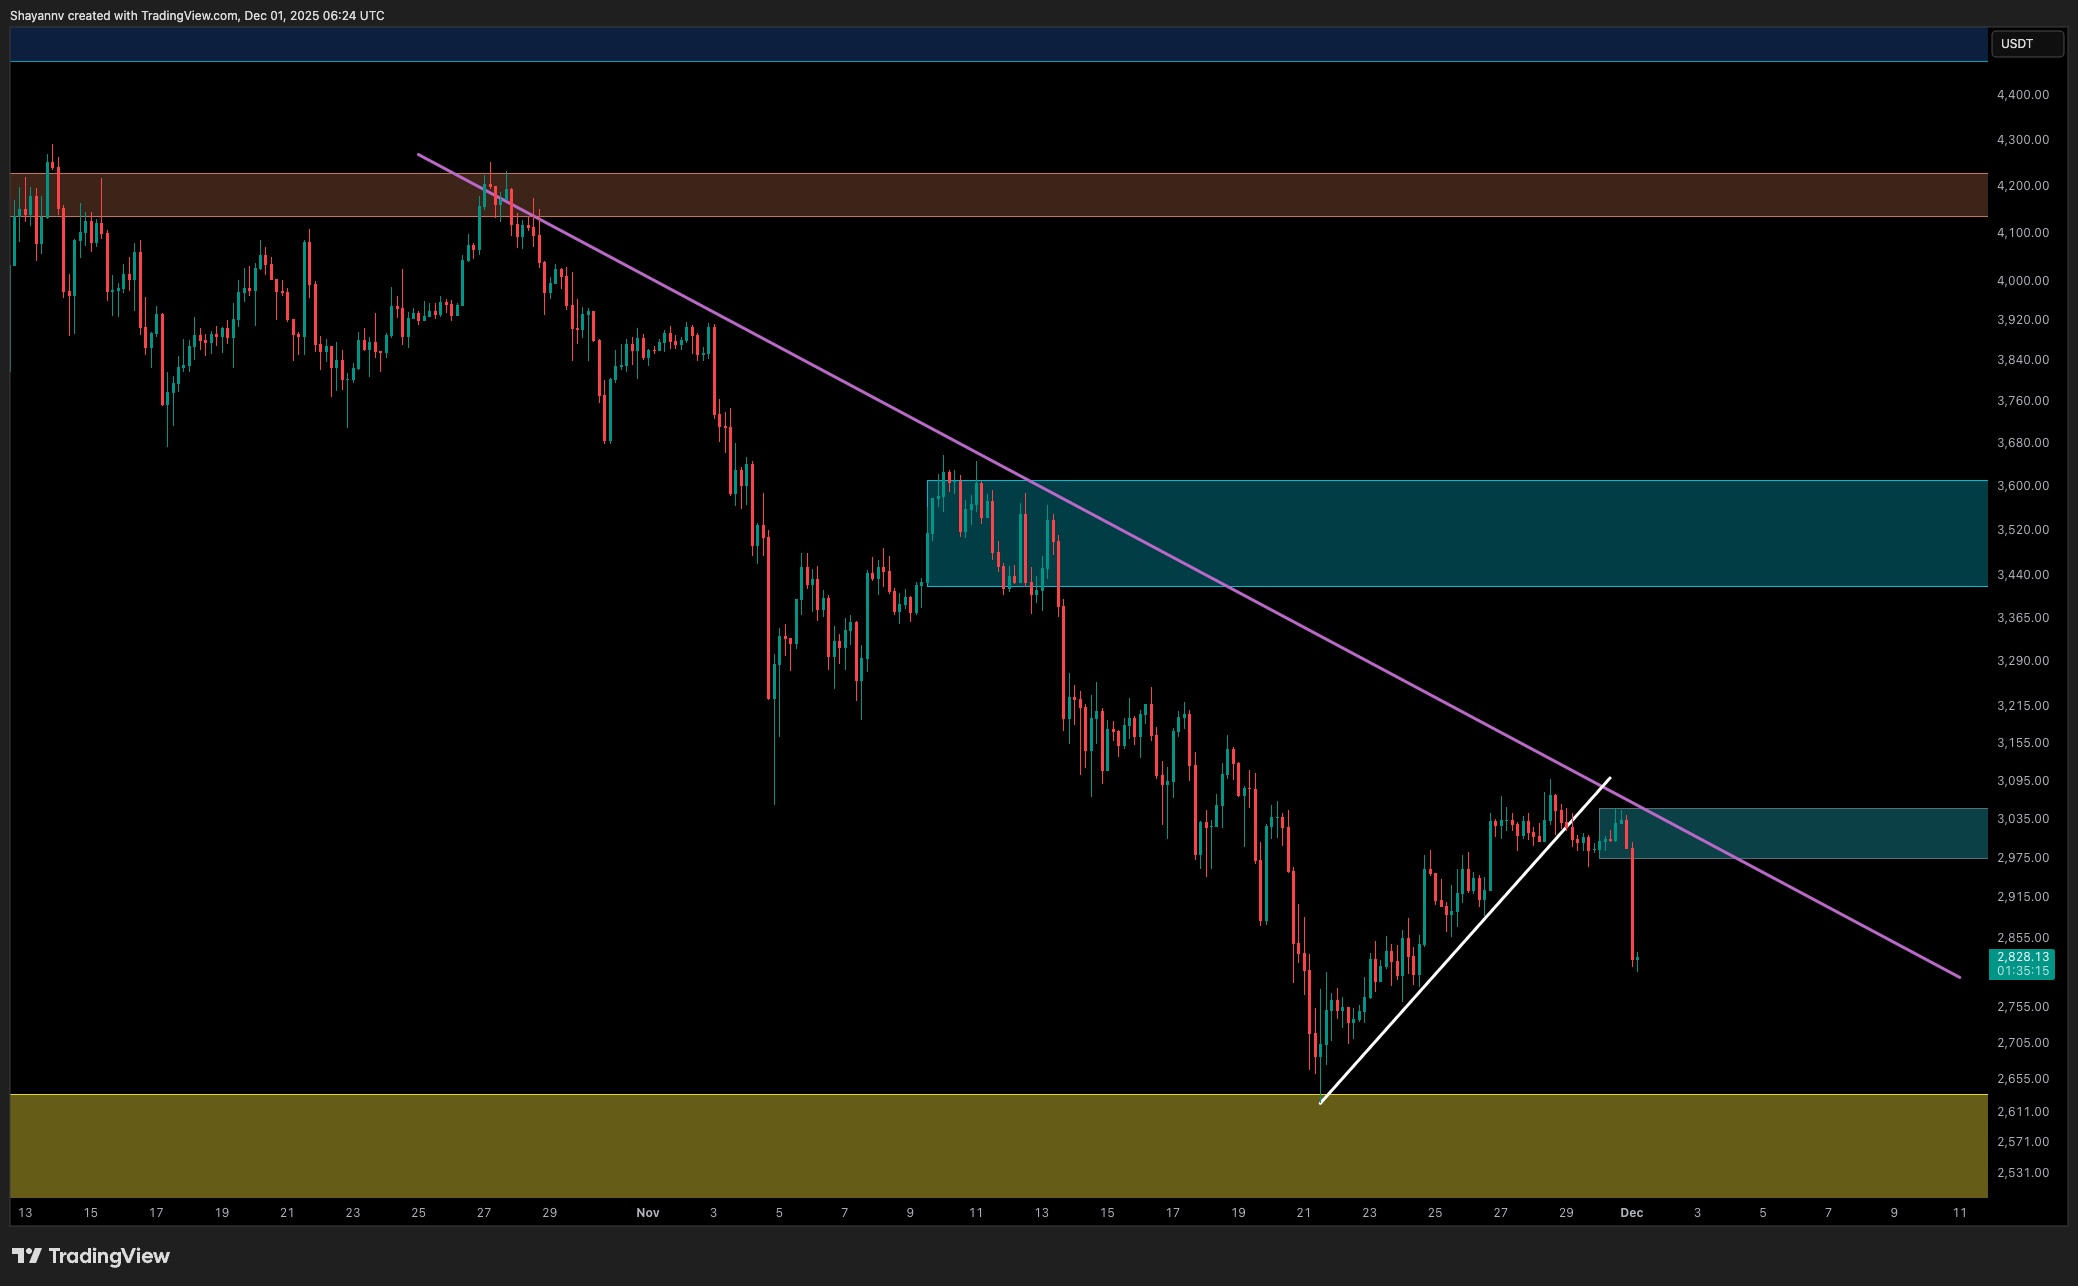
The 4-Hour Chart
Ethereum has rejected sharply from the $3,030–$3,080 supply zone, where price collided with a confluence of liquidity, a bearish 4H order block, and the descending trendline acting as dynamic resistance. The sharp sell-off that followed confirms that sellers continue to dominate rallies into structure, maintaining the broader downtrend that has persisted since early November.
The short-term structure shows a clear deviation. Ethereum reached the micro ascending channel but failed to secure a breakout, forming a swing failure pattern that triggered an impulsive decline back below the trendline. This behaviour aligned with the absence of strong spot demand, suggesting that buyers remain reactive rather than initiative-driven.
A liquidity void now sits between $2,750 and $2,800, the next immediate downside target if support at $2,820 gives way. Below that, the $2,630–$2,680 zone remains the major short-term demand block where stronger hands previously absorbed sell pressure. Ethereum must reclaim the $3,030–$3,080 imbalance and break above the descending trendline to shift momentum back toward $3,450–$3,550.
Sentiment Analysis
By Shayan
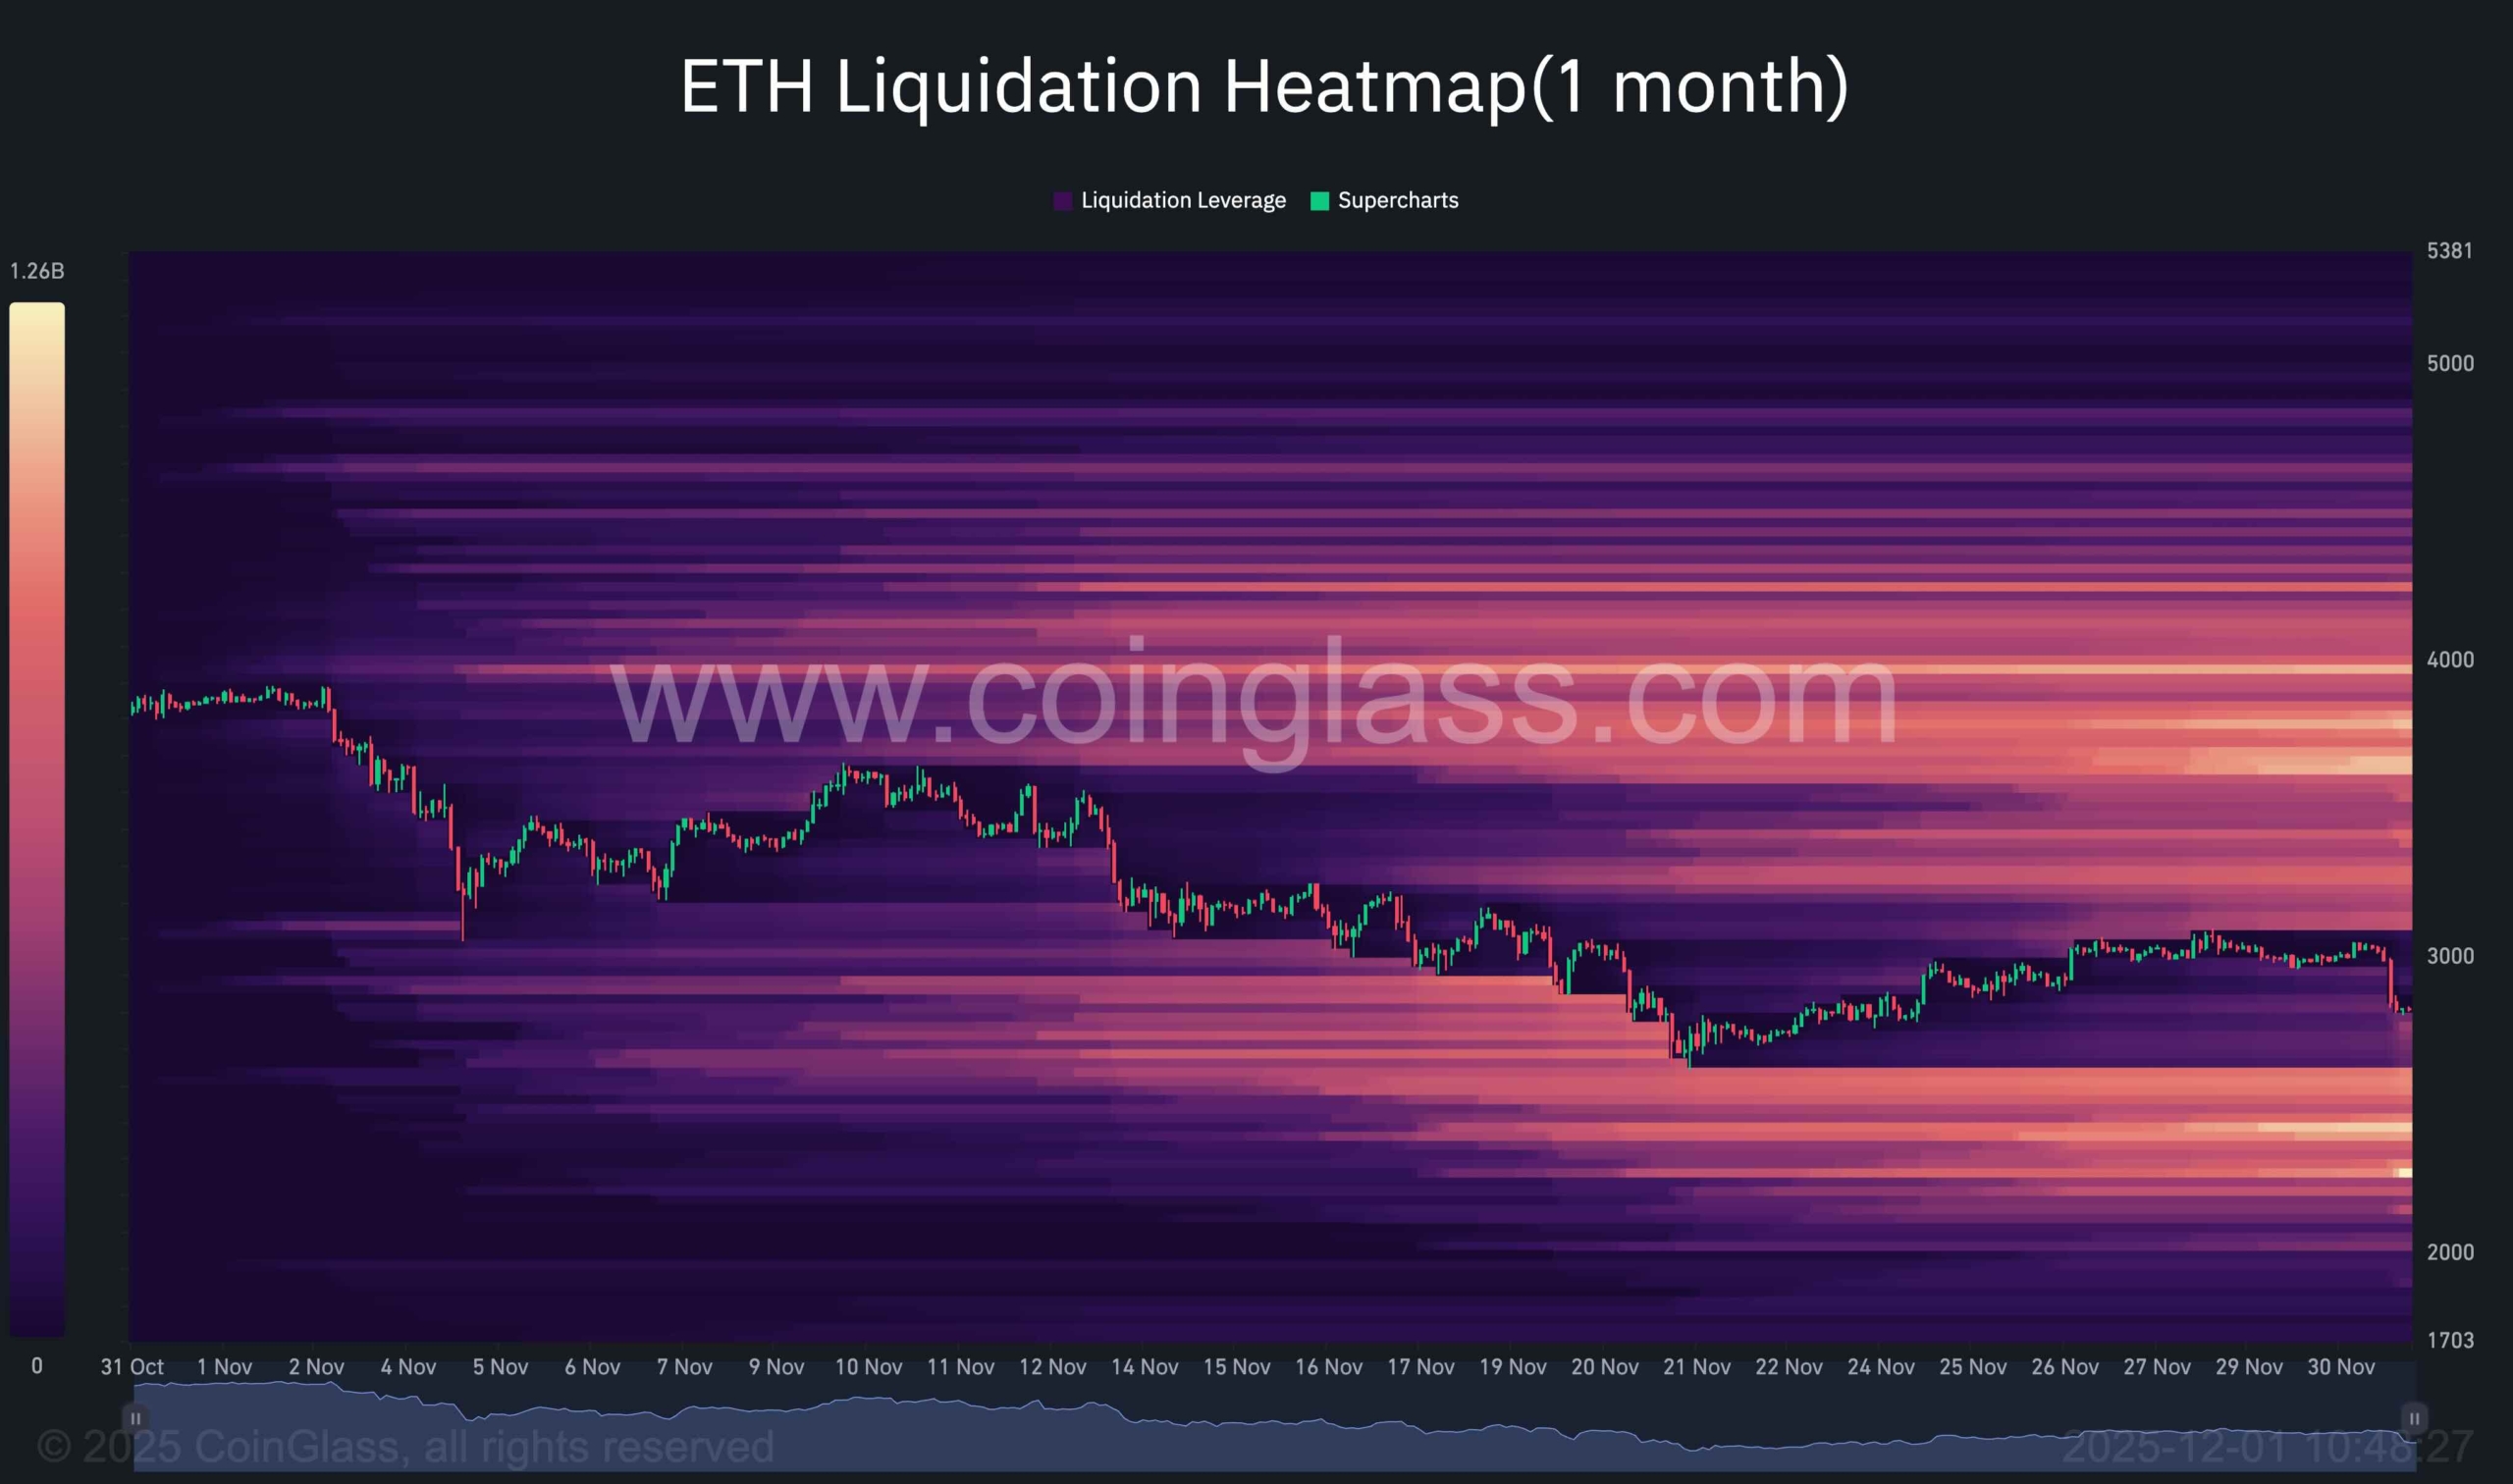
The one-month liquidation heatmap shows significant leverage concentrations between $3,200 and $3,600, reflecting the clustering of long positions that continue to get trapped during each corrective wave. As prices approach these levels, repeated liquidations generate heavy sell pressure, preventing sustained upside continuation.
This top-heavy leverage profile aligns with the recent rejections seen in the technical structure. Each attempt to push above the $3,000 threshold has interacted with dense liquidation bands, leading to rapid reversals.
In contrast, the region beneath price shows far less liquidation density until the $2,400–$2,500 range. This absence of support liquidity implies that if the $2,630–$2,680 decision point breaks, the next leg down could unfold swiftly toward the larger macro demand block.
Overall, on-chain positioning confirms a market where seller control is reinforced by poorly placed long leverage, while the deeper, more meaningful buy-side liquidity remains significantly lower.
SECRET PARTNERSHIP BONUS for CryptoPotato readers: Use this link to register and unlock $1,500 in exclusive BingX Exchange rewards (limited time offer).
Disclaimer: Information found on CryptoPotato is those of writers quoted. It does not represent the opinions of CryptoPotato on whether to buy, sell, or hold any investments. You are advised to conduct your own research before making any investment decisions. Use provided information at your own risk. See Disclaimer for more information.
Cryptocurrency charts by TradingView.
Search
RECENT PRESS RELEASES
Related Post


