Ethereum Price Analysis: Key Resistance Still Stands Between ETH and $4K
November 10, 2025
Ethereum has rebounded from the $3.2K region after a deep liquidity sweep, signaling potential exhaustion of the recent downtrend.
While short-term resistance remains strong, both technical and on-chain data suggest the market could be entering an accumulation phase led by larger participants.
Technical Analysis
By Shayan
The Daily Chart
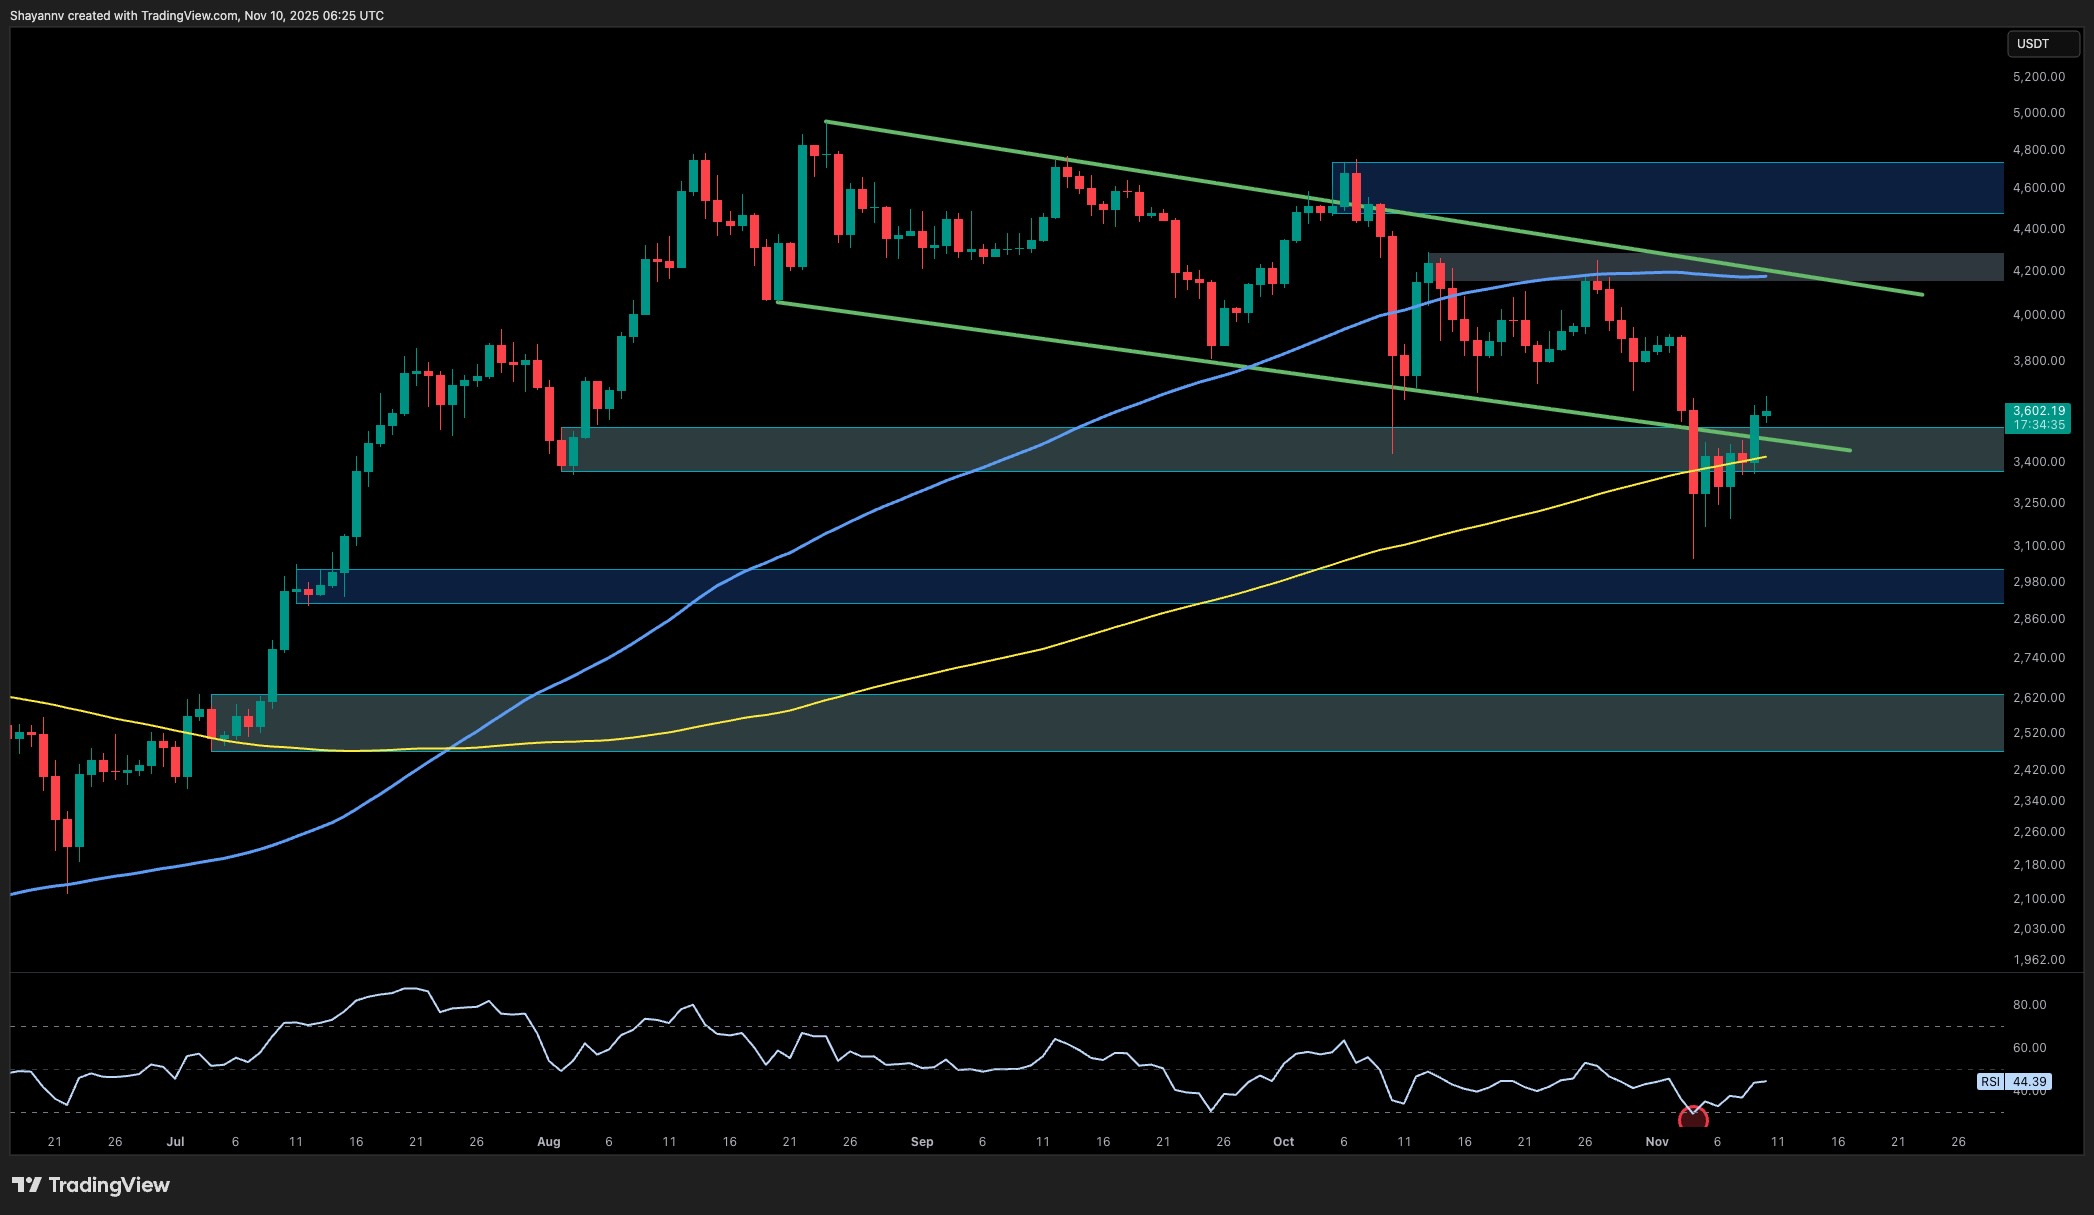
On the daily timeframe, ETH has rebounded decisively from the $3K–$3.2K demand block, which coincides with the channel’s lower trendline and the 200-day MA. This confluence zone acted as a powerful reaction base, leading to the formation of a long lower wick, evidence of liquidity absorption by stronger hands.
The recent breakout attempt from the descending parallel channel is the first constructive signal since mid-October. ETH is now retesting the $3.6K–$3.7K resistance cluster, marked by the intersection of the channel’s midline and an institutional decision point.
If buyers manage to close above this range, it would confirm a structural shift, potentially opening the path for continuation toward $3.9K–$4.0K, followed by the higher liquidity zone near $4.4K. However, failure to sustain above $3.6K may trigger a short-term retest of the $3K region, which now acts as the primary support.
The 4-Hour Chart
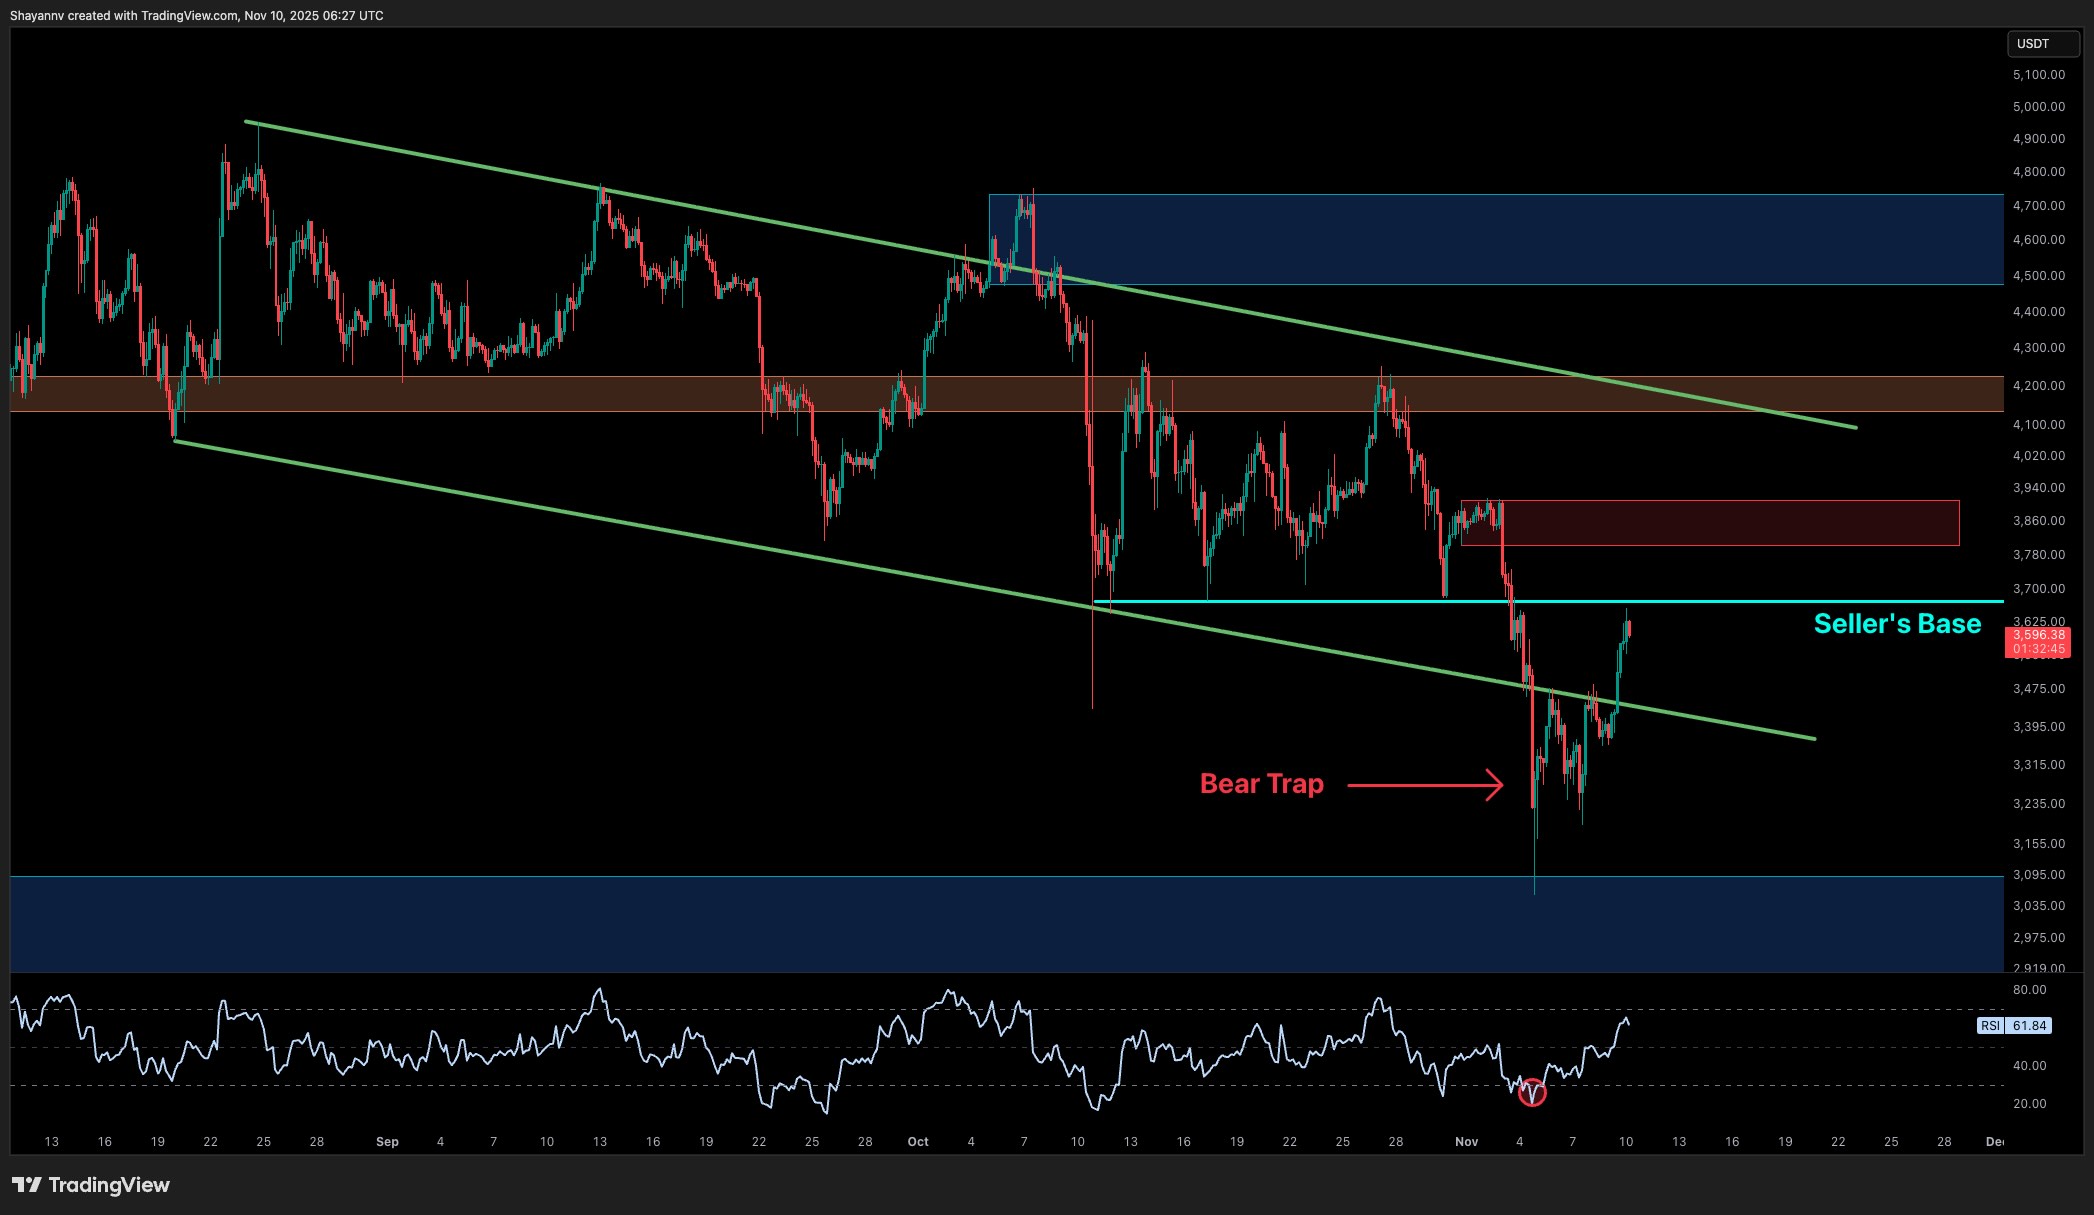
Zooming in, the 4-hour chart reveals the bear trap setup in more detail. Following an aggressive breakdown beneath $3.3K, Ethereum briefly extended into the $3K liquidity pocket, sweeping the lows of the descending channel before immediately reversing. This sharp reclaim invalidated the bearish momentum and triggered a short-term reversal phase.
Currently, price is consolidating just beneath the $3.6K–$3.7K “Seller’s Base,” which represents the last unmitigated supply region created before the previous decline. A clean breakout and retest of this base would likely confirm that market control has shifted back to the buyers. Until that occurs, ETH is expected to fluctuate between $3.4K and $3.7K, building structure before the next expansion leg.
RSI momentum supports this scenario; it has broken out of a multi-week bearish divergence trendline and is now climbing steadily, suggesting room for further recovery if the structure holds.
Sentiment Analysis
By Shayan
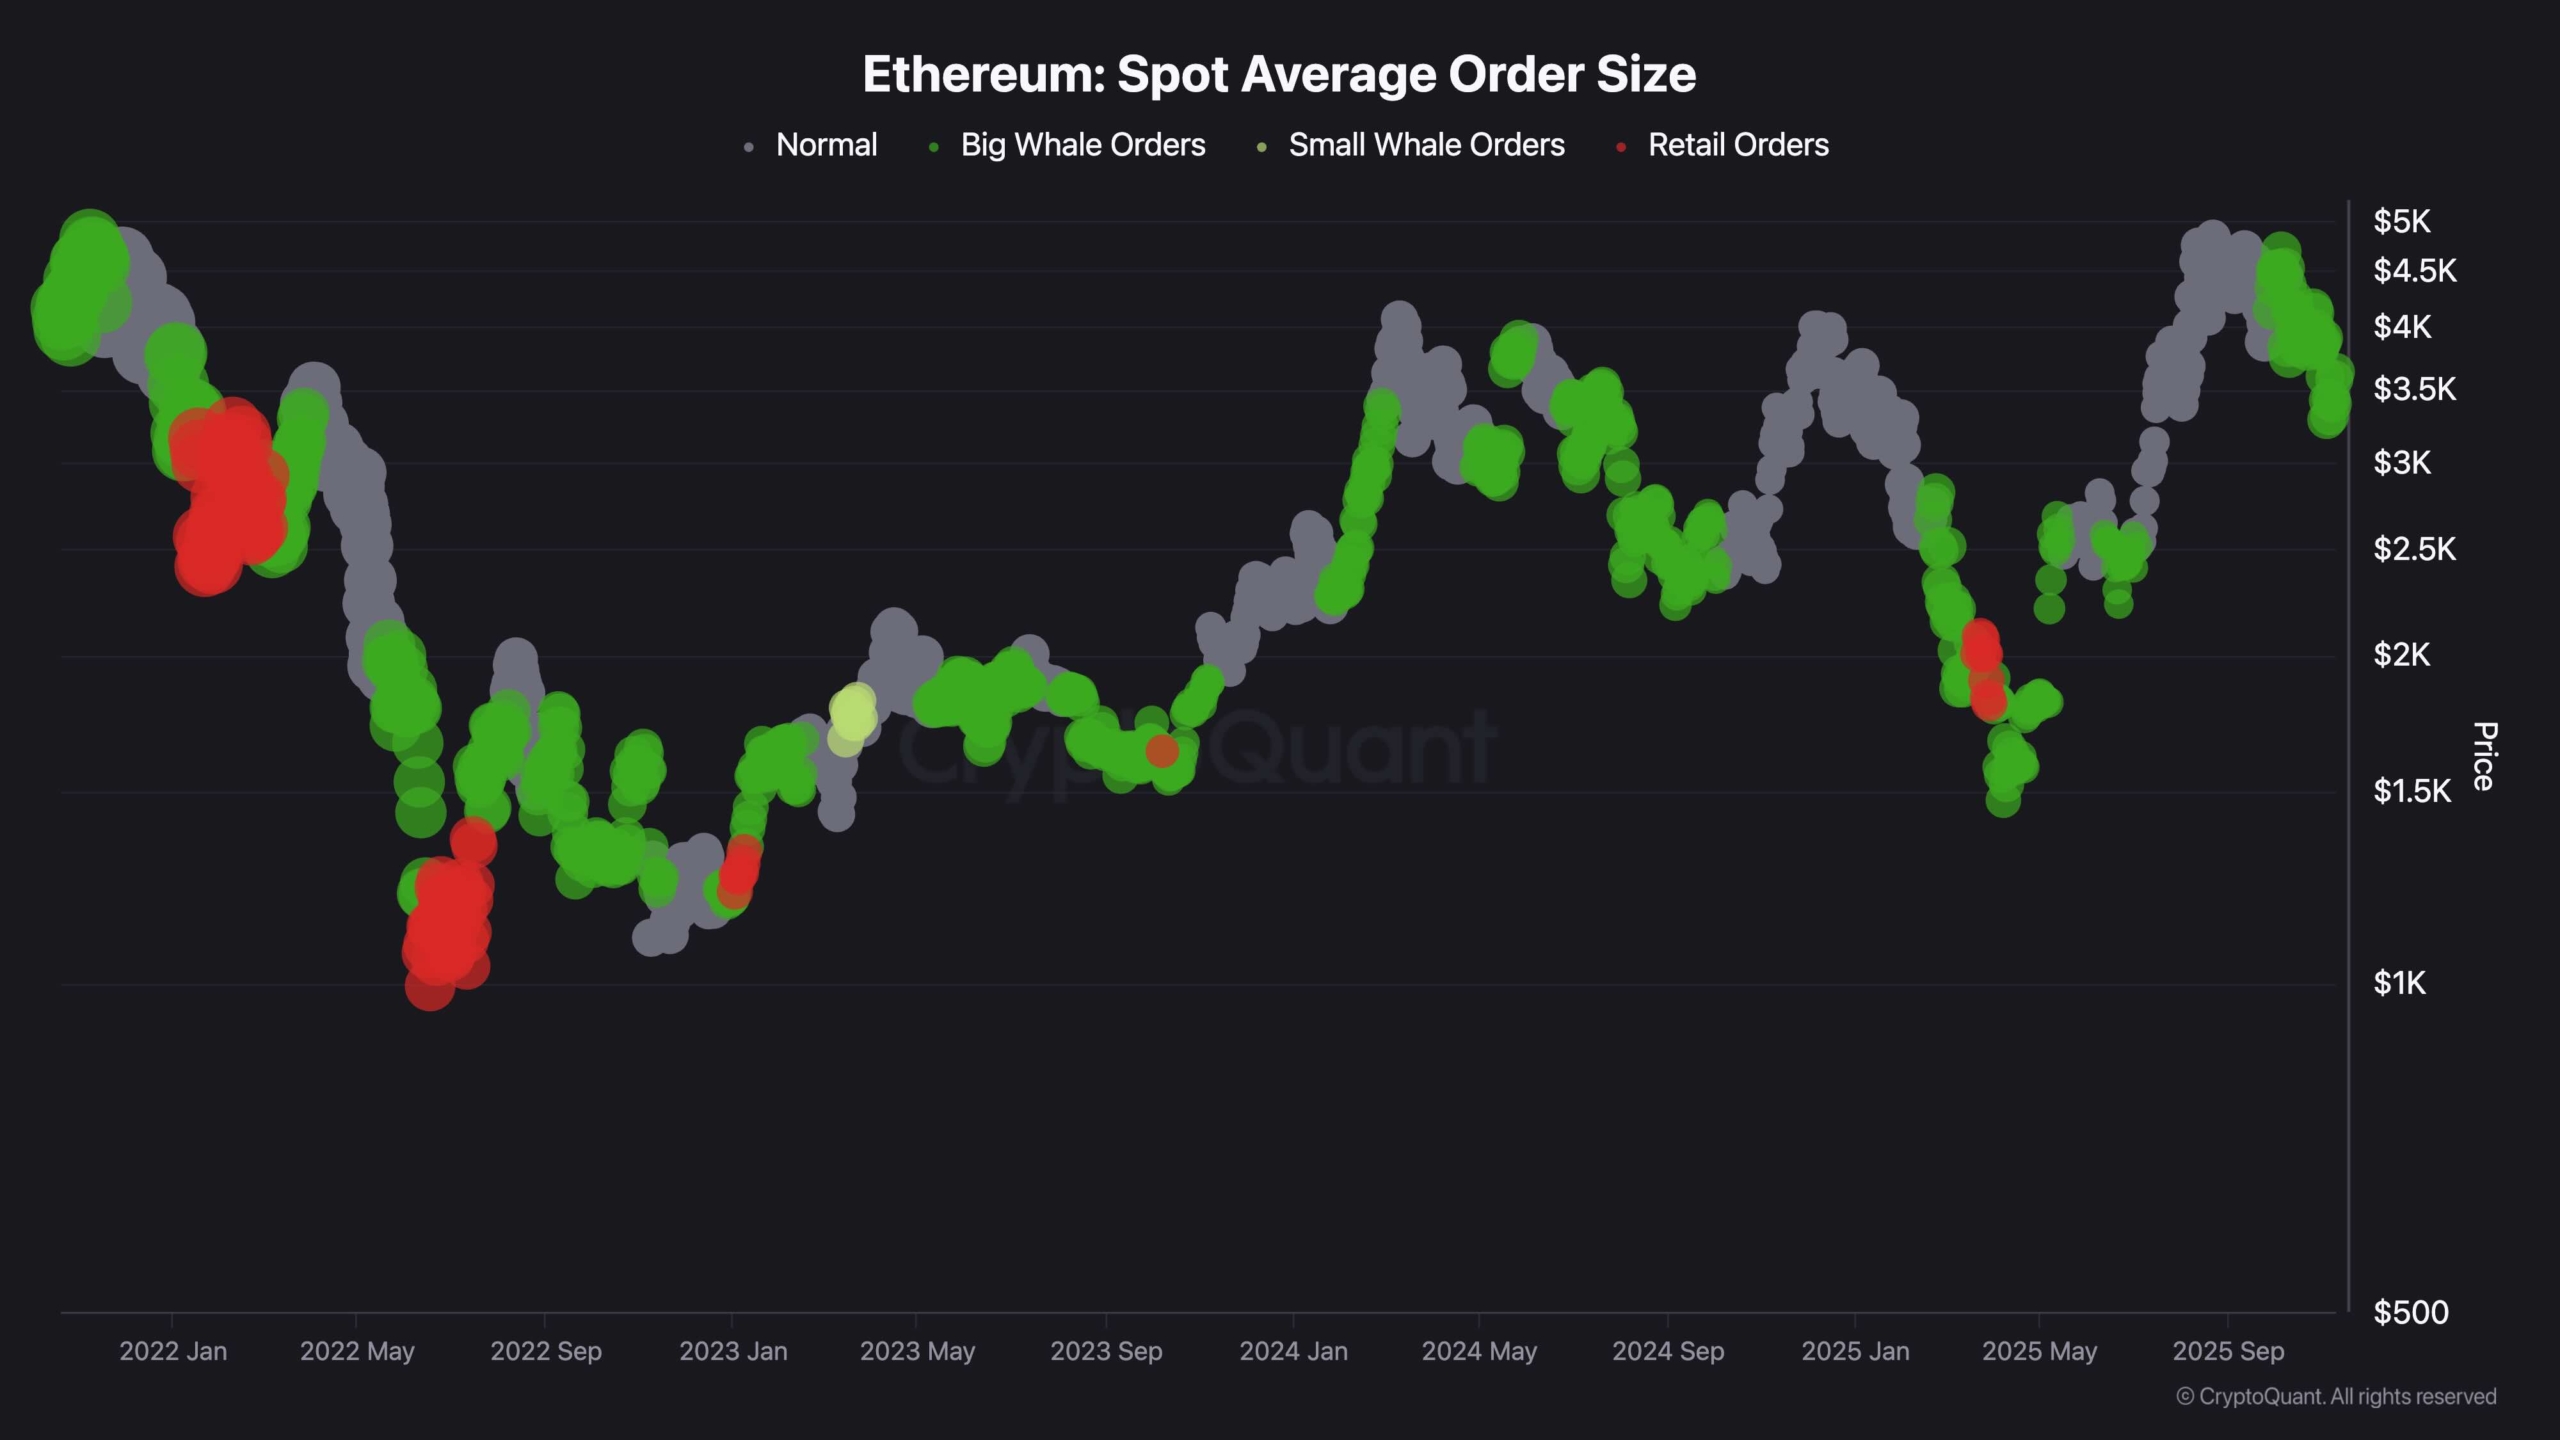
The Spot Average Order Size metric for Ethereum reflects a notable behavioural shift following the recent market shakeout. During the drop toward $3.2K, whale-driven activity (green clusters) briefly spiked, a pattern that has historically preceded local bottoms and early accumulation phases.
This change implies that larger market participants are re-entering exposure at discounted prices, while retail traders remain cautious. Across previous cycles, similar transitions, from whale accumulation to retail capitulation, have marked the start of trend reversals or late-stage compression phases before major upswings.
If this behaviour persists and the $3-$3.4K region holds as structural support, Ethereum may be entering a low-volatility accumulation zone, setting up for a potential final bullish impulse toward the upper range of $4.5K–$4.8K.
SECRET PARTNERSHIP BONUS for CryptoPotato readers: Use this link to register and unlock $1,500 in exclusive BingX Exchange rewards (limited time offer).
Disclaimer: Information found on CryptoPotato is those of writers quoted. It does not represent the opinions of CryptoPotato on whether to buy, sell, or hold any investments. You are advised to conduct your own research before making any investment decisions. Use provided information at your own risk. See Disclaimer for more information.
Cryptocurrency charts by TradingView.
Search
RECENT PRESS RELEASES
Related Post


