Ethereum Price Eyes $3.6K as Price Tests Critical Zone
May 24, 2025
- Ethereum price is consolidating just below its 200-day moving average.
- A breakout could send ETH toward the $3,500–$3,600 target zone.
- BlackRock’s recent $24.9M ETH buy adds confidence to the trend.
Ethereum price hovered near its 200-day Simple Moving Average (SMA), a key technical level. Analysts viewed a breakout above this point as a potential catalyst for a move toward $3,500–$3,600. The trend followed a falling wedge breakout and rising derivatives data.
Ethereum traded just below its 200-day SMA, which is located near $2,700. Historically, this level has acted as both support and resistance during major market reversals.
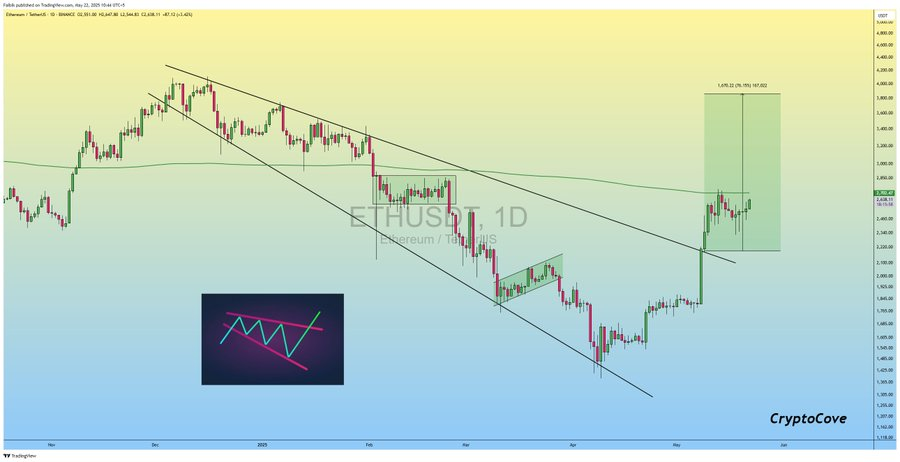
Analysts say that as long as Ethereum surpasses the 200-day SMA with high volume, it might push the price up to $3,500–$3,600. This is also in line with the measured move projection from the falling wedge breakout, which indicates there may be further improvement to come. The appearance of a small bull flag backs up the trend, as long as the breakout remains in place.
Recently, the Ethereum price broke above a falling wedge, meaning the move is often viewed as a bullish reversal pattern. A long trading period within a descending channel was followed by ETH breaking out and surging above the channel’s upper trendline. This breakout led to a price surge from $1,600 to over $2,660, with the price now consolidating just below the key $2,700 resistance level.
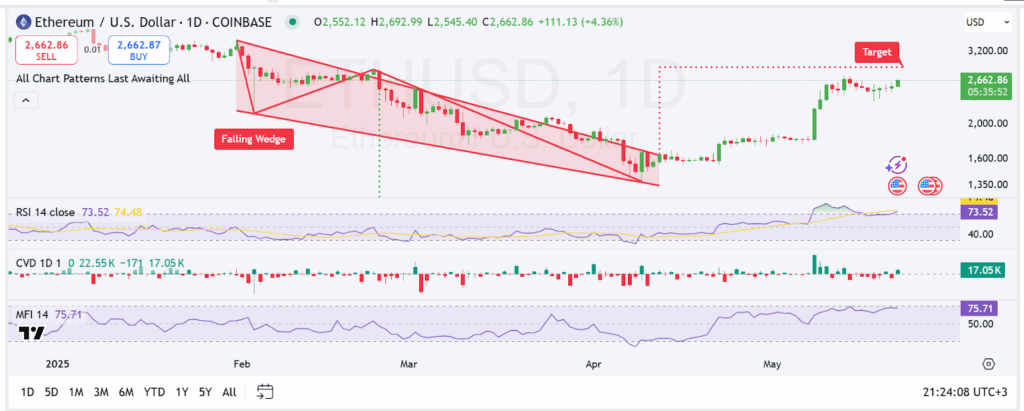
The Relative Strength Index (RSI) is showing that the market is currently in overbought zones. MFI is displaying a value of 75.71 which means strong demand and many investors pouring money into Ethereum.
At the same time, heightened Cumulative Volume Delta (CVD) means that traders are buying more than selling which shows buyers are taking over from sellers.
Ethereum’s wider chart pattern shows that the price might continue to rise long term, CryptoPatel suggests. A long-term chart reveals ETH crossing through several levels of resistance and moving closer to prices it achieved last year, between $4,000 and $4,800. The chart shows this point as an important turning point.
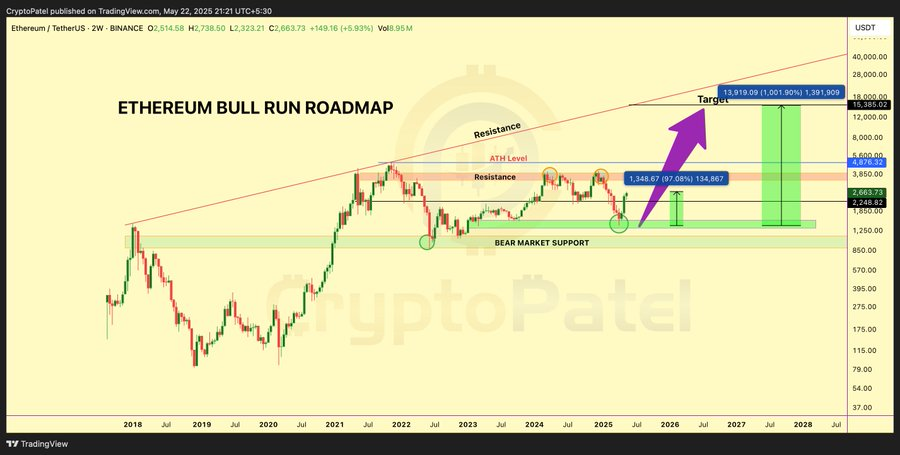
If Ethereum breaks above its current all-time high, higher price targets could be attained. Based on current momentum, market analysis suggests that Ethereum price could reach $10,000 between 2026 and 2027, provided the trend continues.
Forecasts show that by June 20, 2025, Ethereum might see a slight price surge of 0.59% to about $2,653.75. At this time, technical indicators point to investors being bullish, and the Fear & Greed Index reads 72, which means the market is in the Greed zone. For the last month, Ethereum experienced 16 price increases, giving it a volatility of 16.64% across the period.
Open interest across ETH derivatives rose by 10.64% to $14.6 billion. Nearly $14.2 billion of that came from perpetual contracts, up 10.81% year-over-year.
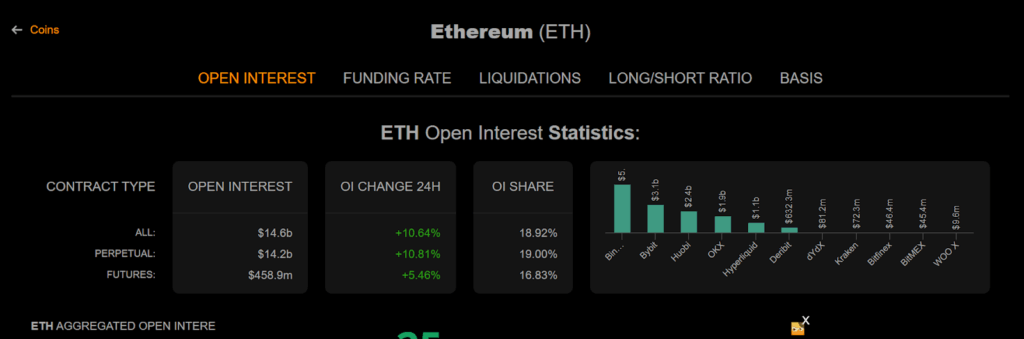
The increase showed traders taking new positions in anticipation of higher prices. Strong futures positioning generally reflected bullish conviction.
Institutional interest grew alongside. BlackRock disclosed a $24.9 million ETH purchase, adding to its portfolio and reaffirming long-term confidence.
Adding to the ETH narrative, reports showed that 93% of former U.S. President Donald Trump’s crypto portfolio was held in Ethereum.
This article is for informational purposes only and provides no financial, investment, or other advice. The author or any people mentioned in this article are not responsible for any financial loss that may occur from investing in or trading. Please do your research before making any financial decisions.

Olivia Stephanie is a FinTech enthusiast with a keen understanding of financial markets. Her passion for economics and finance has led her to explore emerging blockchain technology and cryptocurrency markets.
Search
RECENT PRESS RELEASES
Related Post


