Ethereum Price Faces Key Test — Direction Clears Above $3,140
January 8, 2026
Ethereum price has pulled back after a steady recovery that began in mid-December. Despite falling over 4% in the past 24 hours, ETH is still up roughly 5% on the week and has mostly traded flat over the past month. That sideways behavior reflects a market stuck between buyers and sellers.
The latest rejection near resistance highlights this imbalance. Buyers keep stepping in, but they are not pushing hard enough to force a breakout. As a result, Ethereum now sits at a critical decision point where one level could decide whether the pullback stays shallow or deepens further.
SponsoredSponsored
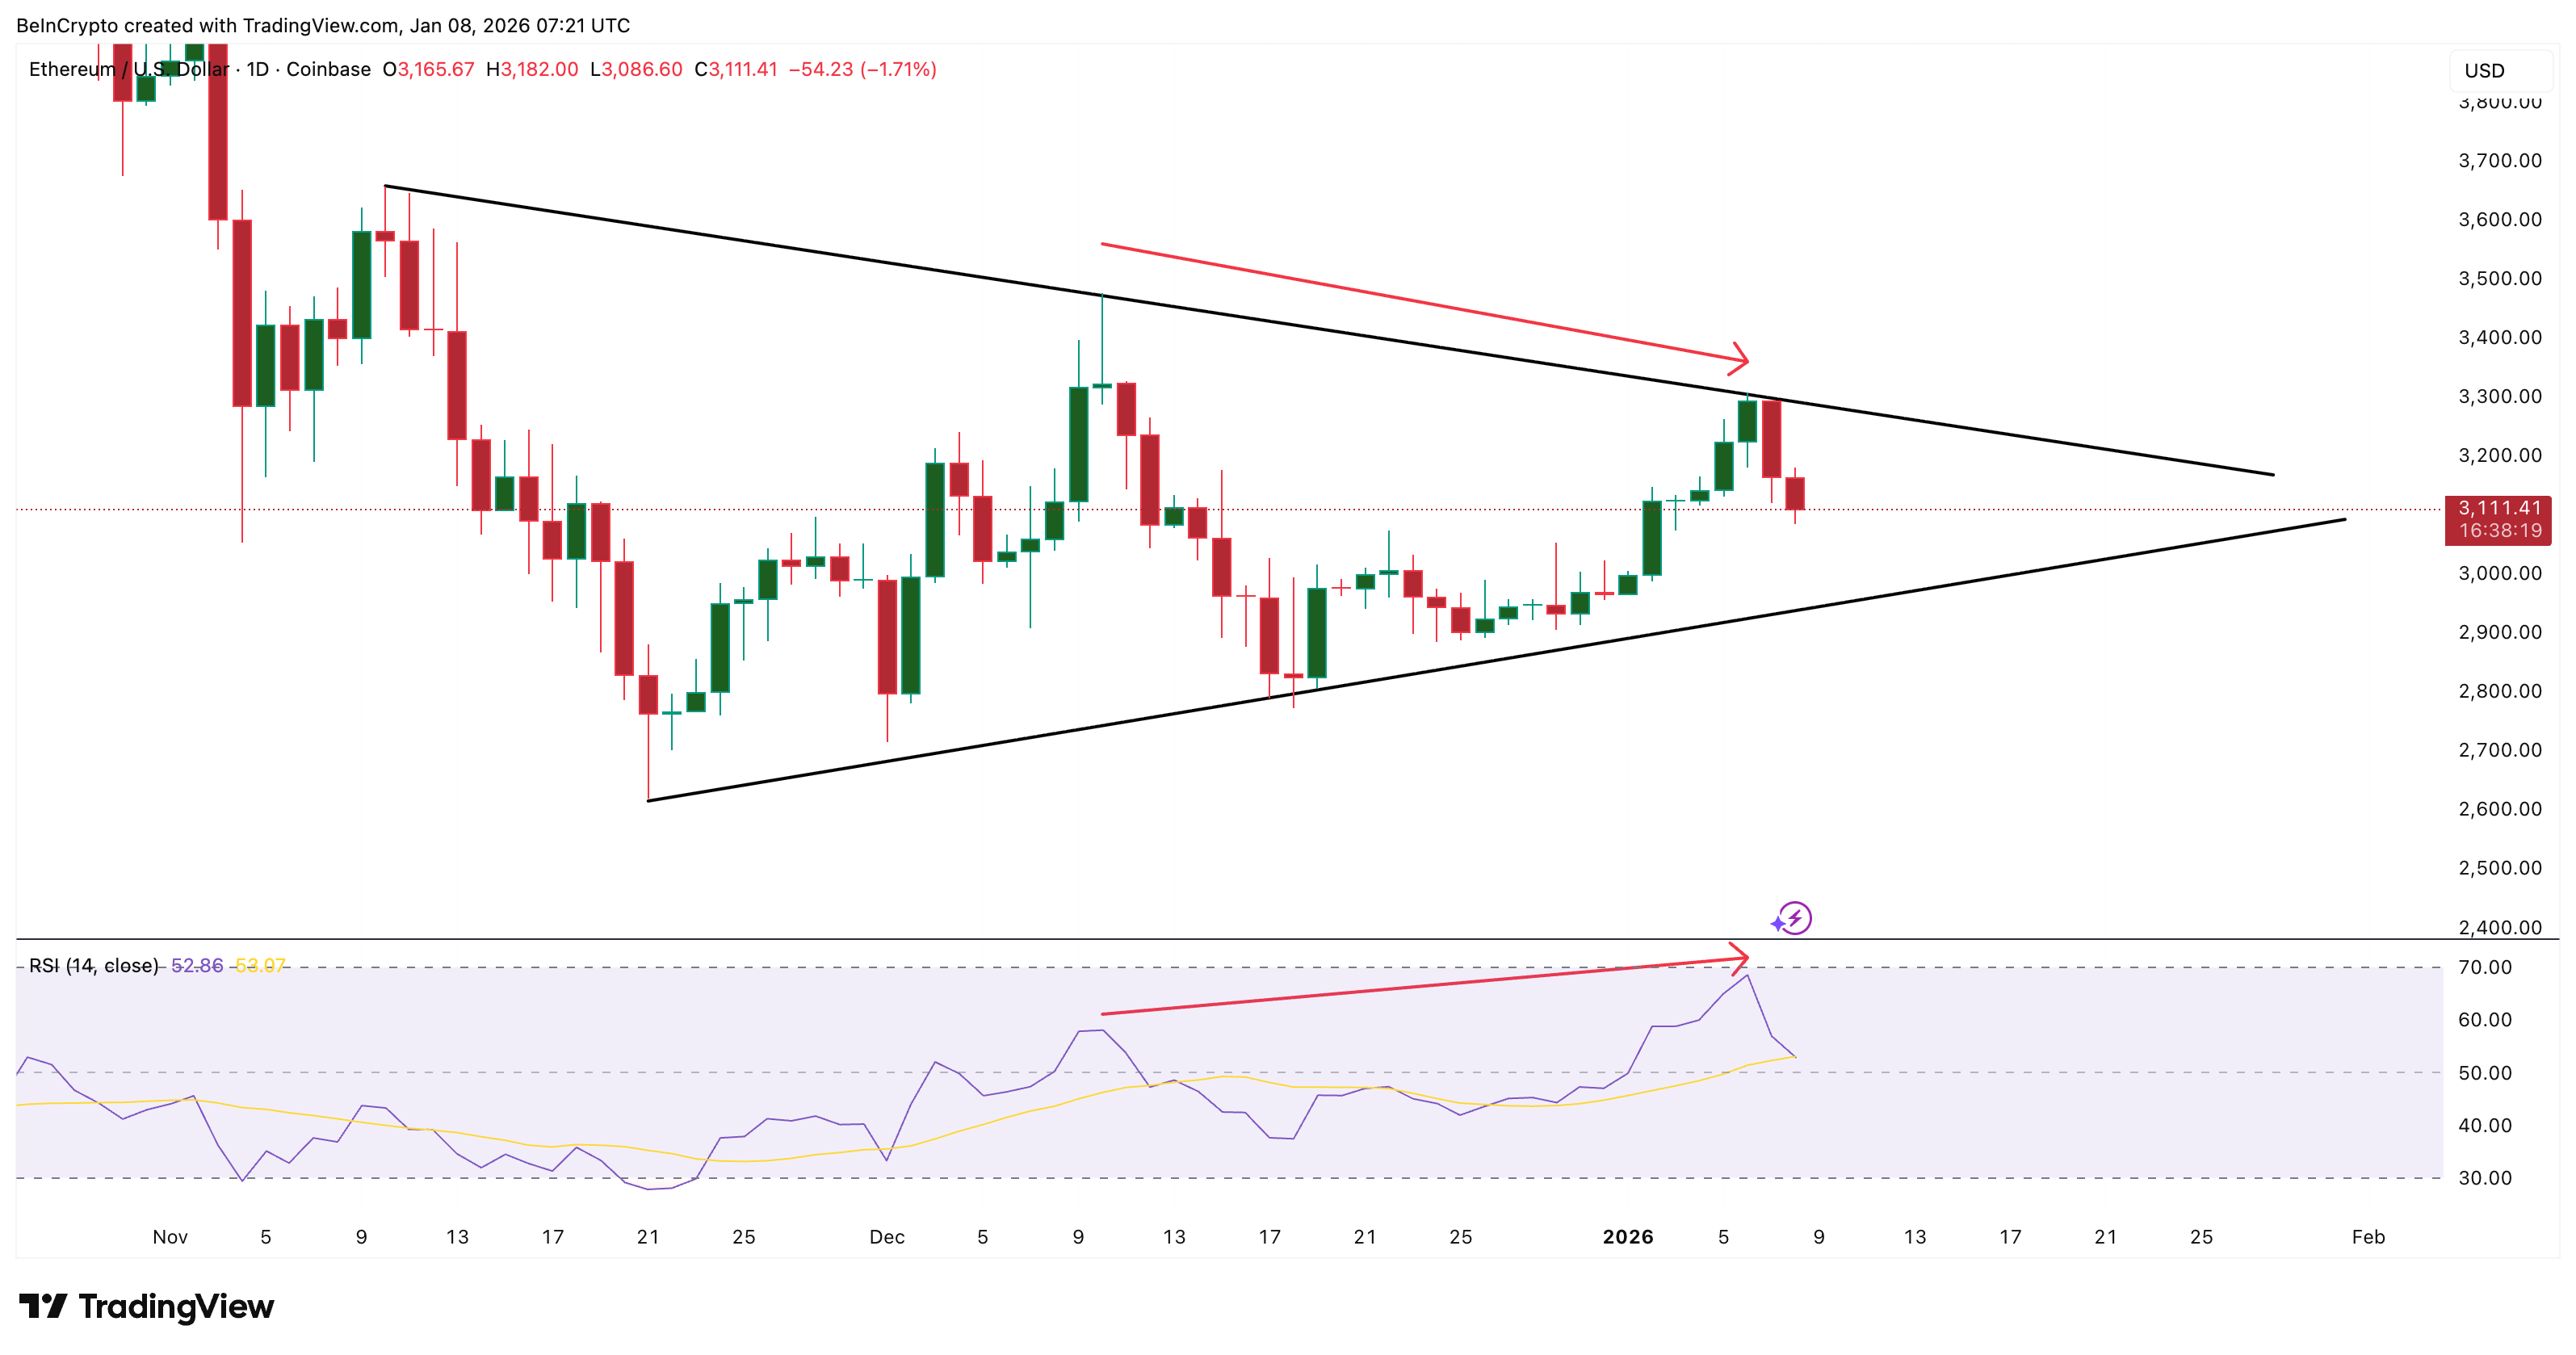
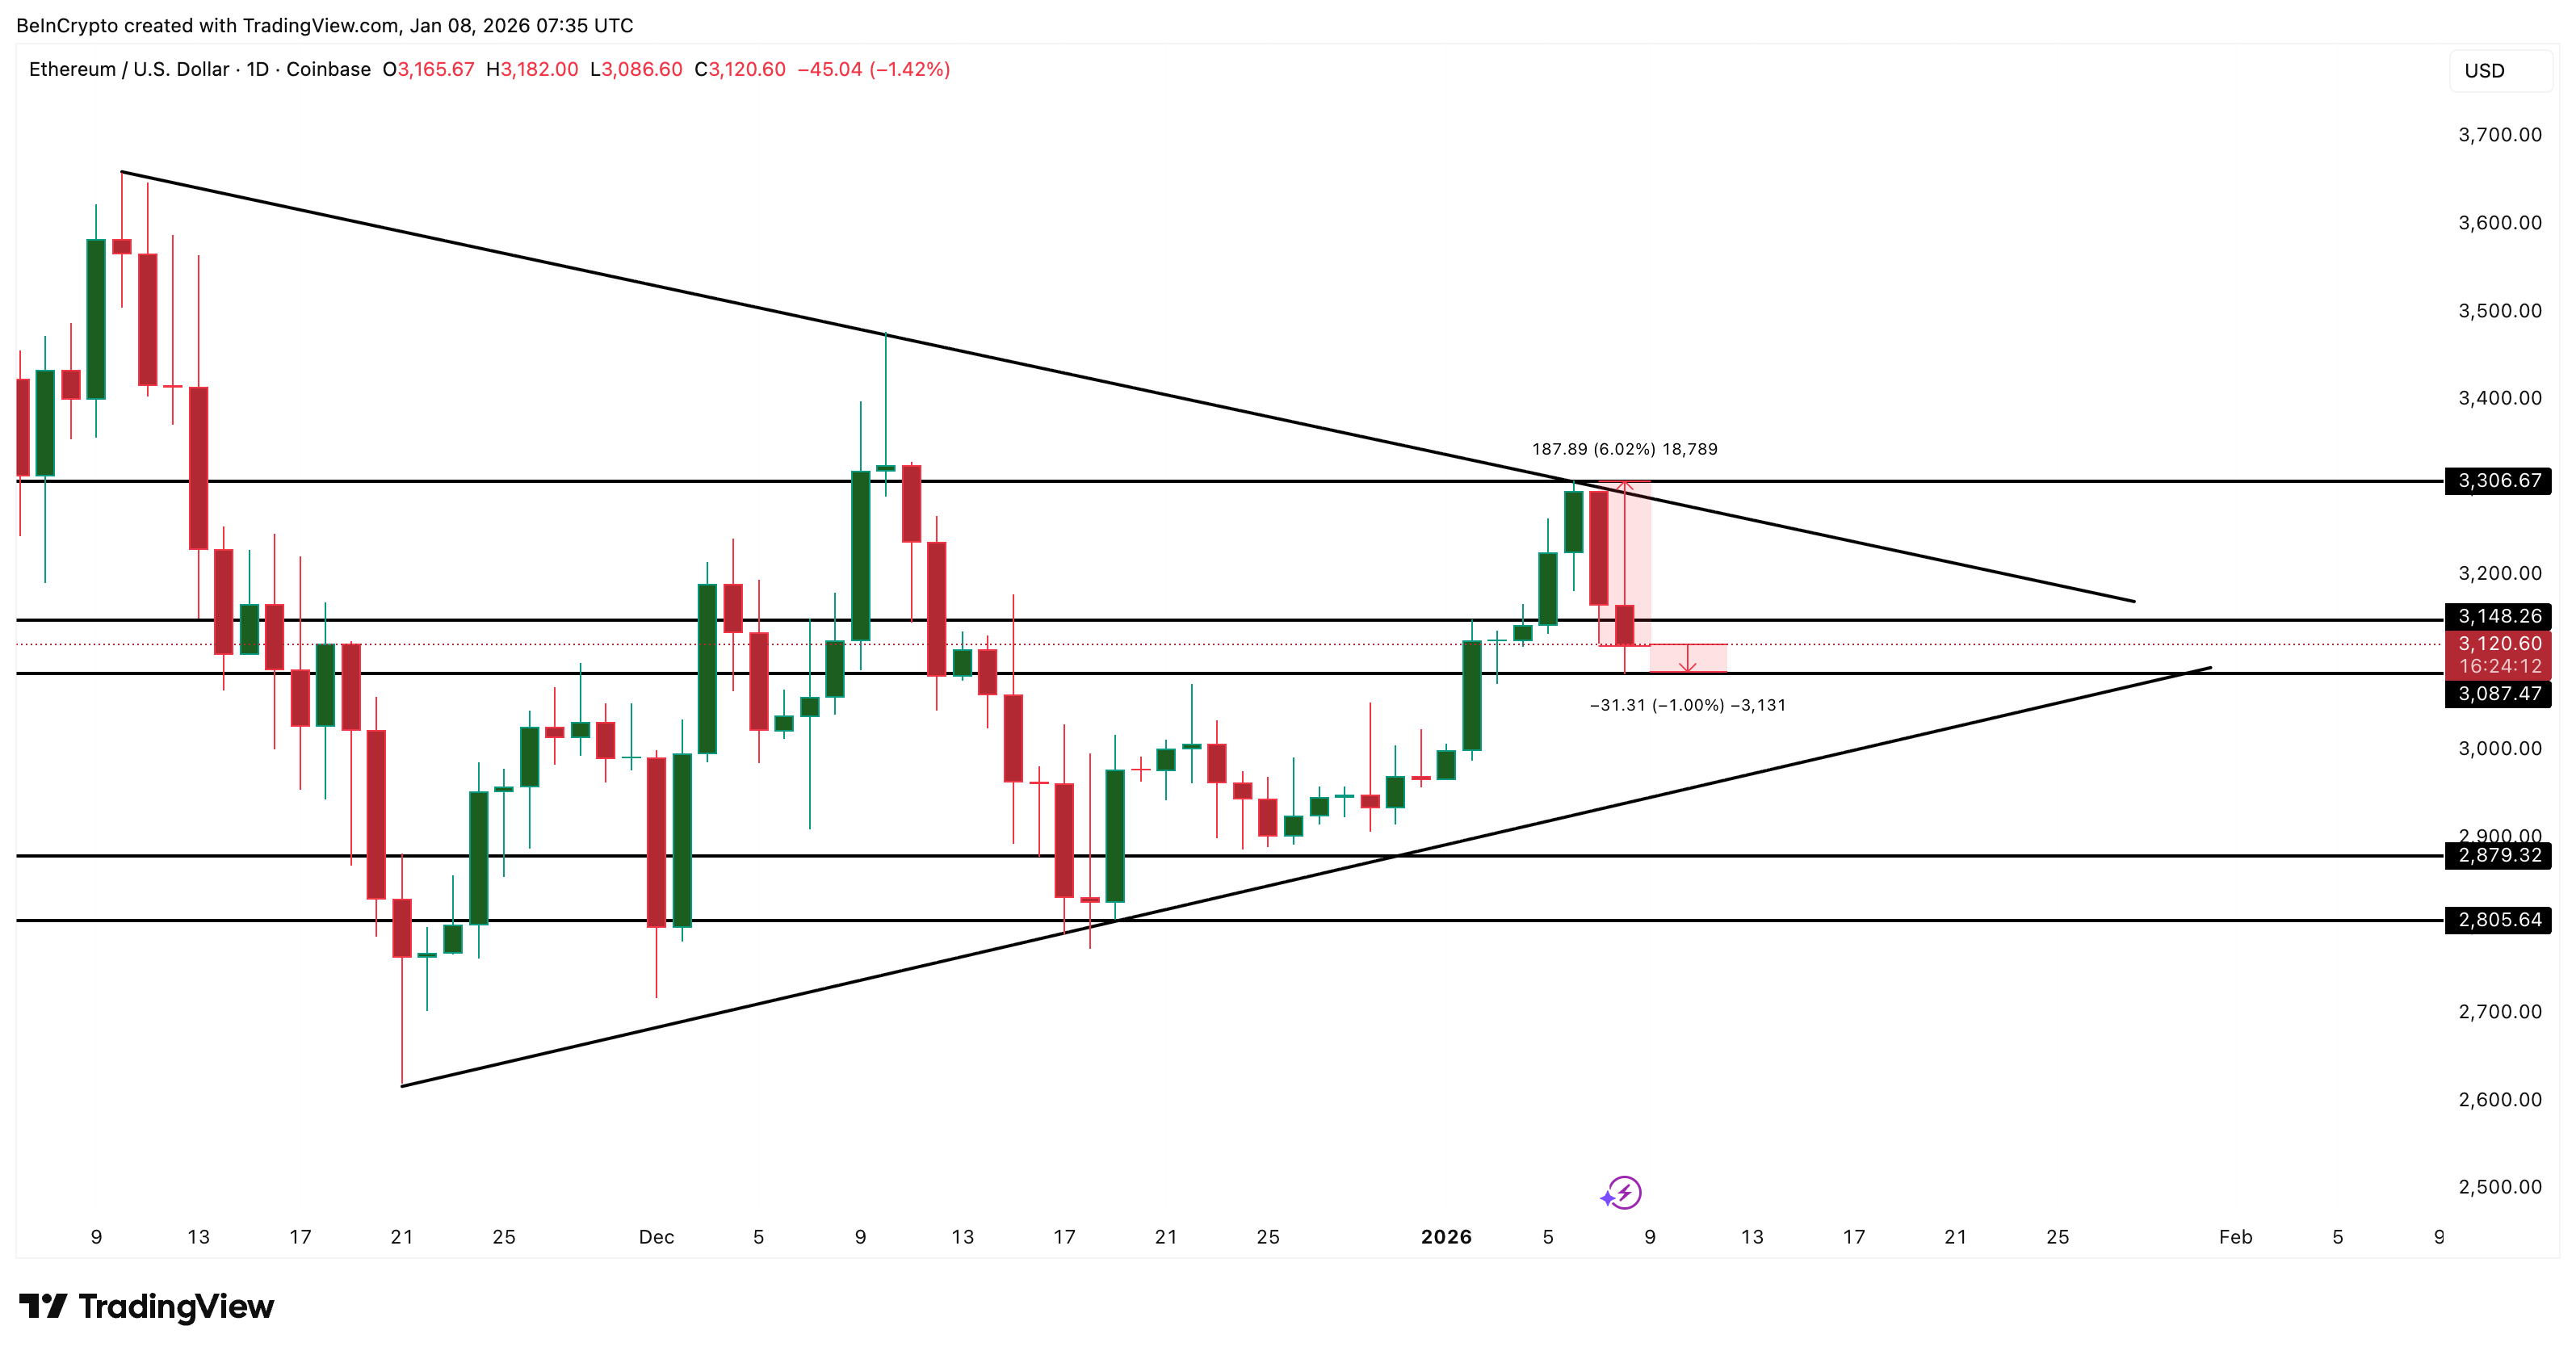
Ethereum has been trading inside a symmetrical triangle since early November. This pattern forms when price makes lower highs and higher lows at the same time, showing that both buyers and sellers are active, but neither side has control. It explains why ETH has struggled to trend despite multiple attempts in both directions.
That tension showed up clearly this week. After rebounding from the lower trendline on December 18, Ethereum climbed steadily until it tested the upper trendline again on January 7. As with the upper trendline rejection on December 10, sellers stepped in and the price rolled over.
Momentum confirmed the hesitation. Between December 10 and January 6, the Ethereum price formed a lower high while the Relative Strength Index, or RSI, formed a higher high. RSI measures momentum strength. When momentum rises, but price does not, it signals that buying pressure is weakening. This hidden bearish divergence often appears when buyers try but fail to break resistance.
Want more token insights like this? Sign up for Editor Harsh Notariya’s Daily Crypto Newsletter here.
In simple terms, buyers showed interest, but they did not follow through. That lack of commitment allowed sellers to defend the trendline again.
SponsoredSponsored
On-chain data helps explain why momentum faded. The group driving the recent volatility has been very short-term holders, as shown using the HODL waves data — a metric highlighting cohorts based on holding time.
Wallets holding ETH for one day to one week reduced their share of supply from about 2.05% in late December to roughly 1.34% as the price tested resistance on January 6. That selling lined up closely with the rejection near the upper trendline.
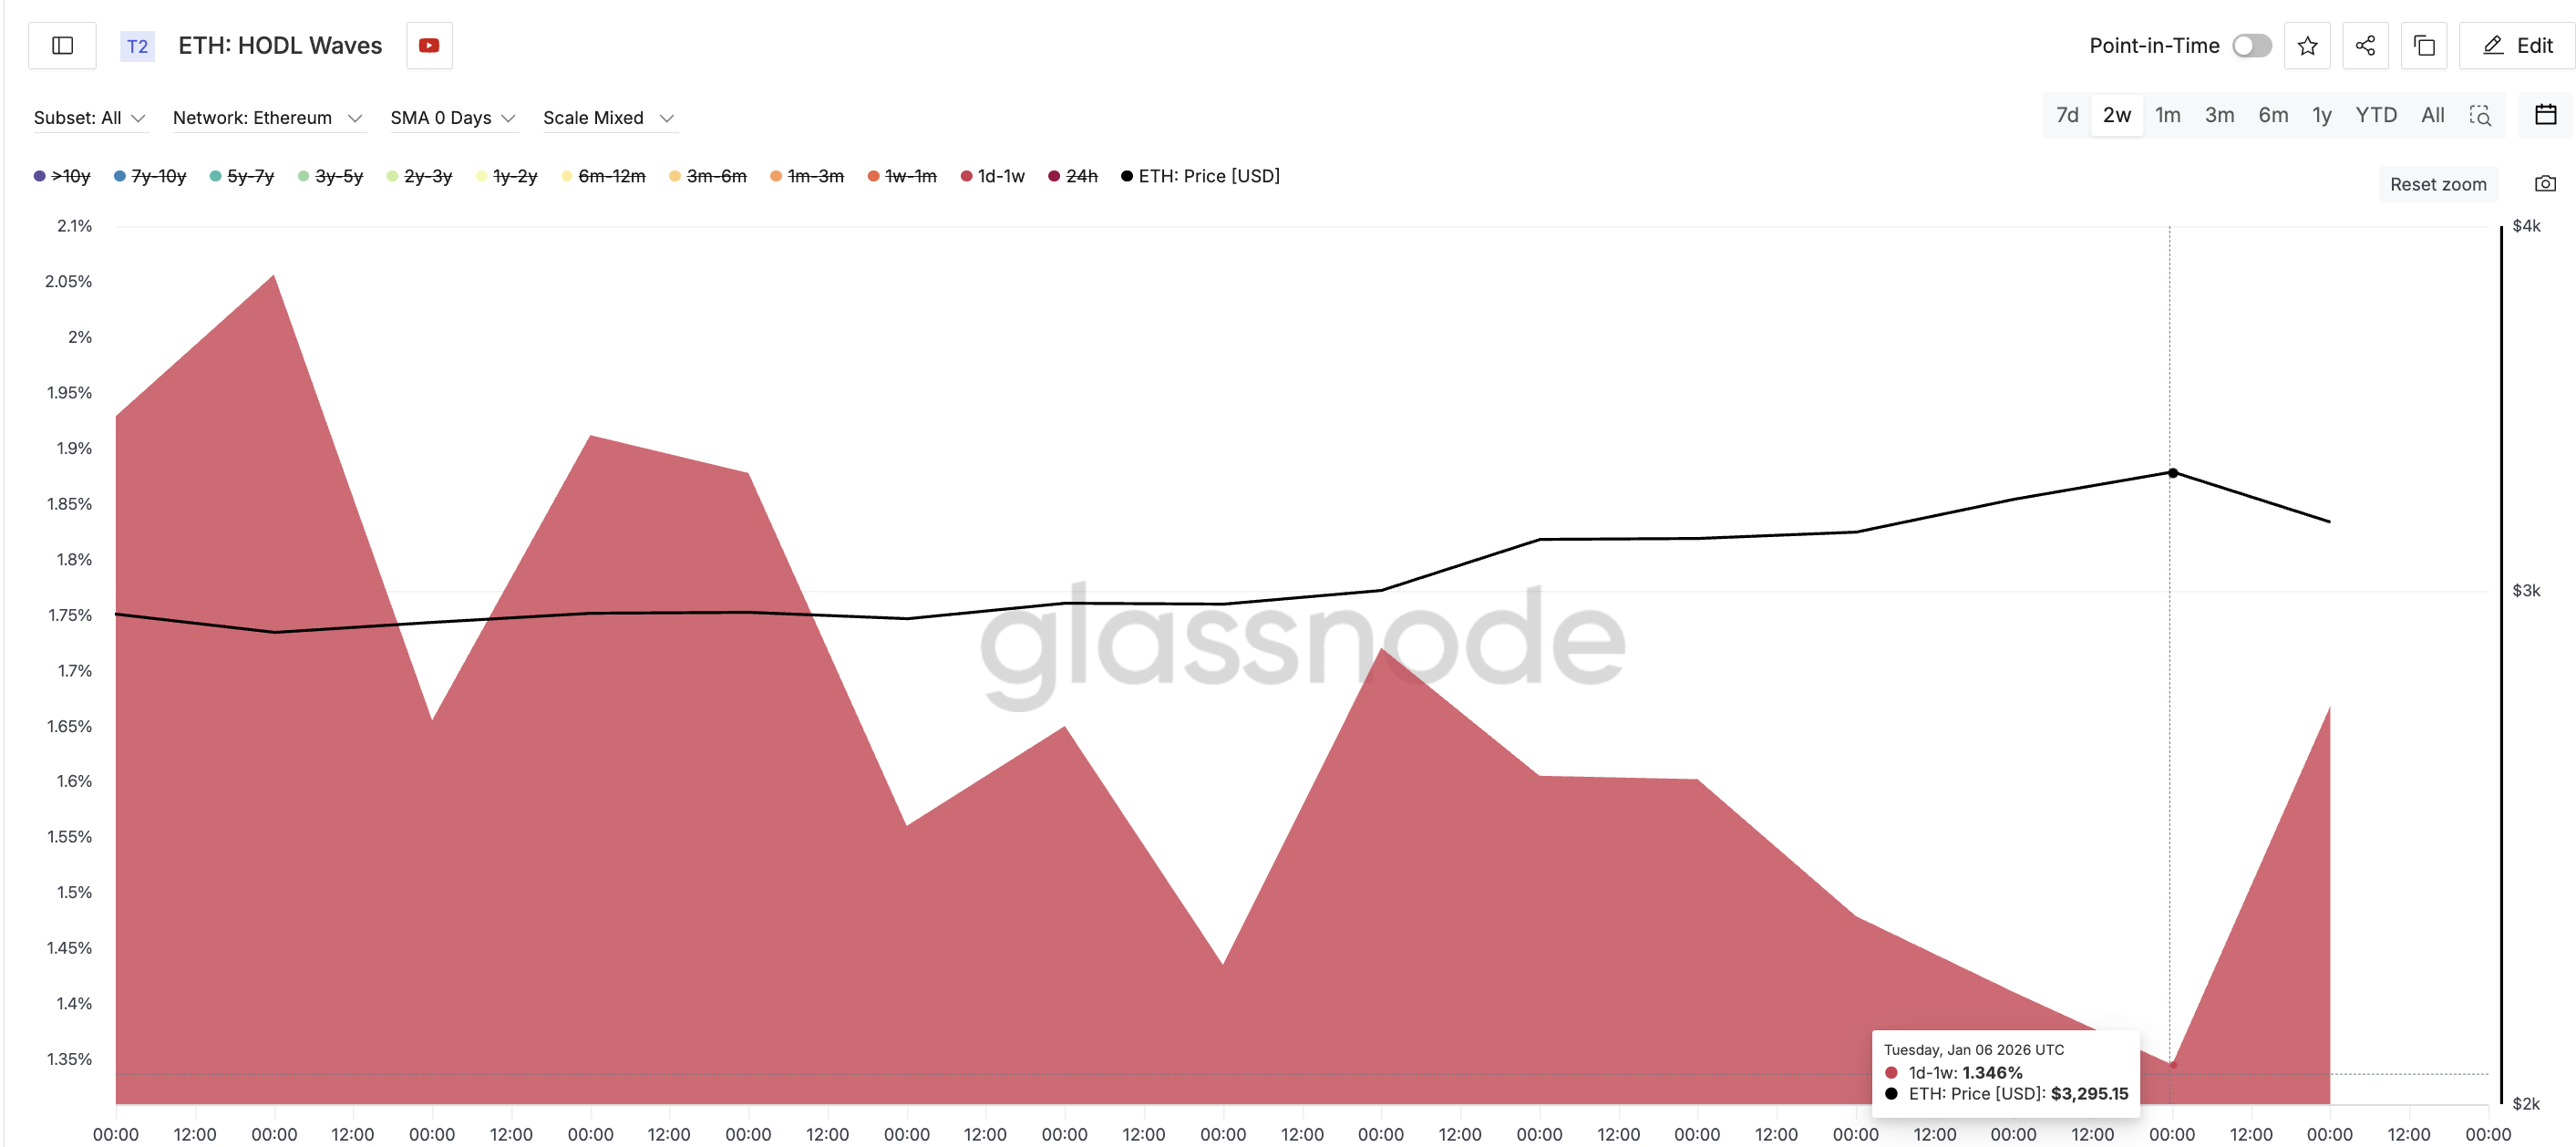
After the pullback began, the same group started rebuilding positions, lifting their share back toward 1.67%. This pattern of buying dips and booking profits near peaks creates churn, not direction. It adds pressure during rallies and weakens follow-through.
This behavior is significant because Ethereum is trading relative to its cost basis. A large supply cluster sits between roughly $3,146 and $3,164, representing more than 3.1 million ETH. This zone acts as a key decision area. If the price holds above it (which isn’t the case at press time), buyers have a strong base to work with.
If it breaks, the demand below becomes thinner.
SponsoredSponsored
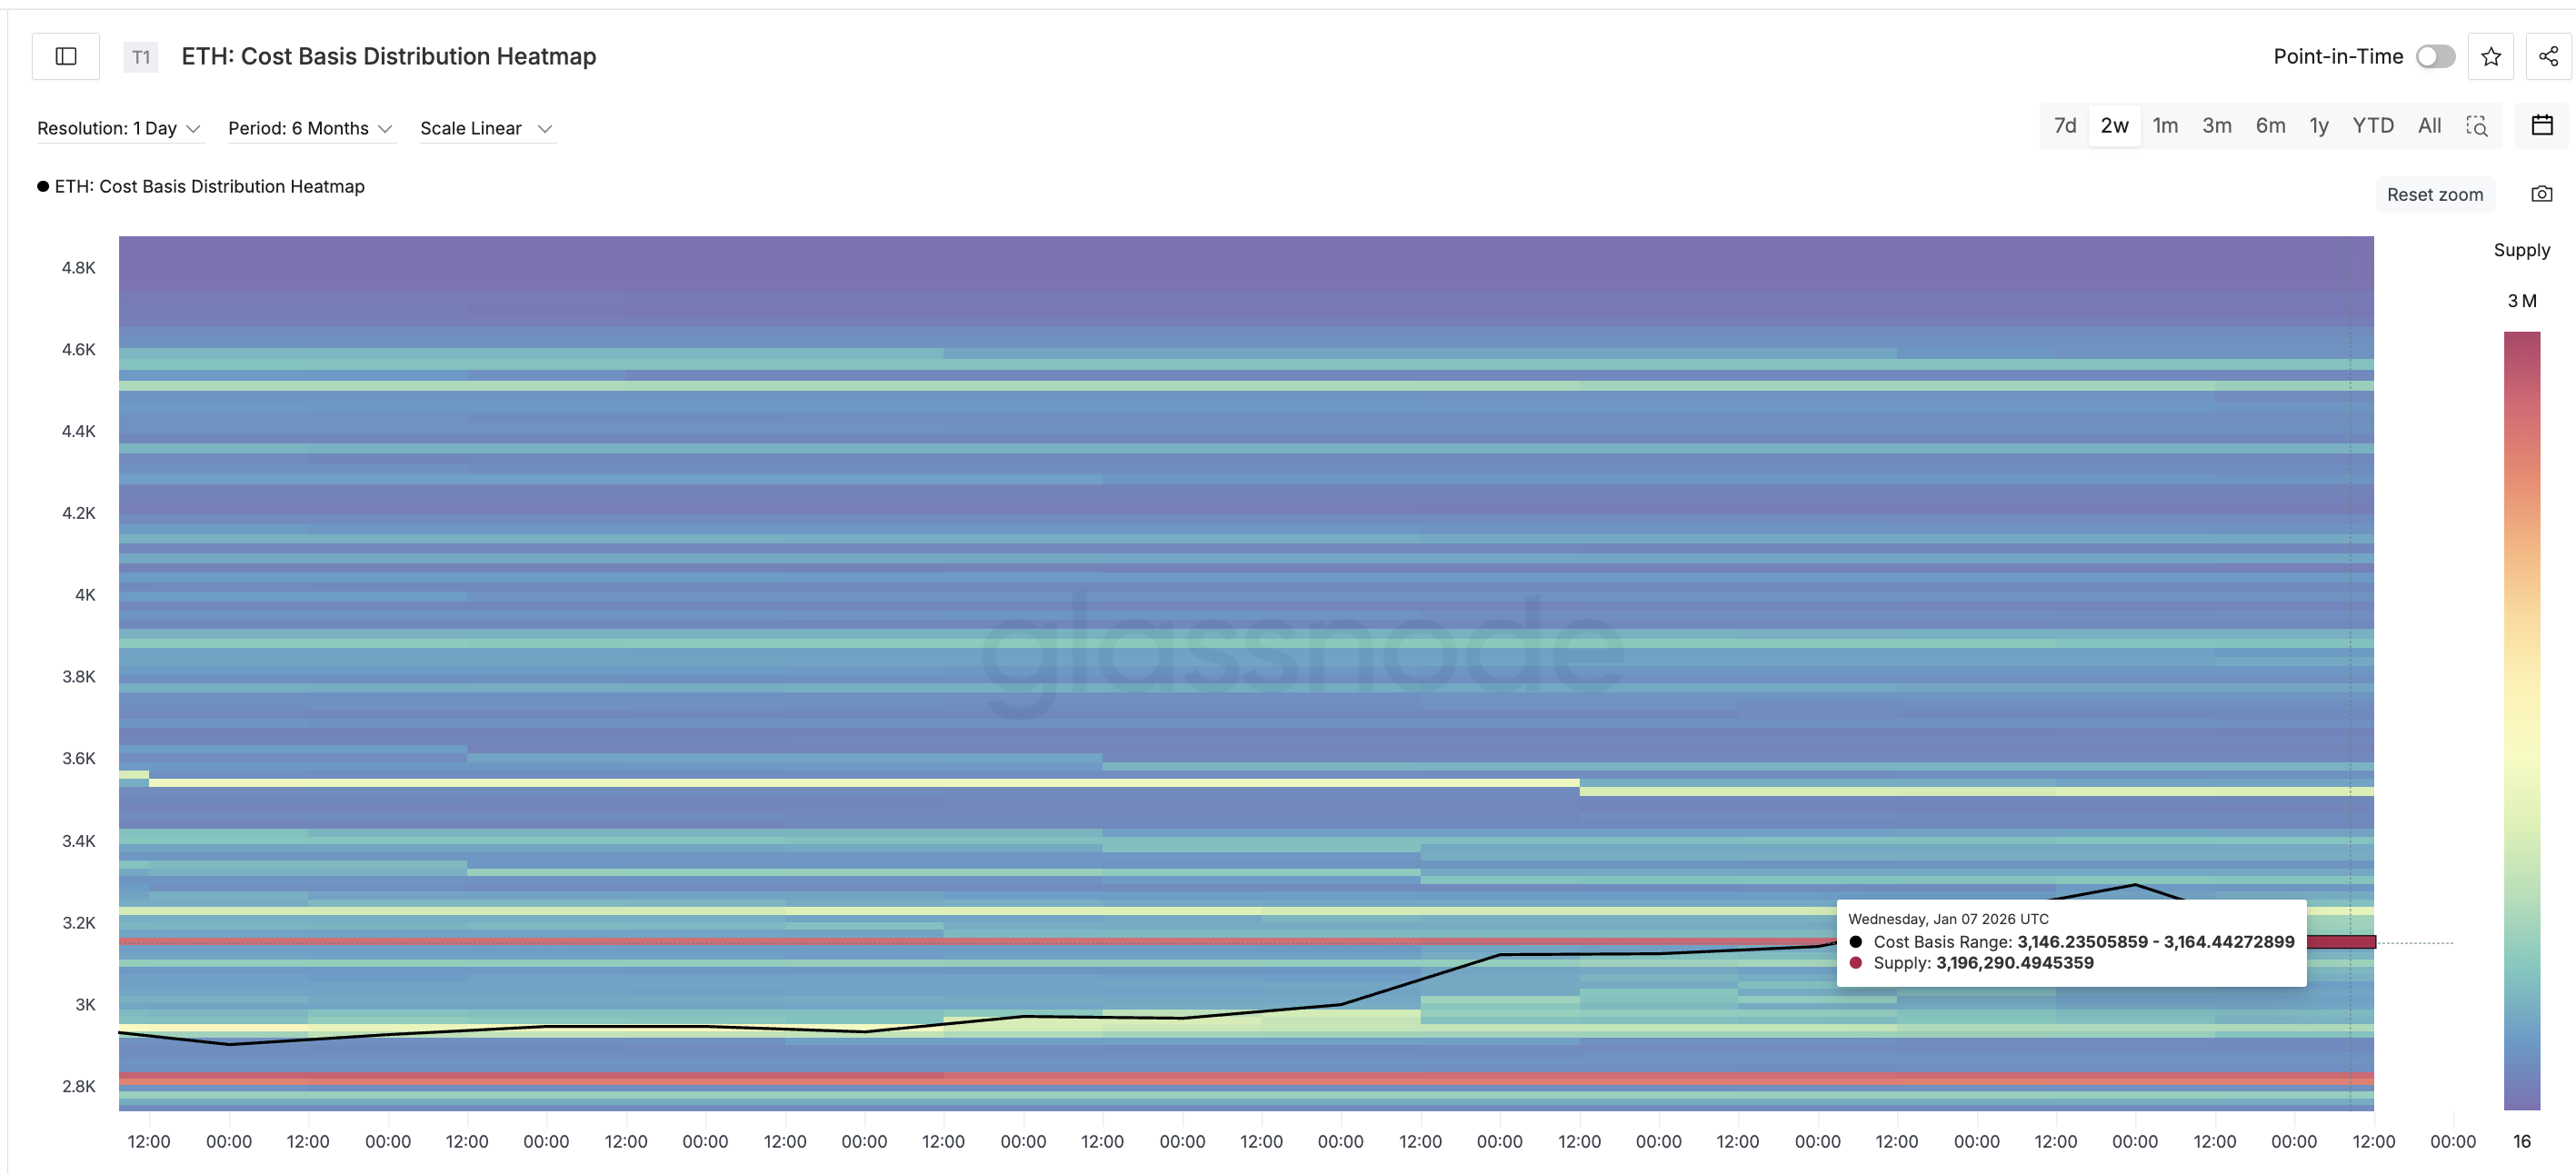
Under that zone, the next major cluster does not appear until the $2,819 to $2,835 range, where around 3.0 million ETH last changed hands.
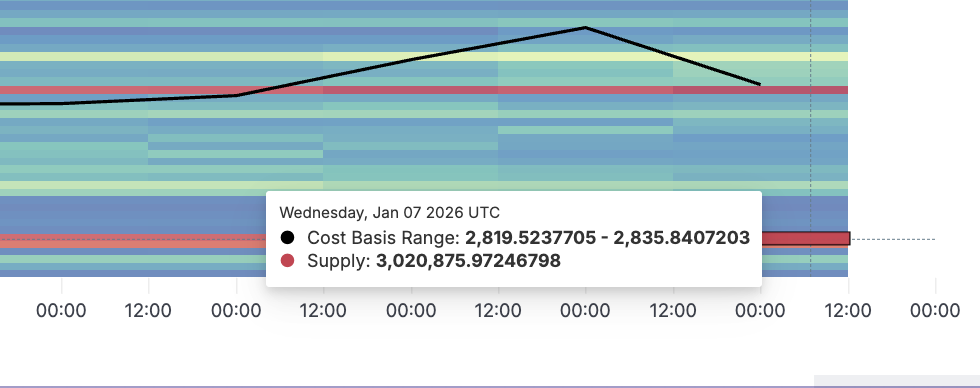
That gap explains why short-term selling near resistance is risky. If support gives way, price can slide quickly before finding a stronger footing.
SponsoredSponsored
While short-term holders added volatility, longer-term participants have quietly supported the market. Since the dip began, larger holders (Whales) have started absorbing supply, helping prevent a sharper breakdown. Since January 7, large Ethereum holders have added roughly 200,000 ETH to their balances.
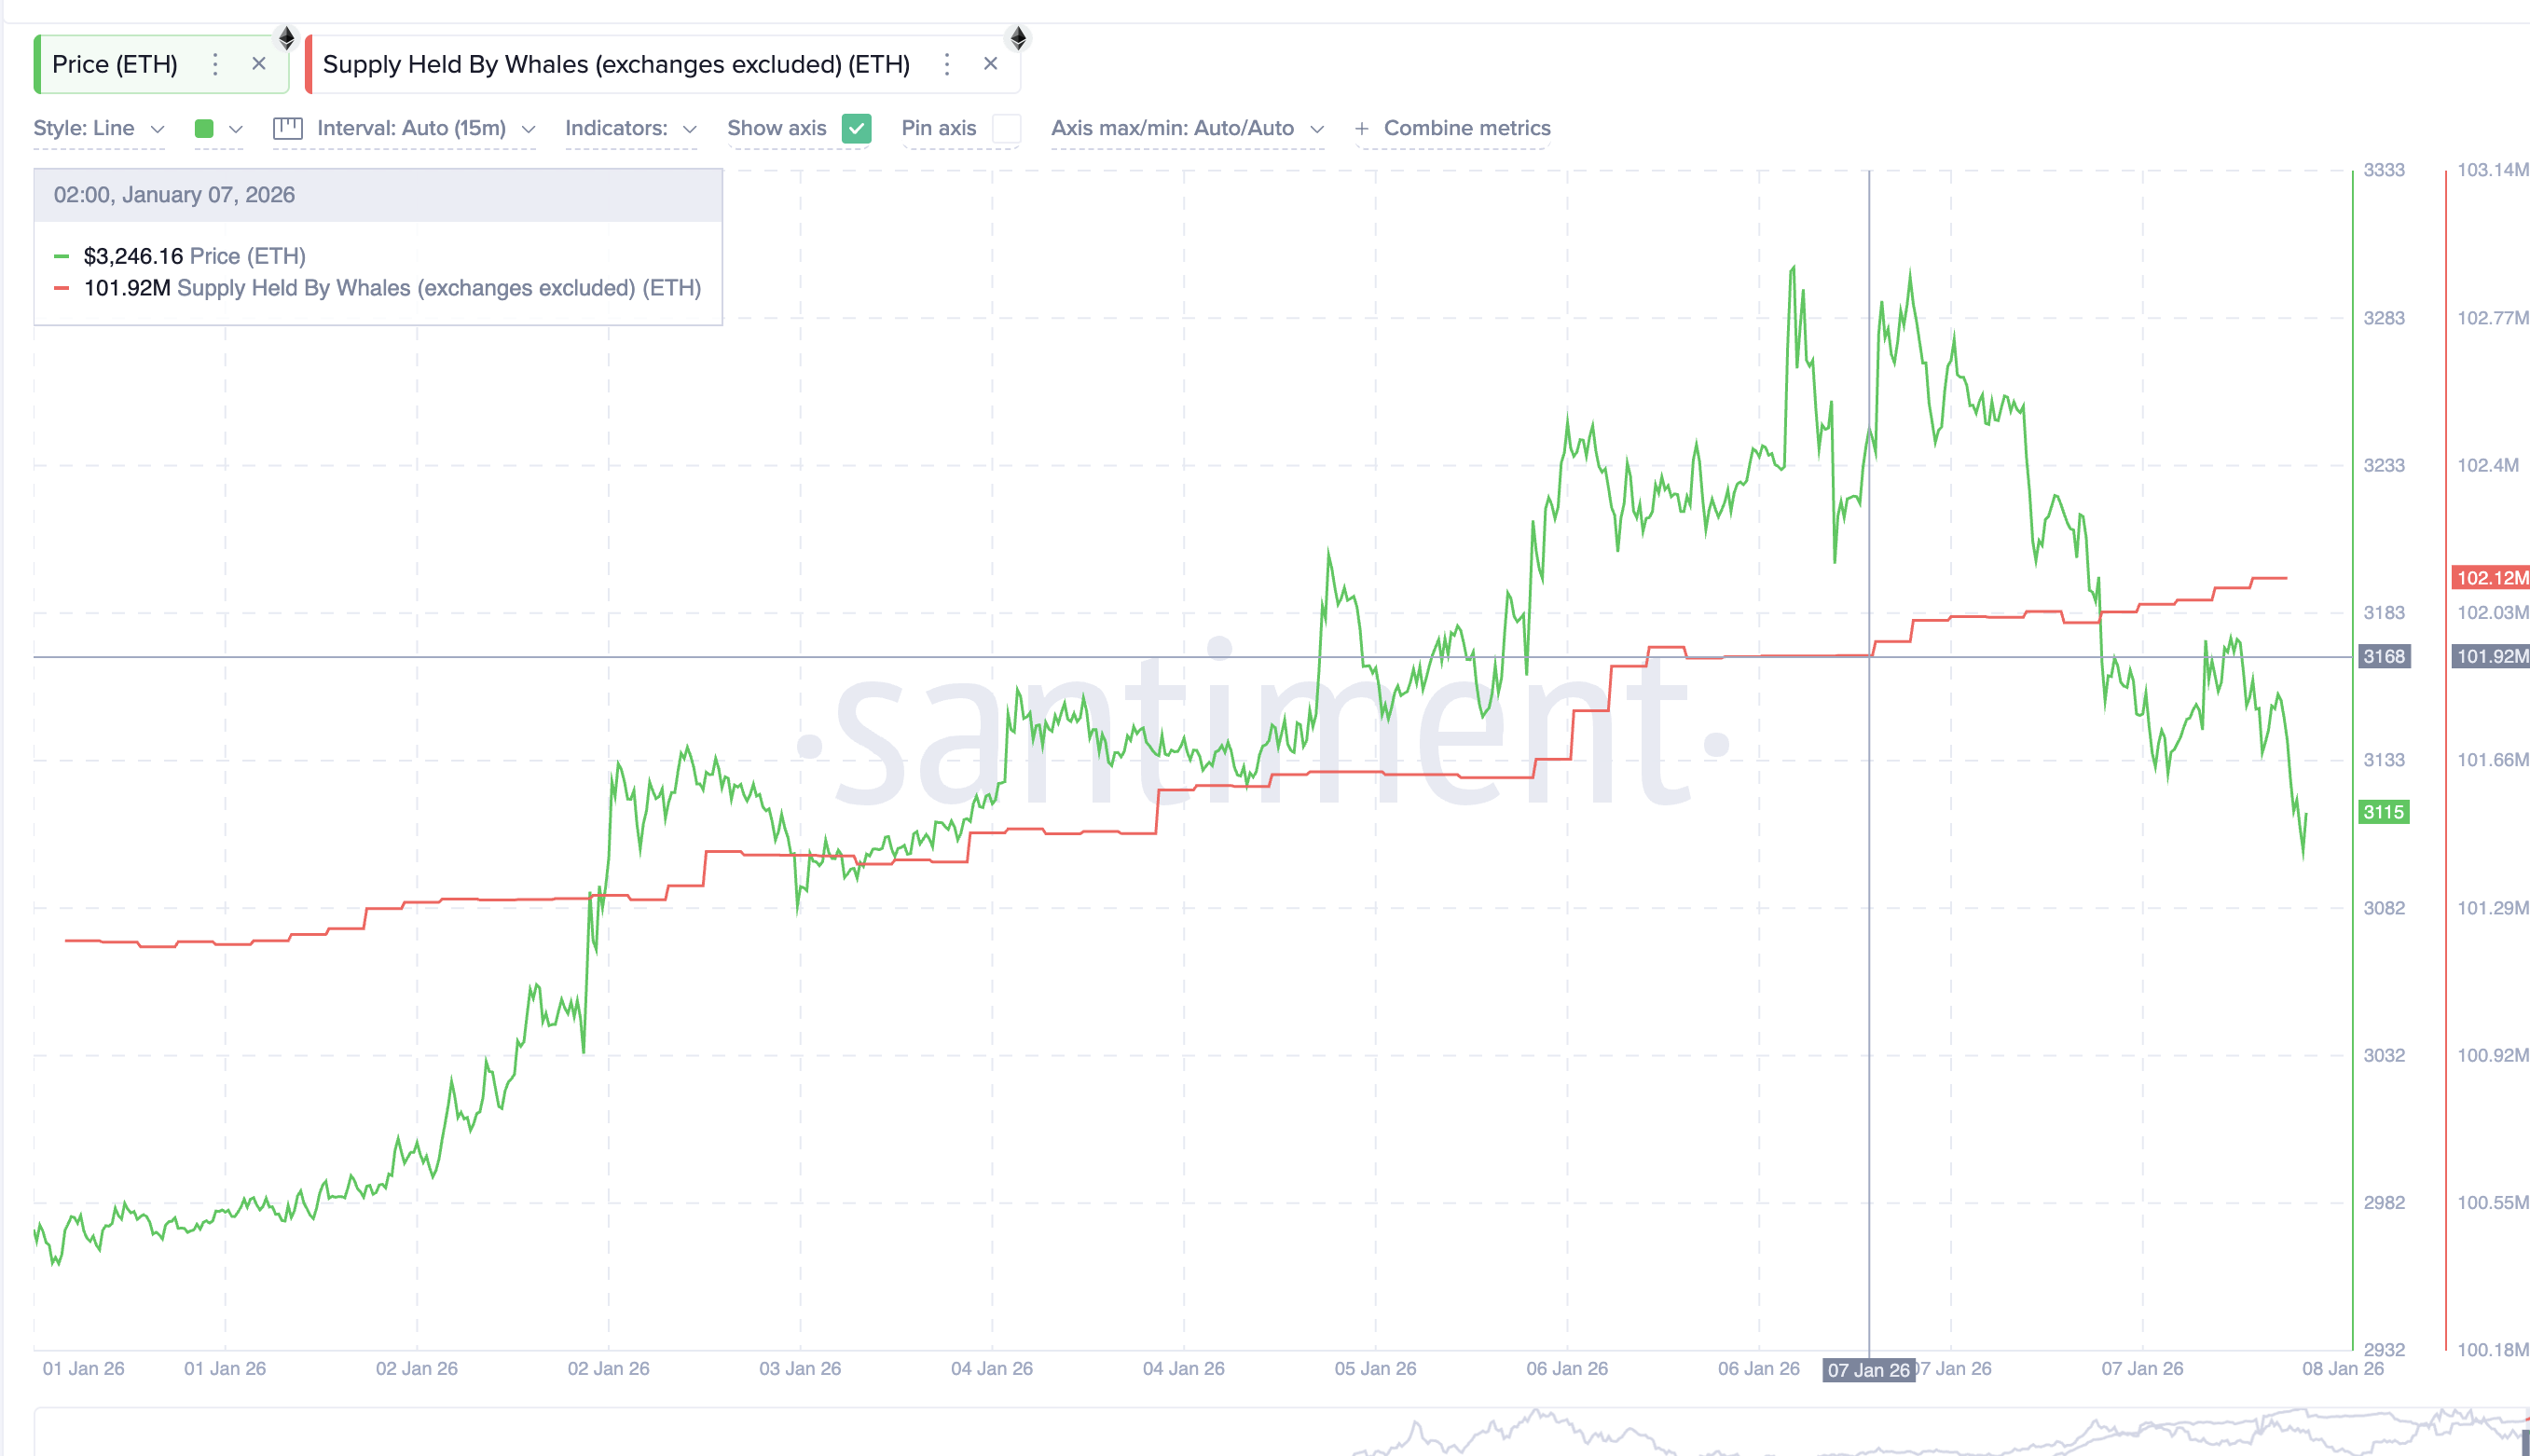
At current prices, that represents about $620 million worth of supply absorption during the pullback. That support is why Ethereum has stabilized rather than collapsed.
Now everything centers on one level. A daily close back above $3,140 would place ETH above the lower edge of the main cost basis cluster and reopen the path toward $3,300 and another test of the triangle’s upper boundary.
On the downside, $3,080 is the first line to watch. A sustained close below it would expose the thinner demand zone beneath, increasing the risk of a deeper drop toward the $2,800 level.
The Ethereum price is not weak, but it is undecided. Buyers are present, sellers are active, and neither side is willing to press hard enough. Until that changes, price will continue to hover around key levels, waiting for commitment to replace hesitation.
Search
RECENT PRESS RELEASES
Related Post


