Ethereum Price Forecast: ETH dips slightly as Trump ends Canada trade talks, but equities
June 27, 2025
- Ethereum briefly dropped below $2,400, but equities fared well after President Trump terminated trade talks with Canada.
- The decline comes as Ethereum’s funding rates and weighted sentiment have shown weakness.
- ETH could suffer a 35% decline if it validates an emerging death cross signal between the 50-day and 100-day SMAs.
Ethereum (ETH) is down 1% on Friday, briefly declining below the $2,400 key level as United States (US) President Donald Trump announced he is terminating trade discussions with Canada.
While Ethereum and most of the broader crypto market have been range-bound, stocks briefly climbed higher on Friday, with the S&P 500 and Nasdaq Composite hitting record highs.
The rise comes as Commerce Secretary Howard Lutnick confirmed that the US and China have finalized a trade deal. However, both indexes have tapered those gains following Trump’s announcement that the US is terminating trade talks with Canada.
“We have just been informed that Canada, a very difficult country to trade with, including the fact that they have charged our farmers as much as 400% tariffs, for years, on dairy Products, has just announced that they are putting a Digital Services Tax on our American technology companies, which is a direct and blatant attack on our Country,” Trump wrote in a Truth Social post on Friday.
“Based on this egregious Tax, we are hereby terminating ALL discussions on Trade with Canada, effective immediately. We will let Canada know the Tariff that they will be paying to do business with the United States of America within the next seven days period,” he added.
Following the announcement, Ethereum saw another round of modest decline, briefly dropping 1% below $2,400, with its weighted sentiment plummeting to levels last seen at the beginning of President Trump’s tariff rhetoric in early March. This suggests that retail optimism has waned compared to its earlier rise in the month despite the Israel-Iran ceasefire.
%20%5B22-1751059455440.15.53,%2027%20Jun,%202025%5D.png)
ETH Weighted Sentiment (7DMA). Source: Santiment
The uncertainty among investors is also noticeable in ETH’s funding rates, which have flashed negative severally in the past week. This exemplifies the indecision seen in ETH’s price movement amid a slight recovery earlier on Monday.
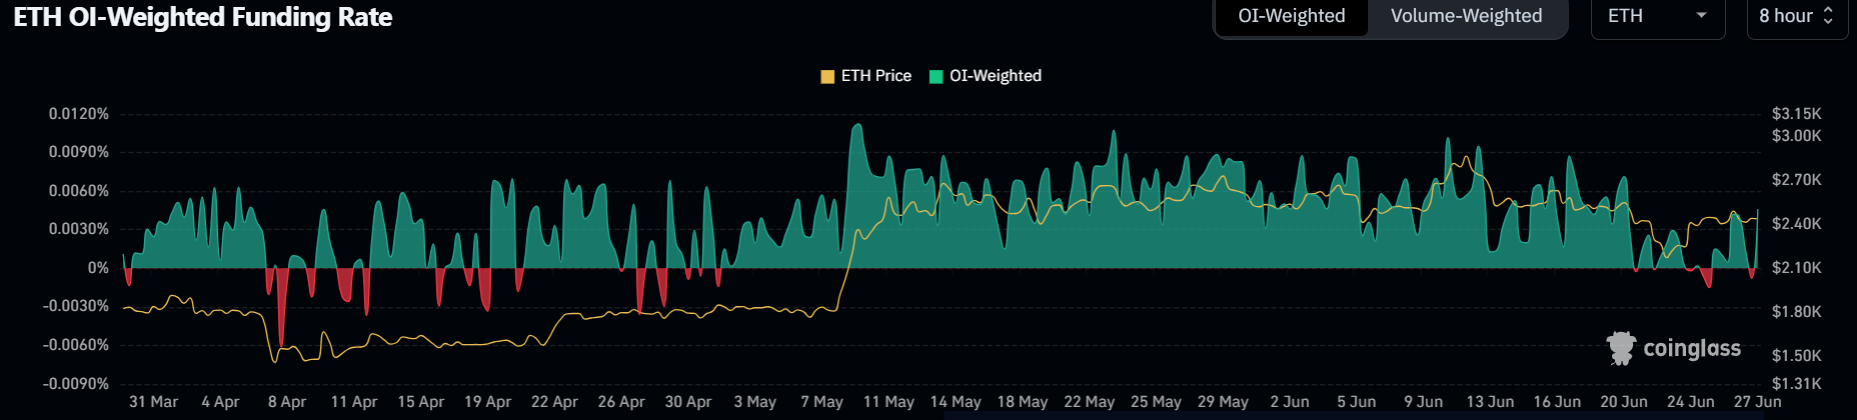
ETH Funding Rates. Source: Coinglass
The weak sentiment can be traced to investors maintaining a cautious approach, especially with the occasional macroeconomic shocks that have continued to disrupt market conditions in the past weeks.
Ethereum experienced $50.31 million in futures liquidations in the past 24 hours, with long and short liquidations accounting for $35.38 million and $14.93 million, respectively, according to Coinglass data.
In a bid to recover from its sharp decline to $2,110 last week, ETH has risen 8.5% so far this week, returning to its familiar $2,300-$2,800 range, where it has largely traded since its spike in early May.
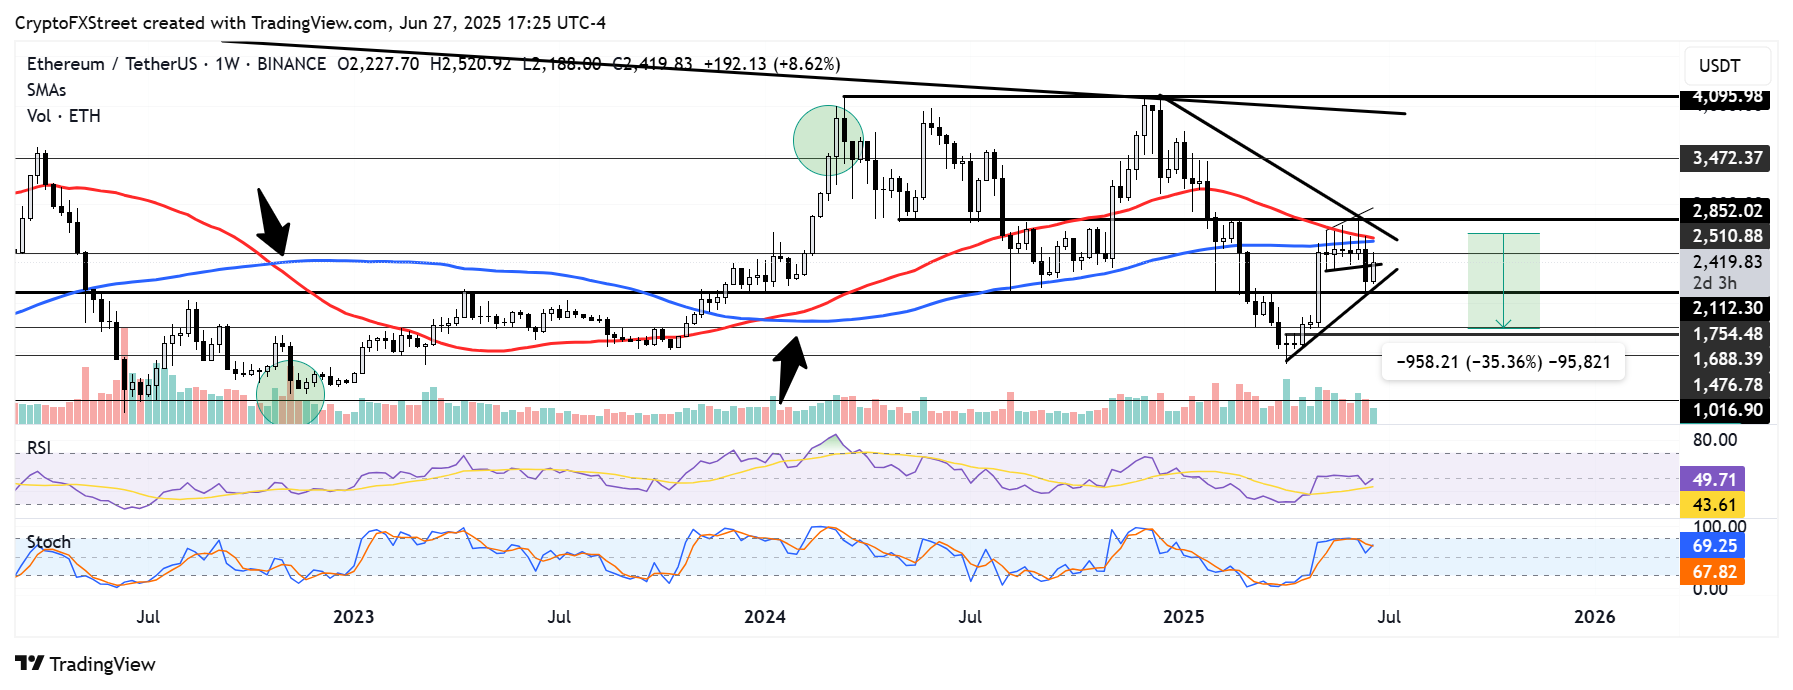
ETH/USDT weekly chart
On the weekly chart, the 50-period Simple Moving Average (SMA) is on the verge of crossing below the 100-period SMA, signaling a potential death cross. The last time this happened, between October and early November 2022, ETH crashed by 35%, from $1,680 to $1,080. Conversely, when the 50-period SMA crossed above the 100-period SMA in January 2024, ETH went on to rally over 90%.
If these SMAs carry a similar weight in current market conditions, a death cross could push ETH below key support levels, potentially reaching $1,700.
The Relative Strength Index (RSI) is testing its neutral level, while the Stochastic Oscillator (Stoch) is testing its overbought region line. Sustained rejections in both could strengthen bearish momentum, but successful crossovers will accelerate bullish pressure.
A breakout above the $2,850 key resistance will invalidate the bearish thesis and potentially send ETH toward $3,400.
Information on these pages contains forward-looking statements that involve risks and uncertainties. Markets and instruments profiled on this page are for informational purposes only and should not in any way come across as a recommendation to buy or sell in these assets. You should do your own thorough research before making any investment decisions. FXStreet does not in any way guarantee that this information is free from mistakes, errors, or material misstatements. It also does not guarantee that this information is of a timely nature. Investing in Open Markets involves a great deal of risk, including the loss of all or a portion of your investment, as well as emotional distress. All risks, losses and costs associated with investing, including total loss of principal, are your responsibility. The views and opinions expressed in this article are those of the authors and do not necessarily reflect the official policy or position of FXStreet nor its advertisers. The author will not be held responsible for information that is found at the end of links posted on this page.
If not otherwise explicitly mentioned in the body of the article, at the time of writing, the author has no position in any stock mentioned in this article and no business relationship with any company mentioned. The author has not received compensation for writing this article, other than from FXStreet.
FXStreet and the author do not provide personalized recommendations. The author makes no representations as to the accuracy, completeness, or suitability of this information. FXStreet and the author will not be liable for any errors, omissions or any losses, injuries or damages arising from this information and its display or use. Errors and omissions excepted.
The author and FXStreet are not registered investment advisors and nothing in this article is intended to be investment advice.
Search
RECENT PRESS RELEASES
Related Post

