Ethereum Price Forecast: ETH erases Trump’s tariff pause gains following rising distributi
April 11, 2025
Ethereum erased some of its post-tariff pause gains as bearish signs returned to the market.
The decline partly resulted from whales’ selling activity in the past 24 hours, which sent their holdings to a five-month low.
ETH technical indicators show signs of weakness as bulls and bears resume battle at the $1,500 support.
Ethereum (ETH) traded near $1,540 in the early hours of Friday after rising selling activity from whales saw the top altcoin erasing 4% of Trump’s post-tariff pause gains.
Following Trump’s recent tariff pause announcement, ETH rallied, gaining more than 11% on Wednesday as short-term bullish sentiment skyrocketed. However, similar to the market reactionto earlier rumors of a tariff pause on Monday, ETH is beginning to decline again, indicating the short-term rally could be a bull trap.
The price action aligns with recent experts’ predictions that risk-off sentiment still lingers in the market — especially after the Trump administration clarified that a 10% across-the-board tariff still applies to all imports.
On-chain data shows whales leveraged the short-term rally in the past 24 hours to sell at a slightly higher price.
A key Ethereum whale who bought ETH at a price of $8 sold 10,702 ETH at $1,576 after two years of inactivity, according to data from Lookonchain’s alert. Another ETH OG sold 7,974 ETH after three years of dormancy, followed by a DeFi participant selling 28,999 ETH to repay a debt.
The recent selling pressure has sent the balance of whales holding between 10K and 100K ETH to a five-month low of 24.66 million ETH. These whales have depleted their balance by 1.18 million ETH in the past six weeks alone.
%20%5B05-1744350325299.45.49,%2011%20Apr,%202025%5D.png)
ETH supply distribution (10K-100K coins) vs price. Source: Santiment
During periods of risk-off sentiments like the current market environment, an asset’s price decline accelerates when whales initiate intense selling activity, as visible in the chart above.
A similar selling activity occurred on Wednesday from investors who bought ETH between January and February following Trump’s pause announcement. This is visible in the blue spike in the chart below.
%20%5B05-1744350259532.51.02,%2011%20Apr,%202025%5D.png)
ETH spent coins age bands. Source: Santiment
Ethereum saw $88.75 million in futures liquidations in the past 24 hours, per Coinglass data. The total amount of long and short liquidations is $66.64 million and $24.11 million, respectively.
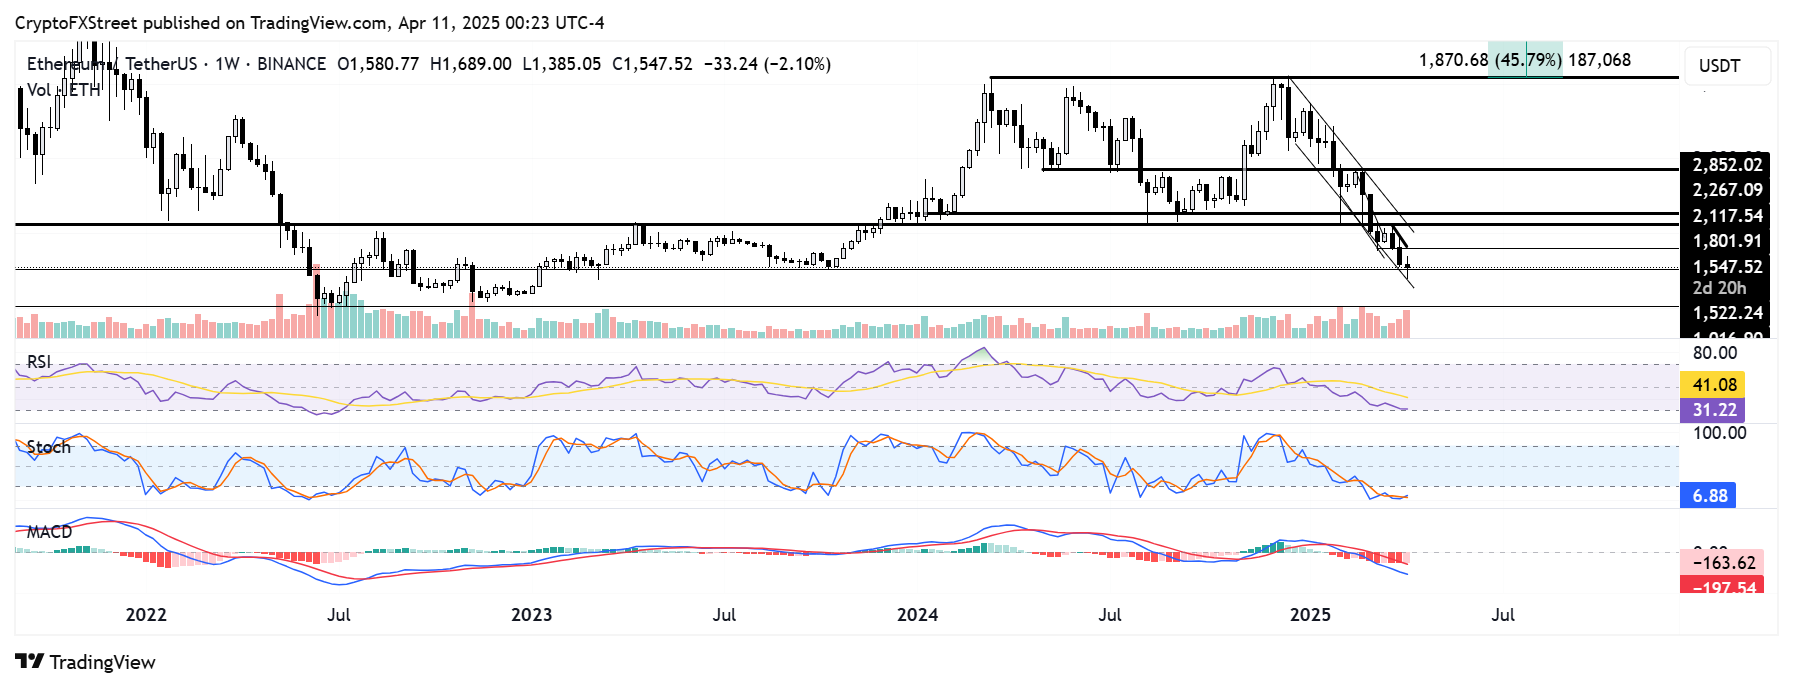
ETH is testing the support near $1,500 after declining 6% from Wednesday’s high of $1,682 to $1,540 at press time.
If bulls fail to hold the $1,522 support, ETH could test the lower boundary of a descending channel extending from December. The top altcoin has traded inside this channel for nearly four months. A bounce at the channel’s support could send ETH to tackle the $1,800 key level.

ETH/USDT weekly chart
However, if the channel’s support fails, ETH could plunge toward the $1,000 to $1,100 range — a critical support range during the UST/LUNA implosion and FTX crash of 2022, making it a key level to watch as macro uncertainty lingers.
Technical indicators on the weekly chart — the Relative Strength Index (RSI), Stochastic Oscillator (Stoch) and Moving Average Convergence Divergence (MACD) — show heightened bearish momentum and signs of oversold conditions.
A weekly candlestick close above the descending channel’s upper boundary will invalidate the thesis.
Search
RECENT PRESS RELEASES
Related Post


