Ethereum Price Forecast: ETH holds steady at $2,500 despite increasing selling pressure
May 20, 2025
- Ethereum witnessed increased distribution across its long and short-term holders cohorts on Tuesday.
- However, whale and institutional buying pressure have neutralized the selling impact, keeping prices relatively stable.
- Ethereum co-founder, Jeffrey Wilcke, briefly sparked negative sentiment after transferring his total ETH holdings to Kraken.
- ETH could rally more than 40% if it validates a rounded bottom pattern.
Ethereum (ETH) held steady above $2,500 on Tuesday despite investors stepping up their selling pressure with high profit-taking and loss realization activity.
Ethereum saw another round of rising selling activity on Tuesday, following a decline across the Mean Coin Age metric of short-term holders (STHs) and long-term holders (LTHs). The Mean Coin Age tracks the average number of days all tokens stayed in their current address, with a downtrend indicating rising distribution and vice versa for an uptrend.
%20%5B01-1747788358078.13.01,%2021%20May,%202025%5D.png)
ETH Mean Coin Age. Source: Santiment
The selling activity coincides with overheating conditions or increased trading volume — characterized by the red bubbles — noticeable in ETH’s futures bubble charts as prices reach the $2,500 level.
“This spike is primarily driven by profit-taking activity and the presence of resting supply at this psychologically significant price zone,” wrote CryptoQuant analyst ShayanMarkets in a post on Tuesday. “The overheated condition points to a likely short-term correction as the market cools down, paving the way for renewed accumulation.”
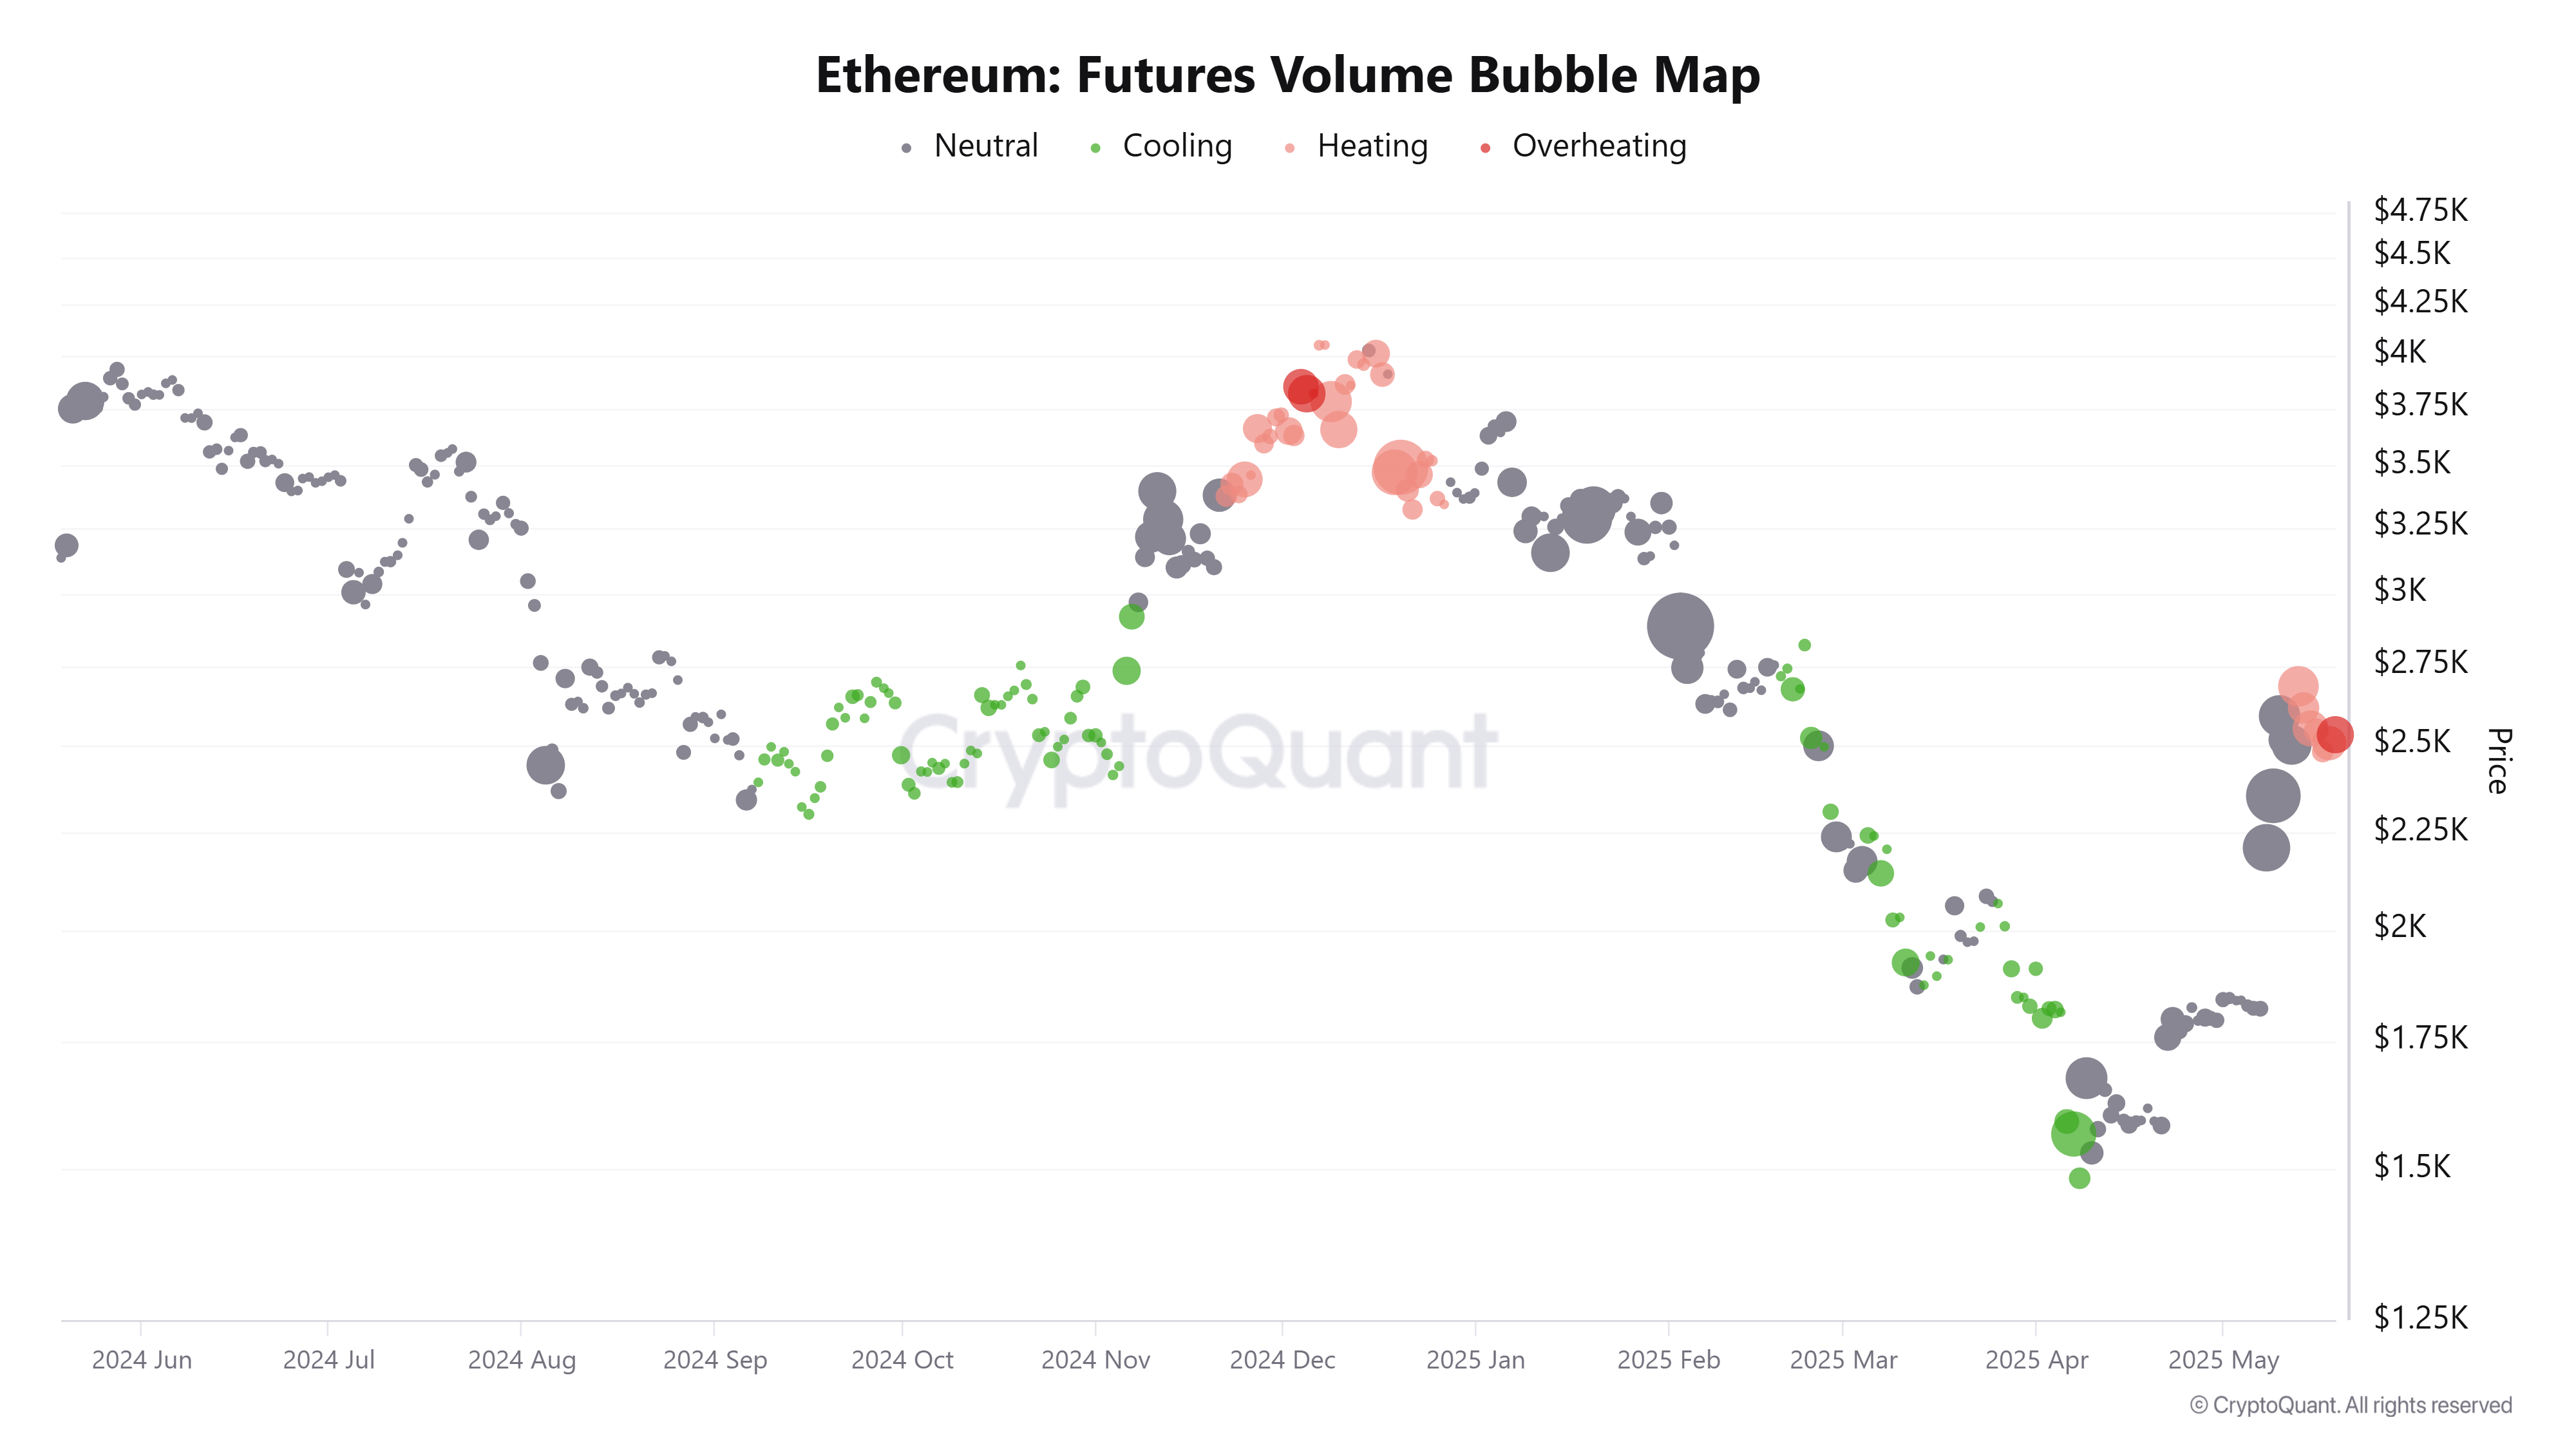
ETH Futures Volume Bubble Map. Source: CryptoQuant
The prediction aligns with the huge supply zone between $2,348 and $2,548, where investors historically purchased 70.78 million ETH, according to IntoTheBlock’s data. Investors may be sensitive to prices falling toward their cost basis, causing increased volatility around the $2,500 level.
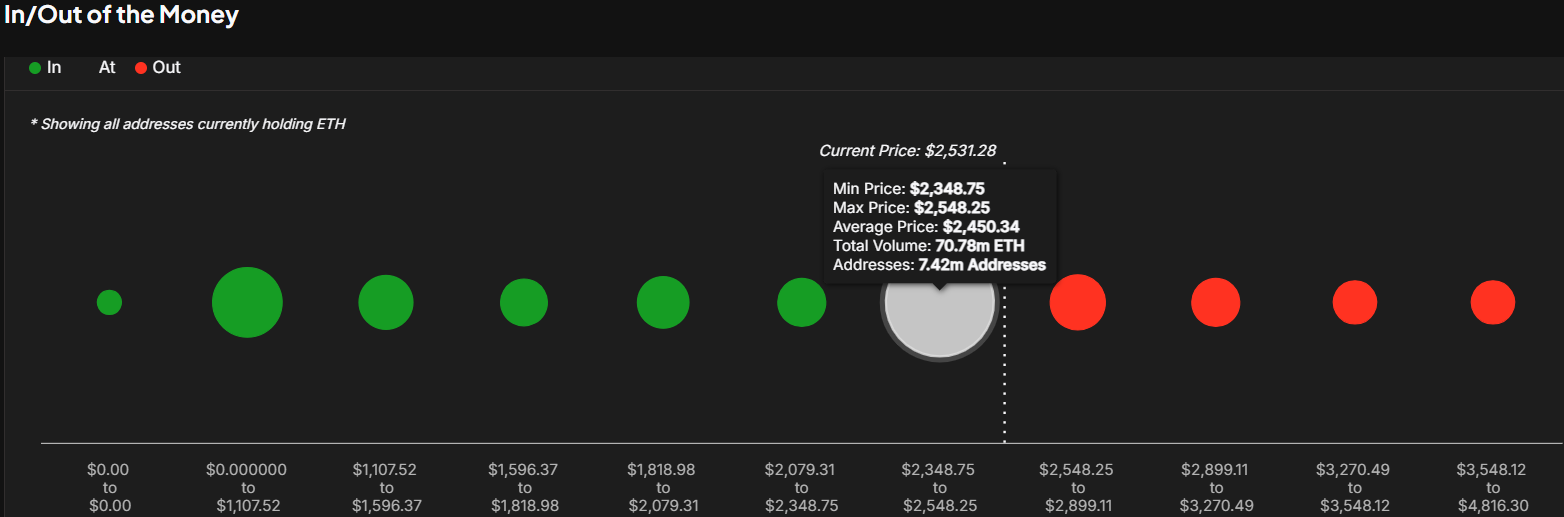
ETH Global In/Out of the Money. Source: IntoTheBlock
With prices hovering near $2,500, the ensuing high volume activity has resulted in another uptick in realized profit and loss, with investors booking nearly $300 million in profits and over $60 million in losses in the past two days, per Santiment data.
However, ETH’s price has remained relatively stable, with buying pressure from whales and institutions neutralizing the impact of the recent selling activity.
Notably, Nasdaq-listed BTCS announced on Tuesday that it acquired 3,450 ETH for $8.42 million, boosting its total ETH holdings to 12,500 ETH. Additionally, digital asset investment firm Abraxas Capital scooped up 46,295 ETH on Monday, stretching its total accumulation since May 7 to 350,703 ETH, according to on-chain wallet tracker Lookonchain’s data.
Meanwhile, Ethereum co-founder Jeffrey Wlicke briefly caused a spike in bearish sentiment after transferring almost his total ETH balance of 105,737 ETH to crypto exchange Kraken on Tuesday. After a few hours, nearly the same amount of ETH was transferred from Kraken to eight separate new addresses, indicating his earlier transfer wasn’t an intention to sell.
Ethereum saw $71.83 million in futures liquidations in the past 24 hours, according to Coinglass data. The total amount of long and short liquidations is $41.02 million and $30.81 million, respectively.
ETH has been struggling for direction on the weekly chart since its rally between May 8 and 11. Buyers and sellers have struggled to establish dominance near the $2,530 resistance, just shy of the $2,500 key psychological level.
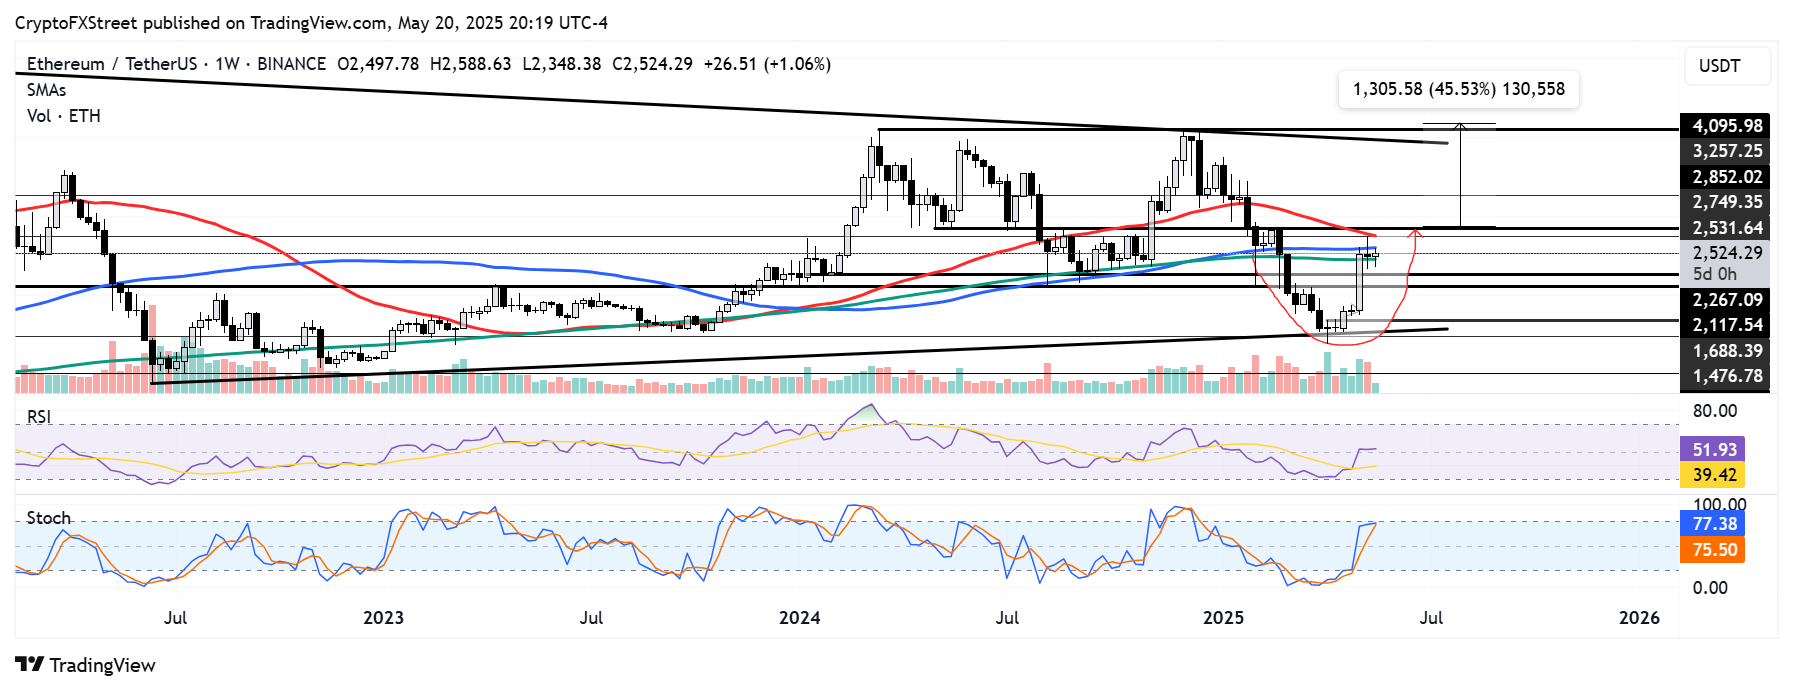
ETH/USDT weekly chart
This follows ETH’s attempt to complete a rounded bottom pattern before it faced resistance at the 50-week Simple Moving Average (SMA). If fresh demand emerges and ETH flips the 50-, 100- and 200-week SMAs into key support levels, it could charge above the $2,850 critical resistance to validate the rounded bottom pattern.
Such a move could see ETH rally over 40% to challenge its four-year high at $4,100, which is the upper boundary of a key rectangular channel.
The Relative Strength Index (RSI) has flattened near its neutral level, indicating uncertainty among traders. Meanwhile, the Stochastic Oscillator’s %K line is testing its %D line. A cross below could accelerate a dip in the bullish momentum.
A weekly candlestick close below the $2,260 – $2,100 range will invalidate the bullish thesis.
Share:
Cryptos feed
Information on these pages contains forward-looking statements that involve risks and uncertainties. Markets and instruments profiled on this page are for informational purposes only and should not in any way come across as a recommendation to buy or sell in these assets. You should do your own thorough research before making any investment decisions. FXStreet does not in any way guarantee that this information is free from mistakes, errors, or material misstatements. It also does not guarantee that this information is of a timely nature. Investing in Open Markets involves a great deal of risk, including the loss of all or a portion of your investment, as well as emotional distress. All risks, losses and costs associated with investing, including total loss of principal, are your responsibility. The views and opinions expressed in this article are those of the authors and do not necessarily reflect the official policy or position of FXStreet nor its advertisers. The author will not be held responsible for information that is found at the end of links posted on this page.
If not otherwise explicitly mentioned in the body of the article, at the time of writing, the author has no position in any stock mentioned in this article and no business relationship with any company mentioned. The author has not received compensation for writing this article, other than from FXStreet.
FXStreet and the author do not provide personalized recommendations. The author makes no representations as to the accuracy, completeness, or suitability of this information. FXStreet and the author will not be liable for any errors, omissions or any losses, injuries or damages arising from this information and its display or use. Errors and omissions excepted.
The author and FXStreet are not registered investment advisors and nothing in this article is intended to be investment advice.
Search
RECENT PRESS RELEASES
Related Post


