Ethereum Price Forecast: ETH investors returns to net buying, but short dominance stalls p
May 26, 2025
- Ethereum witnessed rising buying pressure across crypto exchanges and spot ETH ETFs.
- However, short positions have dominated Ethereum’s derivatives market.
- ETH could see increased selling pressure if bulls fail to defend a key ascending triangle support.
Ethereum (ETH) is up 1% on Monday following mixed signals across its on-chain data, where buyers lead in spot exchanges, but shorts dominate in the derivatives market.
Ethereum exchange flows returned to net outflows over the past 48 hours, indicating investors are increasingly moving funds off crypto exchanges to private wallets. This shows that buying pressure has regained dominance across spot exchanges after three consecutive days of net inflows or seller dominance — the longest since mid-April.
%20-%20All%20Exchanges%20(4)-1748296166238.png)
ETH Exchange Netflows. Source: CryptoQuant
Despite the slight net ETH selling recorded across crypto exchanges toward the end of last week, US spot Ether ETFs maintained a bullish structure, recording a weekly net inflow of $248.31 million, per SoSoValue data. This marks a second consecutive week and six straight days of positive flows for the products. In contrast to crypto exchange flows, inflows in spot ETFs represent buying activity.
Meanwhile, short traders have maintained dominance over ETH’s derivatives market in the past two weeks, as revealed by the failure of the Ethereum Taker Buy Sell Ratio to cross above its neutral level.
-1748296211806.png)
ETH Taker Buy Sell Ratio. Source: CryptoQuant
The metric tracks the ratio of buy volume divided by sell volume in ETH perpetual futures, with values below 1 indicating dominant bearish momentum.
A similar sentiment is noticeable on Binance, where investors have been rapidly expanding their short positions on ETH since its over 20% rise from May 8 to 12.
-1748296398605.png)
ETH Net Taker Volume. Source: CryptoQuant
The combination of dominant short positions on ETH derivatives and buying pressure on spot exchanges partly explains why its price has remained range-bound in the past two weeks.
Ethereum saw $41.87 million in futures liquidations in the past 24 hours, per Coinglass data. The total amount of long and short liquidations is $17.30 million and $24.57 million, respectively.
The top altcoin briefly declined below $2,500 over the weekend but quickly recovered on Monday.
ETH is currently struggling for direction after bouncing off the support of an ascending triangle pattern. The 14-day Exponential Moving Average (EMA) also serves as a dynamic support near the triangle’s rising trendline. A firm decline below these support levels could send ETH to the key range of $2,260 – $2,100.
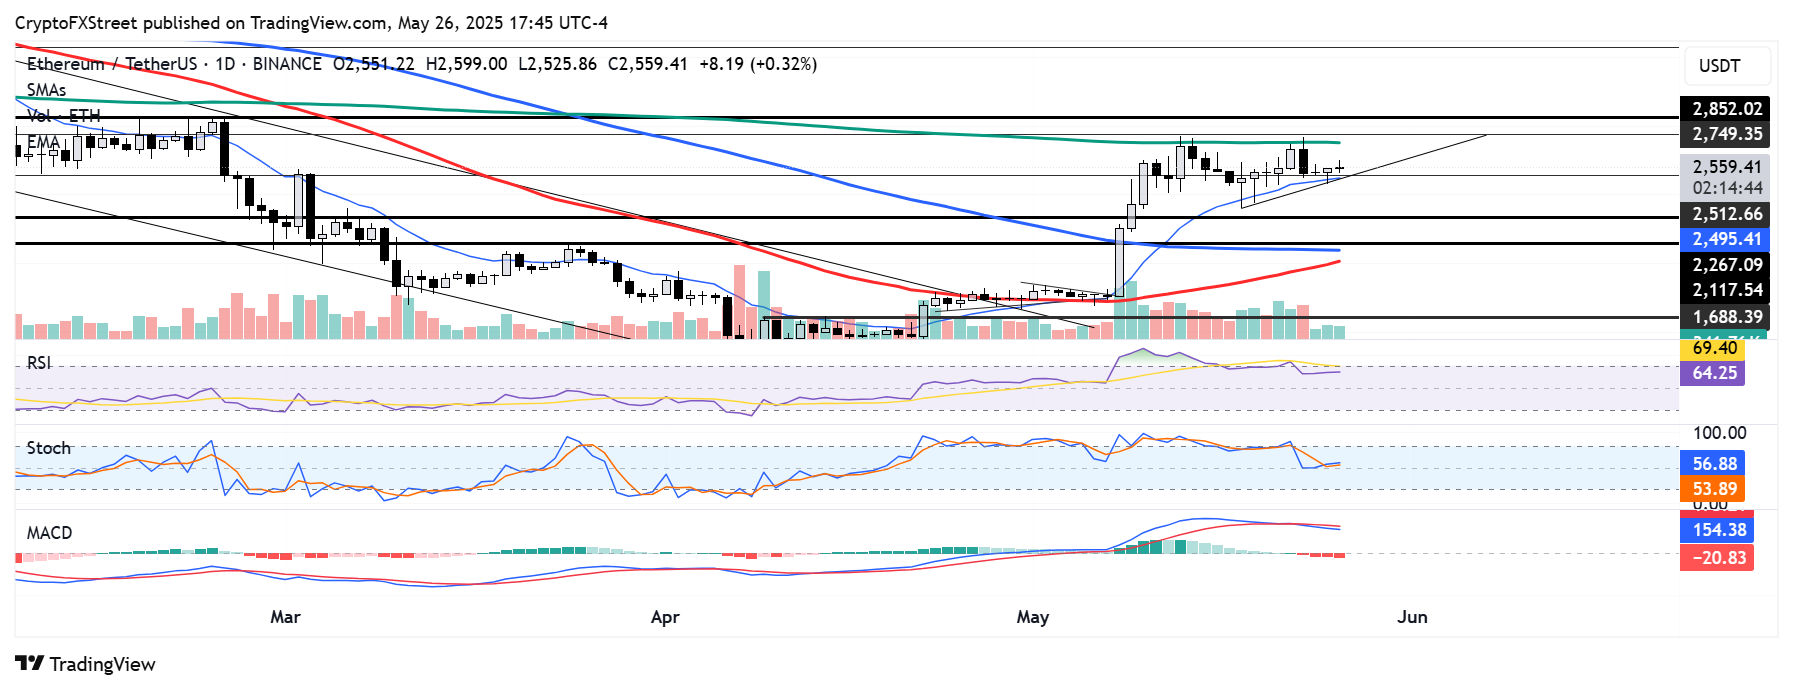
ETH/USDT daily chart
On the upside, ETH continues to face intense selling pressure whenever it approaches the $2,750 – $2,850 resistance range. A move that flips this range to a support level could see ETH begin another major uptrend toward the $3,250 level.
The Relative Strength Index (RSI) and Stochastic Oscillator (Stoch) are above their neutral levels but trending sideways after seeing declines on Friday, indicating weakening bullish momentum. Meanwhile, the Moving Average Convergence Divergence (MACD) crossed below its moving average line after its histograms flipped negative, signaling rising bearish pressure.
Share:
Cryptos feed
Search
RECENT PRESS RELEASES
Related Post


