Ethereum Price Forecast: ETH jumps 9% as bulls capitalize on weak US CPI data
May 13, 2025
- Ethereum gained 9% on Tuesday after a lower-than-expected US CPI data for April renewed bullish sentiments in the crypto market.
- Ethereum’s outperformance shows major rotation from Bitcoin, but the ETH/BTC ratio risks a sell-off if a historical pattern holds.
- ETH could validate a bullish flag pattern if it flips the 200-day SMA to a support level.
Ethereum (ETH) saw a quick rebound on Tuesday, rising 9% following a soft April Consumer Price Index (CPI) reading in the United States (US). The top altcoin bounced off the $2,400 level and stretched its weekly gains to 50% as it continues to see sustained demand, with more analysts predicting a rotation from BTC toward ETH.
Ethereum jumped 9%, boosting its weekly gains to 50% after the Bureau of Labor Statistics (BLS) revealed that US inflation in April came below market expectations.
Headline CPI saw a mild 0.2% monthly increase below forecasts of 0.3% and slowed to 2.3% annually, below expectations of 2.4% — its lowest since February 2021. Core CPI, which excludes volatile food and energy prices, increased monthly by 0.2%, also under forecasts of 0.3%, and held steady at 2.8% annually.
The weak inflation data renewed bullish sentiment in cryptocurrencies, with increased expectations of the Federal Reserve (Fed) lowering rates by 25 basis points in September, per the CME FedWatch Tool.
US President Donald Trump also called out Fed Chair Jerome Powell again in a Tuesday Truth Social post, saying “the Fed must lower the rate like Europe and China have done.”
Following the weak April CPI data, Ethereum reclaimed the $2,600 level, maintaining its standout performance over the past week, with buying pressure from crypto native investors and institutions.
In the past 24 hours, digital asset investment manager Abraxas Capital upped its ETH holdings again, withdrawing 33,482 ETH from Binance after borrowing 240 million USDT from lending platform Aave. The firm has bought 211,030 ETH since last Wednesday, per on-chain tracker Lookonchain.
Despite the buying pressure, Ethereum’s funding rates are only moderately high, and options are partially skewed toward puts, “indicating that the breakout is not driven by speculative excess,” noted QCP analysts.
“We are also beginning to see a re-emergence of longer-dated option flows, which could be an early sign that ETH is positioning itself as the market’s next major allocation play,” they added.
This is noticeable in Ethereum’s outperformance of Bitcoin last week after months of steady decline in the ETH/BTC ratio. The ratio has increased by over 30% from 0.018 to 0.025 over the past week, indicating rotation toward the top altcoin.
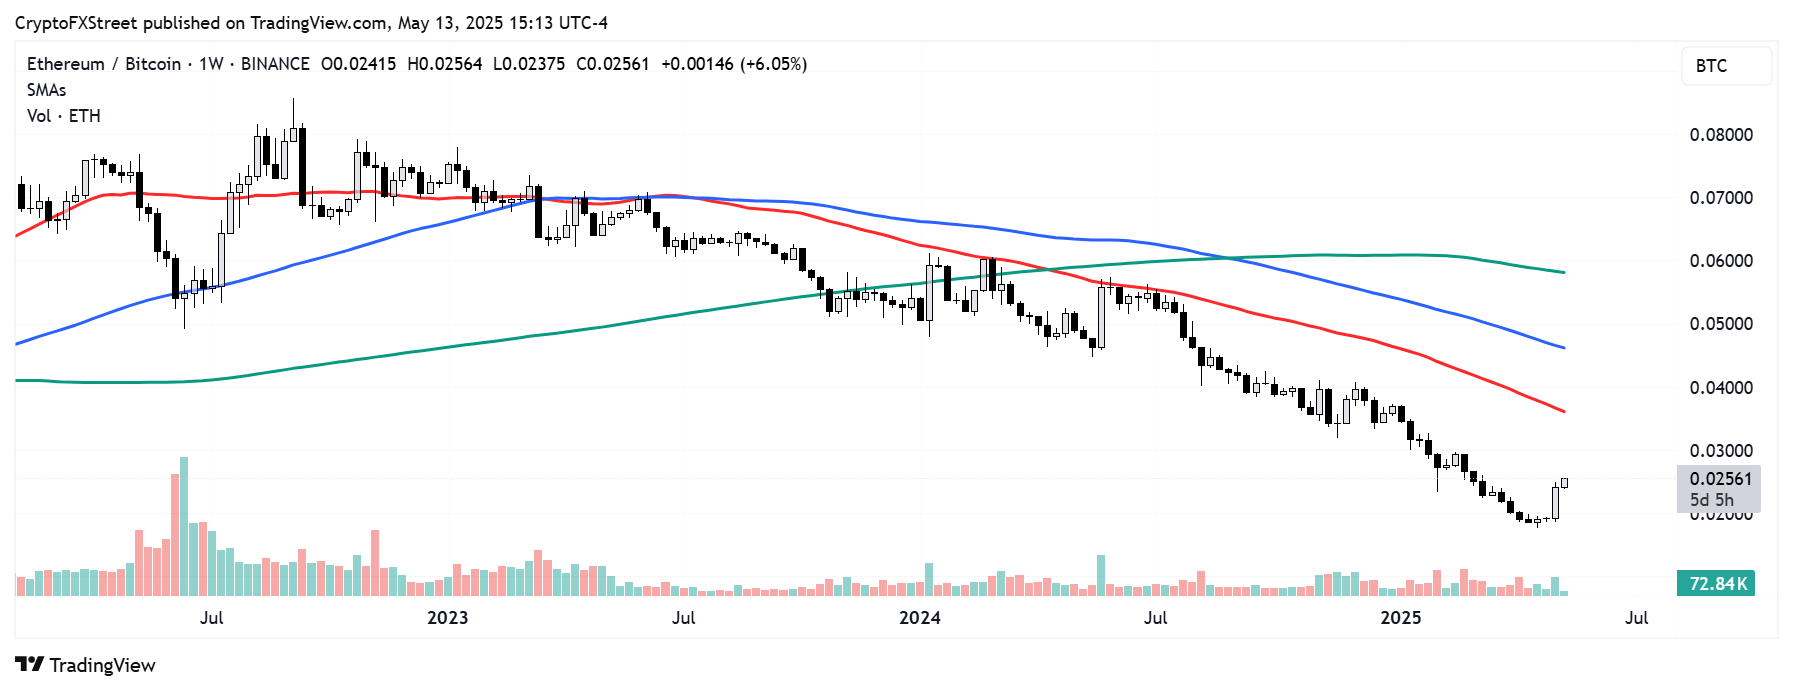
ETH/BTC weekly chart
“Still, over the past 2.5 years, a bullish weekly ETHBTC candle has often been followed by a sell-off — whether that pattern holds this time remains to be seen,” Crypto Finance analysts led by Tim Beer wrote in a Tuesday note.
Meanwhile, investors are upping their predictions on ETH, with bets of the top altcoin moving above $2,800 and $3,000 by the end of May rising from 1% to 17% and 0.5% to 9%, respectively, in the past week, according to Nick Forster founder of crypto options exchange Derive.
Ethereum saw $126.21 million in futures liquidations in the past 24 hours, per Coinglass data. The total amount of liquidated long and short positions is $27.44 million and $98.86 million, respectively. This is more than twice Bitcoin’s 24-hour liquidations which is at $46.67 million.
After bouncing off a descending trendline near $2,400, ETH has reclaimed the $2,544 key level and is testing the 200-day Simple Moving Average (SMA) resistance. As a result, the top altcoin is developing a somewhat bullish flag.
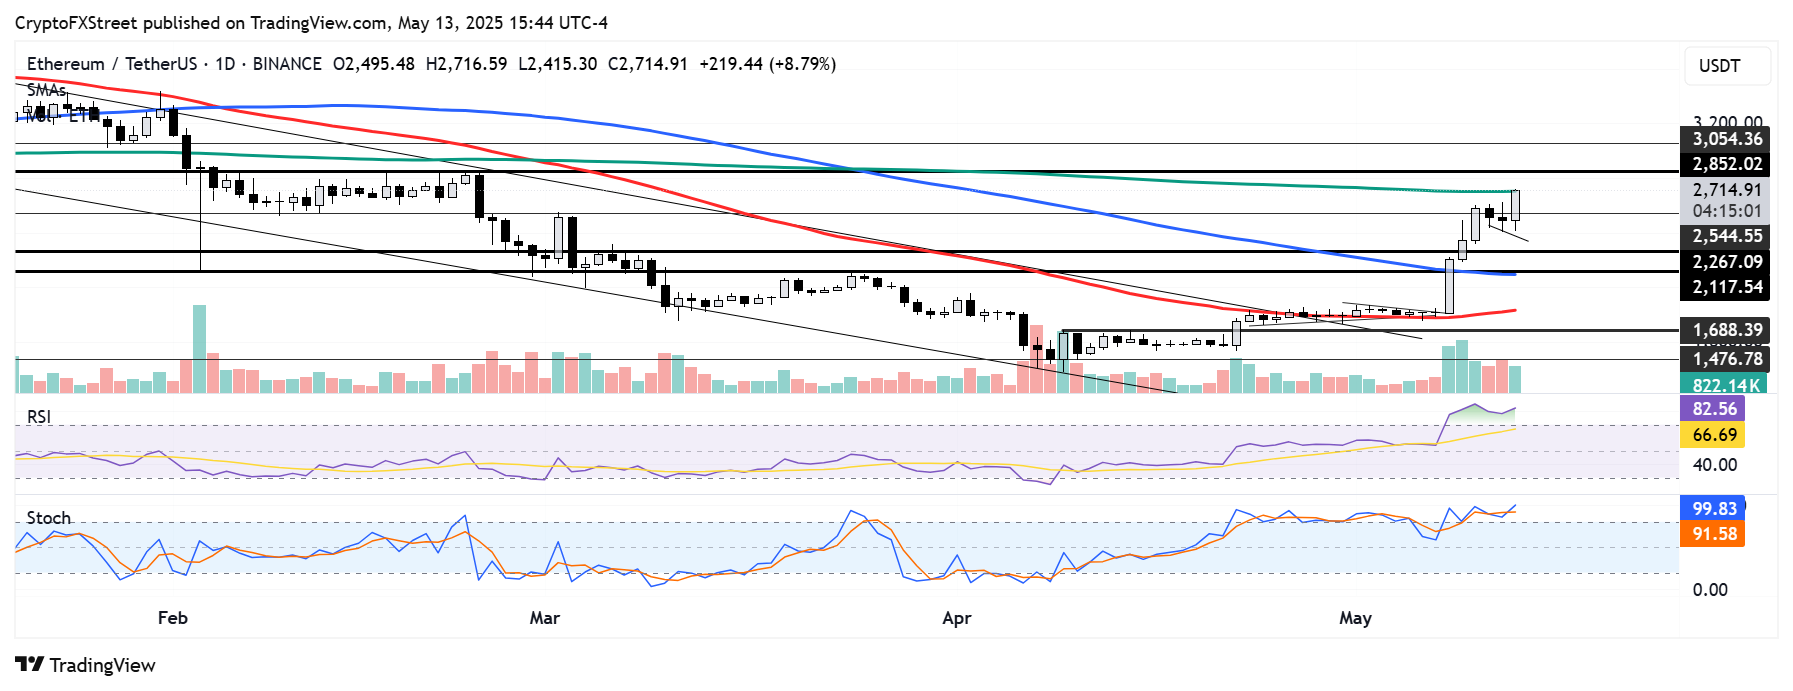
ETH/USDT daily chart
If ETH fails to hold the move above $2,544, it could post a similar price movement to its two-week consolidation between April 23 and May 7, after which it rallied nearly 40%. The descending trendline could serve as a key support, considering it aligns with ETH’s highest historical demand range — $2,300 to $2,400 — where investors purchased 63.76 million ETH, per data from IntoTheBlock.
On the upside, ETH could validate the bullish flag pattern and clear the $2,850 resistance if it flips the 200-day SMA to a support level.
The Relative Strength Index (RSI) and Stochastic Oscillator (Stoch) have remained in the overbought region since May 8, indicating increased bullish momentum and a potential correction.
A daily candlestick close below $2,100 will invalidate the thesis and potentially send ETH toward $1,688.
Share:
Cryptos feed
Information on these pages contains forward-looking statements that involve risks and uncertainties. Markets and instruments profiled on this page are for informational purposes only and should not in any way come across as a recommendation to buy or sell in these assets. You should do your own thorough research before making any investment decisions. FXStreet does not in any way guarantee that this information is free from mistakes, errors, or material misstatements. It also does not guarantee that this information is of a timely nature. Investing in Open Markets involves a great deal of risk, including the loss of all or a portion of your investment, as well as emotional distress. All risks, losses and costs associated with investing, including total loss of principal, are your responsibility. The views and opinions expressed in this article are those of the authors and do not necessarily reflect the official policy or position of FXStreet nor its advertisers. The author will not be held responsible for information that is found at the end of links posted on this page.
If not otherwise explicitly mentioned in the body of the article, at the time of writing, the author has no position in any stock mentioned in this article and no business relationship with any company mentioned. The author has not received compensation for writing this article, other than from FXStreet.
FXStreet and the author do not provide personalized recommendations. The author makes no representations as to the accuracy, completeness, or suitability of this information. FXStreet and the author will not be liable for any errors, omissions or any losses, injuries or damages arising from this information and its display or use. Errors and omissions excepted.
The author and FXStreet are not registered investment advisors and nothing in this article is intended to be investment advice.
Search
RECENT PRESS RELEASES
Related Post


