Ethereum Price Forecast: ETH leads crypto products flows following staking boost from SEC
June 2, 2025
- Ethereum ETFs outperformed the global crypto products market with $321 million inflows, extending the streak to six weeks.
- SEC Division of Corporation Finance’s positive statement on staking likely boosted interest in Ethereum products amid the crypto market decline.
- ETH risks declining to $2,260 if it fails to clear a rising trendline and 50-period SMA hurdles.
Ethereum (ETH) trades around $2,500 on Monday following an outperformance of investment products tracking its price.
Ethereum investment products outperformed the total digital asset product market last week with $321 million in inflows. This marks the sixth consecutive week of net inflows totaling $1.19 billion, their strongest streak since December 2024, according to CoinShares digital asset fund flows weekly report. US spot Ethereum exchange-traded funds (ETFs) dominated the weekly flows, with $285.8 million in net inflows, extending their inflow streak to ten days.
In contrast, Bitcoin products ended their six-week inflows run with $8 million in outflows after reversing their strong inflows from earlier in the week. Additionally, XRP products experienced $28.2 million in net outflows, marking the second consecutive week of outflows.
The outperformance of Ethereum funds follows a statement last Thursday from the Securities and Exchange Commission (SEC) Division of Corporation Finance clarifying that certain “staking” activities do not fall under the scope of securities laws. The Division, led by Commissioner Hester Peirce, highlighted that the statement applies to self-stakers of covered crypto assets, as well as non-custodial and custodial staking-as-a-service providers.
The SEC’s new position has boosted interest in ETH and could open the door for it to approve filings from asset managers seeking to allow staking within their Ethereum ETFs.
Ethereum saw $31.63 million in futures liquidations over the past 24 hours, according to Coinglass data. The total amount of long and short liquidations is $15.69 million and $15.95 million, respectively.
ETH declined below the rising trendline of an ascending triangle pattern and the 50-period Simple Moving Average (SMA) on Friday and has since struggled around the $2,500 level. If ETH fails to move above the rising trendline and the 50-period SMA in the coming days, it may find support near the 100-period SMA. Further below, the $2,260 to $2,100 range serves as a key support level.
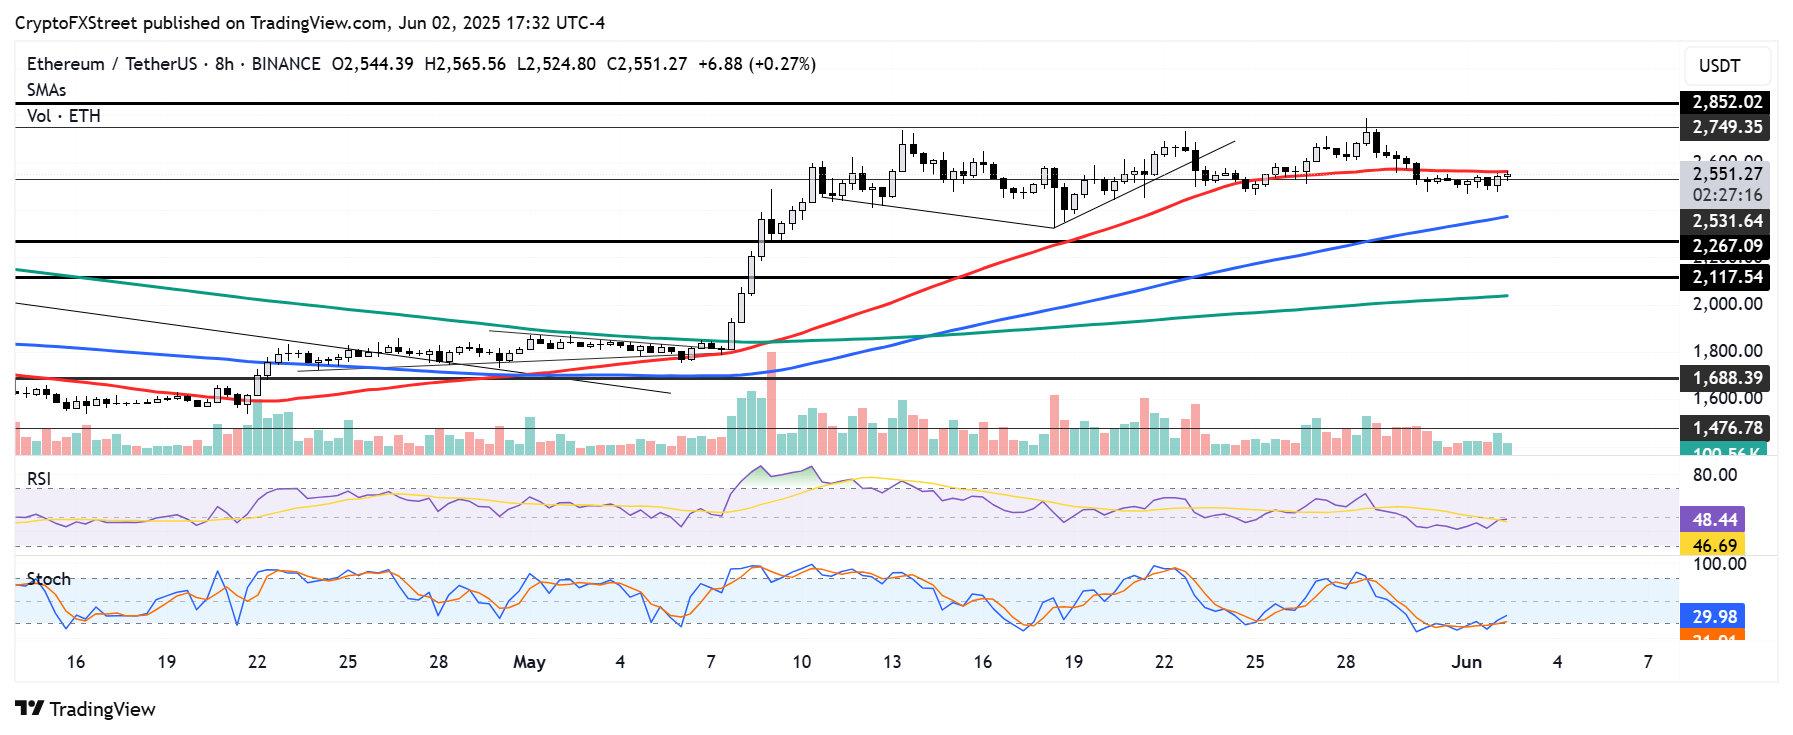
ETH/USDT 8-hour chart
On the upside, ETH has to maintain a firm move above the range between $2,750 and $2,850 to begin an uptrend.
The Relative Strength Index (RSI) and Stochastic Oscillator (Stoch) are below their neutral levels, indicating dominant bearish momentum.
Share:
Cryptos feed
Information on these pages contains forward-looking statements that involve risks and uncertainties. Markets and instruments profiled on this page are for informational purposes only and should not in any way come across as a recommendation to buy or sell in these assets. You should do your own thorough research before making any investment decisions. FXStreet does not in any way guarantee that this information is free from mistakes, errors, or material misstatements. It also does not guarantee that this information is of a timely nature. Investing in Open Markets involves a great deal of risk, including the loss of all or a portion of your investment, as well as emotional distress. All risks, losses and costs associated with investing, including total loss of principal, are your responsibility. The views and opinions expressed in this article are those of the authors and do not necessarily reflect the official policy or position of FXStreet nor its advertisers. The author will not be held responsible for information that is found at the end of links posted on this page.
If not otherwise explicitly mentioned in the body of the article, at the time of writing, the author has no position in any stock mentioned in this article and no business relationship with any company mentioned. The author has not received compensation for writing this article, other than from FXStreet.
FXStreet and the author do not provide personalized recommendations. The author makes no representations as to the accuracy, completeness, or suitability of this information. FXStreet and the author will not be liable for any errors, omissions or any losses, injuries or damages arising from this information and its display or use. Errors and omissions excepted.
The author and FXStreet are not registered investment advisors and nothing in this article is intended to be investment advice.
Search
RECENT PRESS RELEASES
Related Post


