Ethereum Price Forecast: ETH products see increased inflows, but rising shorts slow moment
May 19, 2025
- Ethereum products recorded $205 million in net inflows, and whales added 670K ETH to their holdings last week.
- However, hedge funds cancelled out the buying pressure, increasing their short positions in anticipation of another round of delta-neutral play.
- ETH could validate a bullish flag pattern if it holds the $2,260 support and rallies above a key upper boundary trendline.
Ethereum (ETH) trades around $2,500 on Monday following mixed signals across its on-chain metrics. While strong buying pressure is visible across ETH products and whale balances, hedge funds and traders are boosting their short positions.
Ethereum products bounced back last week, recording weekly inflows of $205 million following renewed investor optimism in the top altcoin. This comes after a successful Pectra upgrade and leadership restructuring at the Ethereum Foundation, according to CoinShares’ weekly report.
Unlike previous weeks, where US spot Ethereum ETFs often led the inflows, the buying was spread fairly across ETH product providers globally.
The optimism around Ethereum also filtered into the sentiment of whales holding between 10K and 100K ETH. These investors have increased their balance by 670K ETH in the past five days, signaling intense whale buying pressure.
%20%5B20-1747682738880.11.16,%2019%20May,%202025%5D.png)
ETH Supply Distribution. Source: Santiment
Despite the sustained inflows into Ethereum products and whale wallets, ETH’s price declined slightly by about 1% last week, cooling its bullish momentum from the previous week.
A potential reason for the cool-off in price could be rising short positions in Ethereum futures. Binance’s ETH Net Taker Volume, which tracks the average volume of shorts versus longs, shows a rising short positioning.
-1747682770598.png)
ETH Net Taker Volume. Source: CryptoQuant
A similar trend is visible in the Chicago Mercantile Exchange (CME), where hedge funds increased their short positions by $880 million last week, pushing their net position to -$1.25 billion.
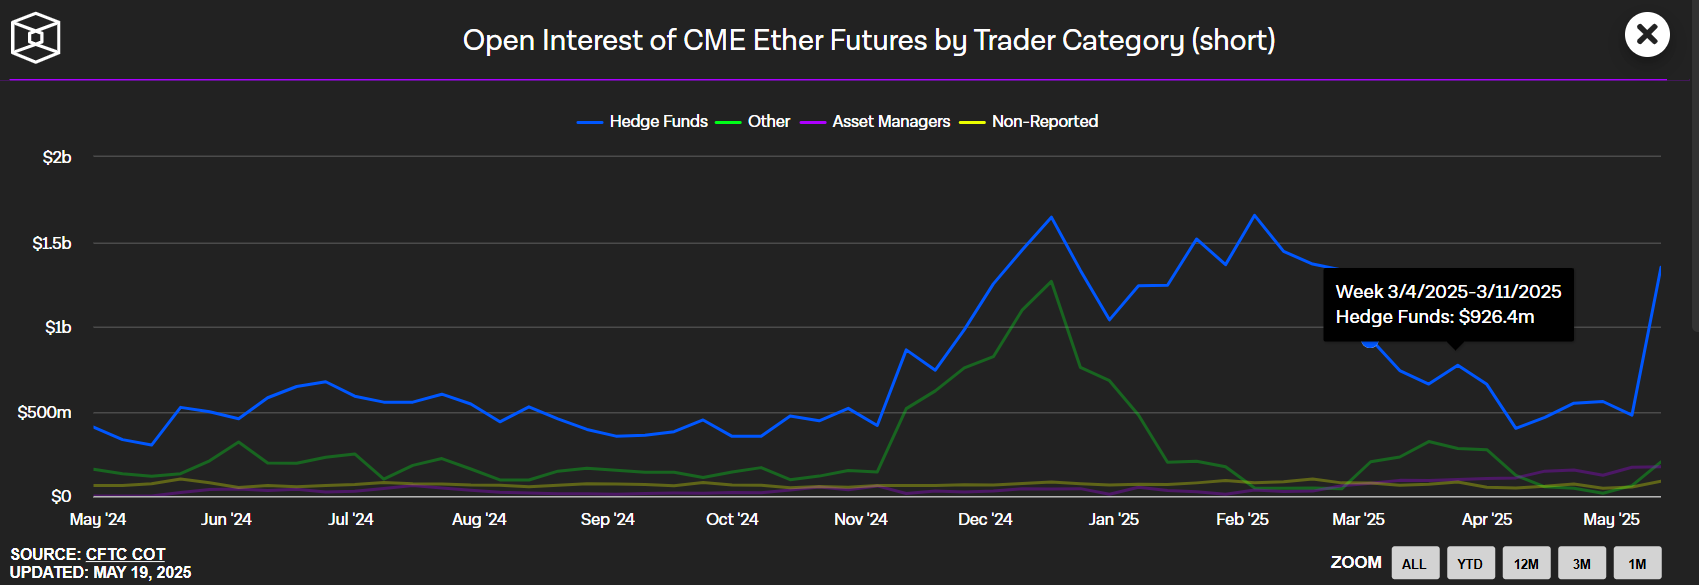
ETH Futures Short Positions (CME). Source: The Block
The development suggests hedge funds may be looking to repeat their delta-neutral strategy deployed during ETH’s rally between November and December 2024. The strategy often involves buying ETH through spot channels, including ETH ETFs and selling or holding an equivalent short position in the futures market.
In addition to Trump’s tariff, ETH’s large negative Q1 returns and underperformance was driven by the large short pressure. As a result, if the trend continues developing alongside inflows in Ethereum products, it could signal the beginning of another round of range-bound movement for the top altcoin.
Ethereum saw $235.41 million in futures liquidations in the past 24 hours, per Coinglass data. The total amount of liquidated long and short positions is $170.30 million and $65.10 million, respectively.
ETH declined below the $2,530 level over the weekend and is looking to stage a recovery. The decline follows a rejection at the 200-day Simple Moving Average (SMA) on Wednesday, with an upper boundary descending trendline of a bullish flag pattern serving as resistance in the past five days.
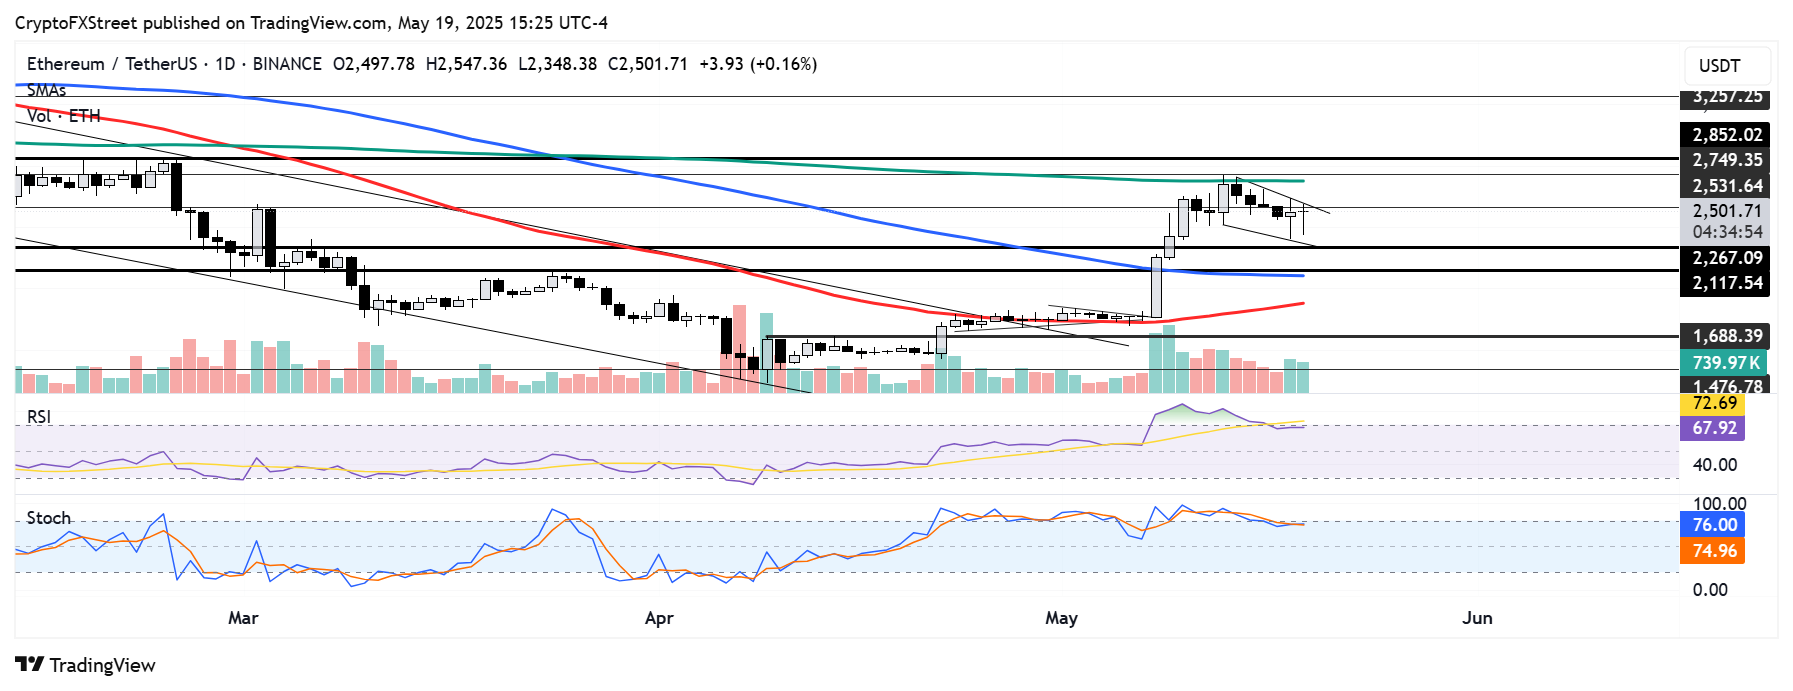
ETH/USDT daily chart
ETH could validate a bullish continuation pattern if it bounces off the $2,260 support and smashes the flag’s resistance. Such a move could send ETH above the $3,000 psychological level to test the $3,250 resistance.
On the downside, ETH risks a drop toward $1,688 if it sees a firm decline below $2,110.
The Relative Strength Index (RSI) and Stochastic Oscillator (Stoch) slightly retreated from their overbought regions, indicating weakening bullish momentum. Meanwhile, the Moving Average Convergence Divergence (MACD) line is testing its moving average while its histogram bars are about to flip negative. A cross below validates a bearish breakdown.
A daily candlestick close below $1,688 will invalidate the thesis and potentially send ETH toward $1,500.
Share:
Cryptos feed
Information on these pages contains forward-looking statements that involve risks and uncertainties. Markets and instruments profiled on this page are for informational purposes only and should not in any way come across as a recommendation to buy or sell in these assets. You should do your own thorough research before making any investment decisions. FXStreet does not in any way guarantee that this information is free from mistakes, errors, or material misstatements. It also does not guarantee that this information is of a timely nature. Investing in Open Markets involves a great deal of risk, including the loss of all or a portion of your investment, as well as emotional distress. All risks, losses and costs associated with investing, including total loss of principal, are your responsibility. The views and opinions expressed in this article are those of the authors and do not necessarily reflect the official policy or position of FXStreet nor its advertisers. The author will not be held responsible for information that is found at the end of links posted on this page.
If not otherwise explicitly mentioned in the body of the article, at the time of writing, the author has no position in any stock mentioned in this article and no business relationship with any company mentioned. The author has not received compensation for writing this article, other than from FXStreet.
FXStreet and the author do not provide personalized recommendations. The author makes no representations as to the accuracy, completeness, or suitability of this information. FXStreet and the author will not be liable for any errors, omissions or any losses, injuries or damages arising from this information and its display or use. Errors and omissions excepted.
The author and FXStreet are not registered investment advisors and nothing in this article is intended to be investment advice.
Search
RECENT PRESS RELEASES
Related Post


