Ethereum Price Forecast: ETH sees a downtick despite successful Pectra launch on Hoodi testnet
March 26, 2025
Ethereum Pectra upgrade successfully went live on the Hoodi testnet after initial issues with Holesky and Sepolia.
Developers could decide on Pectra’s mainnet launch date in the ACDC call on Thursday.
ETH risks a sharp decline if it validates a developing bearish flag pattern.
Ethereum (ETH) is down 3% on Wednesday despite positive updates of the Pectra upgrade successfully going live on the Hoodi testnet. The top altcoin could sharply decline if it validates a bearish flag pattern by falling below $1,818.
Ethereum developers successfully activated the Pectra upgrade on the Hoodi testnet on Wednesday without experiencing any hiccups as of the time of writing.
Pectra could hit the Ethereum mainnet on April 25 if it continues running smoothly on Hoodi. Developers had earlier stated that Pectra will launch on mainnet at least 30 days after it goes live on Hoodi.
However, this will largely depend on the discussions and decisions of core developers in the Ethereum All Core Developers Consensus (ACDC) call on Thursday.
Testnets or test networks are environments to test or experiment on new features for a blockchain before deploying them on the mainnet.
The Hoodi testnet launched last Friday to enable developers to adequately test validator exits — opting out of consensus duties — due to issues with execution layer clients that prevented sufficient Pectra testing on Holesky and Sepolia testnets.
“Upgrades are always going to have their hiccups. If delaying the mainnet launch ensures Pectra’s success — it’s a worthwhile tradeoff,” Nick Johnson, founder of Ethereum Name Service, told FXStreet. “While some in the community may find Etheruem’s methodical approach frustrating, it’s a testament to the core developers’ commitment to quality over speed,” he added.
Pectra will introduce several features to improve Ethereum’s scalability, user experience and validator consolidation. Some of the major features include sponsored transactions, payment of gas fees in other ERC-20 tokens, transaction batching, wallet recovery, blobs per block increase and expanding the staking limit from 32 ETH to 2,048 ETH.
Ethereum saw $50.97 million in futures liquidations in the past 24 hours, per Coinglass data. The total amount of liquidated long and short futures positions accounted for $41.83 million and $9.14 million, respectively.
ETH saw a rejection at the $2,069 resistance and is testing the lower boundary of an ascending trendline. A decline below this trendline could see ETH test the support at $1,818.
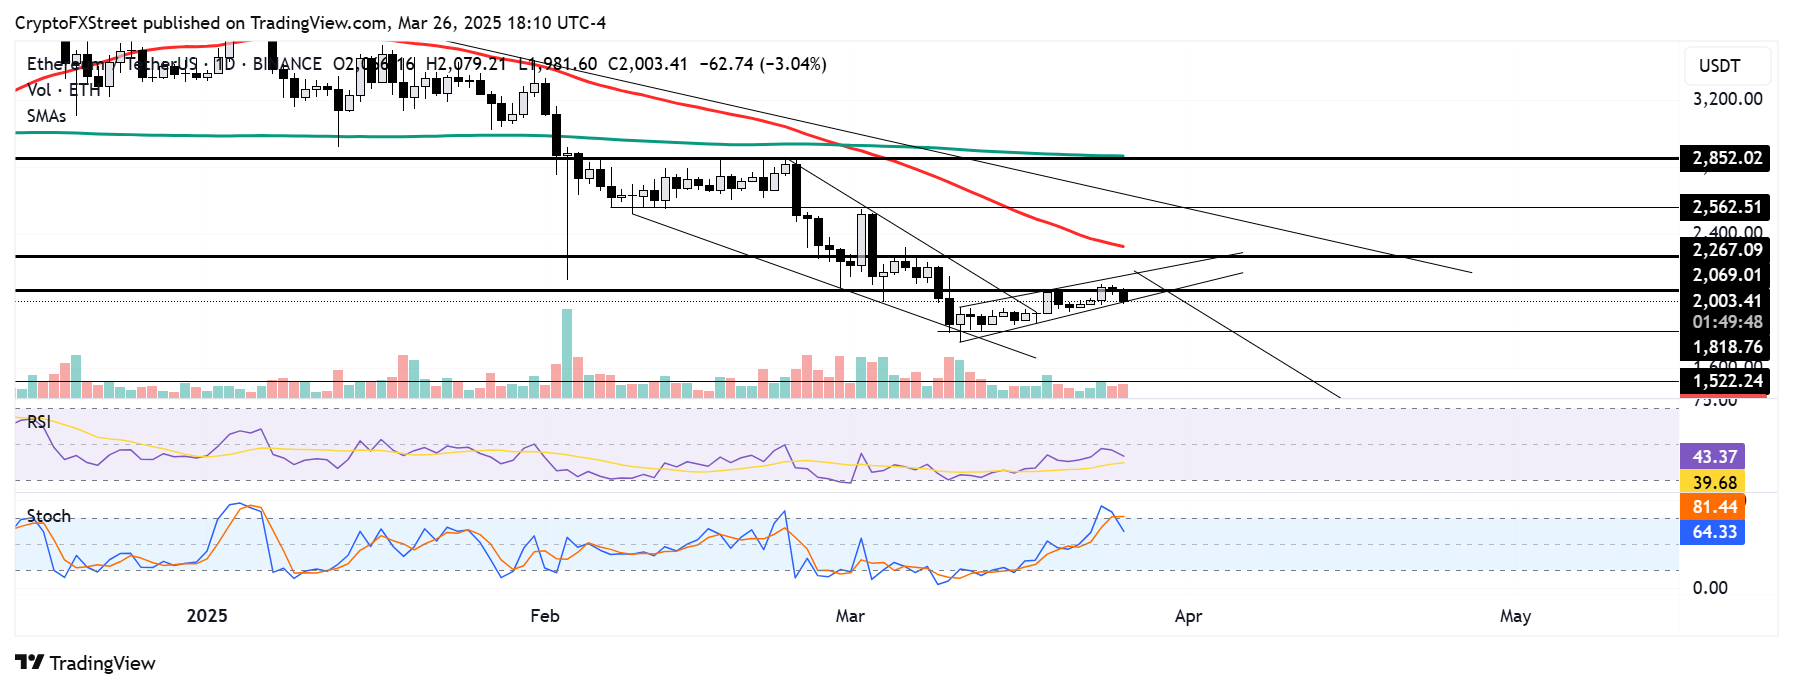
ETH/USDT daily chart
If ETH breaches $1,818, it would validate a bearish flag pattern, potentially sending its price below the $1,522 key level. A bearish flag pattern indicates the continuation of a downtrend.
The Relative Strength Index (RSI) is trending downward below its neutral level while the Stochastic Oscillator’s %K line crossed below its moving average line. This indicates a rising bearish pressure.
A firm daily candlestick close above the upper ascending trendline will invalidate the thesis and potentially spark an uptrend in ETH.
Search
RECENT PRESS RELEASES
Related Post

