Ethereum Price Forecast: ETH sees increased staking inflows following decline in leverage
May 12, 2025
- Ethereum’s rally is fueled by increased spot buying pressure rather than leverage trading following a decline in its leverage ratio.
- Ethereum’s Total Value Staked increased by over 180,000 ETH in the past week, signaling heightened bullish sentiment.
- After gaining 40% last week, ETH has to flip the 200-day SMA barrier to stretch its rally to test the $2,850 resistance.
Ethereum (ETH) is down 1% on Monday following increased inflows into staking protocols in the past week. The staking inflows come after sustained spot buying pressure pushed ETH to its largest weekly gain of 40% since December 2020.
Ethereum’s estimated leverage ratio (ELR) has been plunging since the beginning of May, decreasing from 0.75 to 0.69 on Monday. The ELR is obtained by dividing the open interest of exchanges by their coin reserve. The decline indicates ETH derivative traders aren’t using much leverage, meaning the price rise wasn’t leverage-driven.
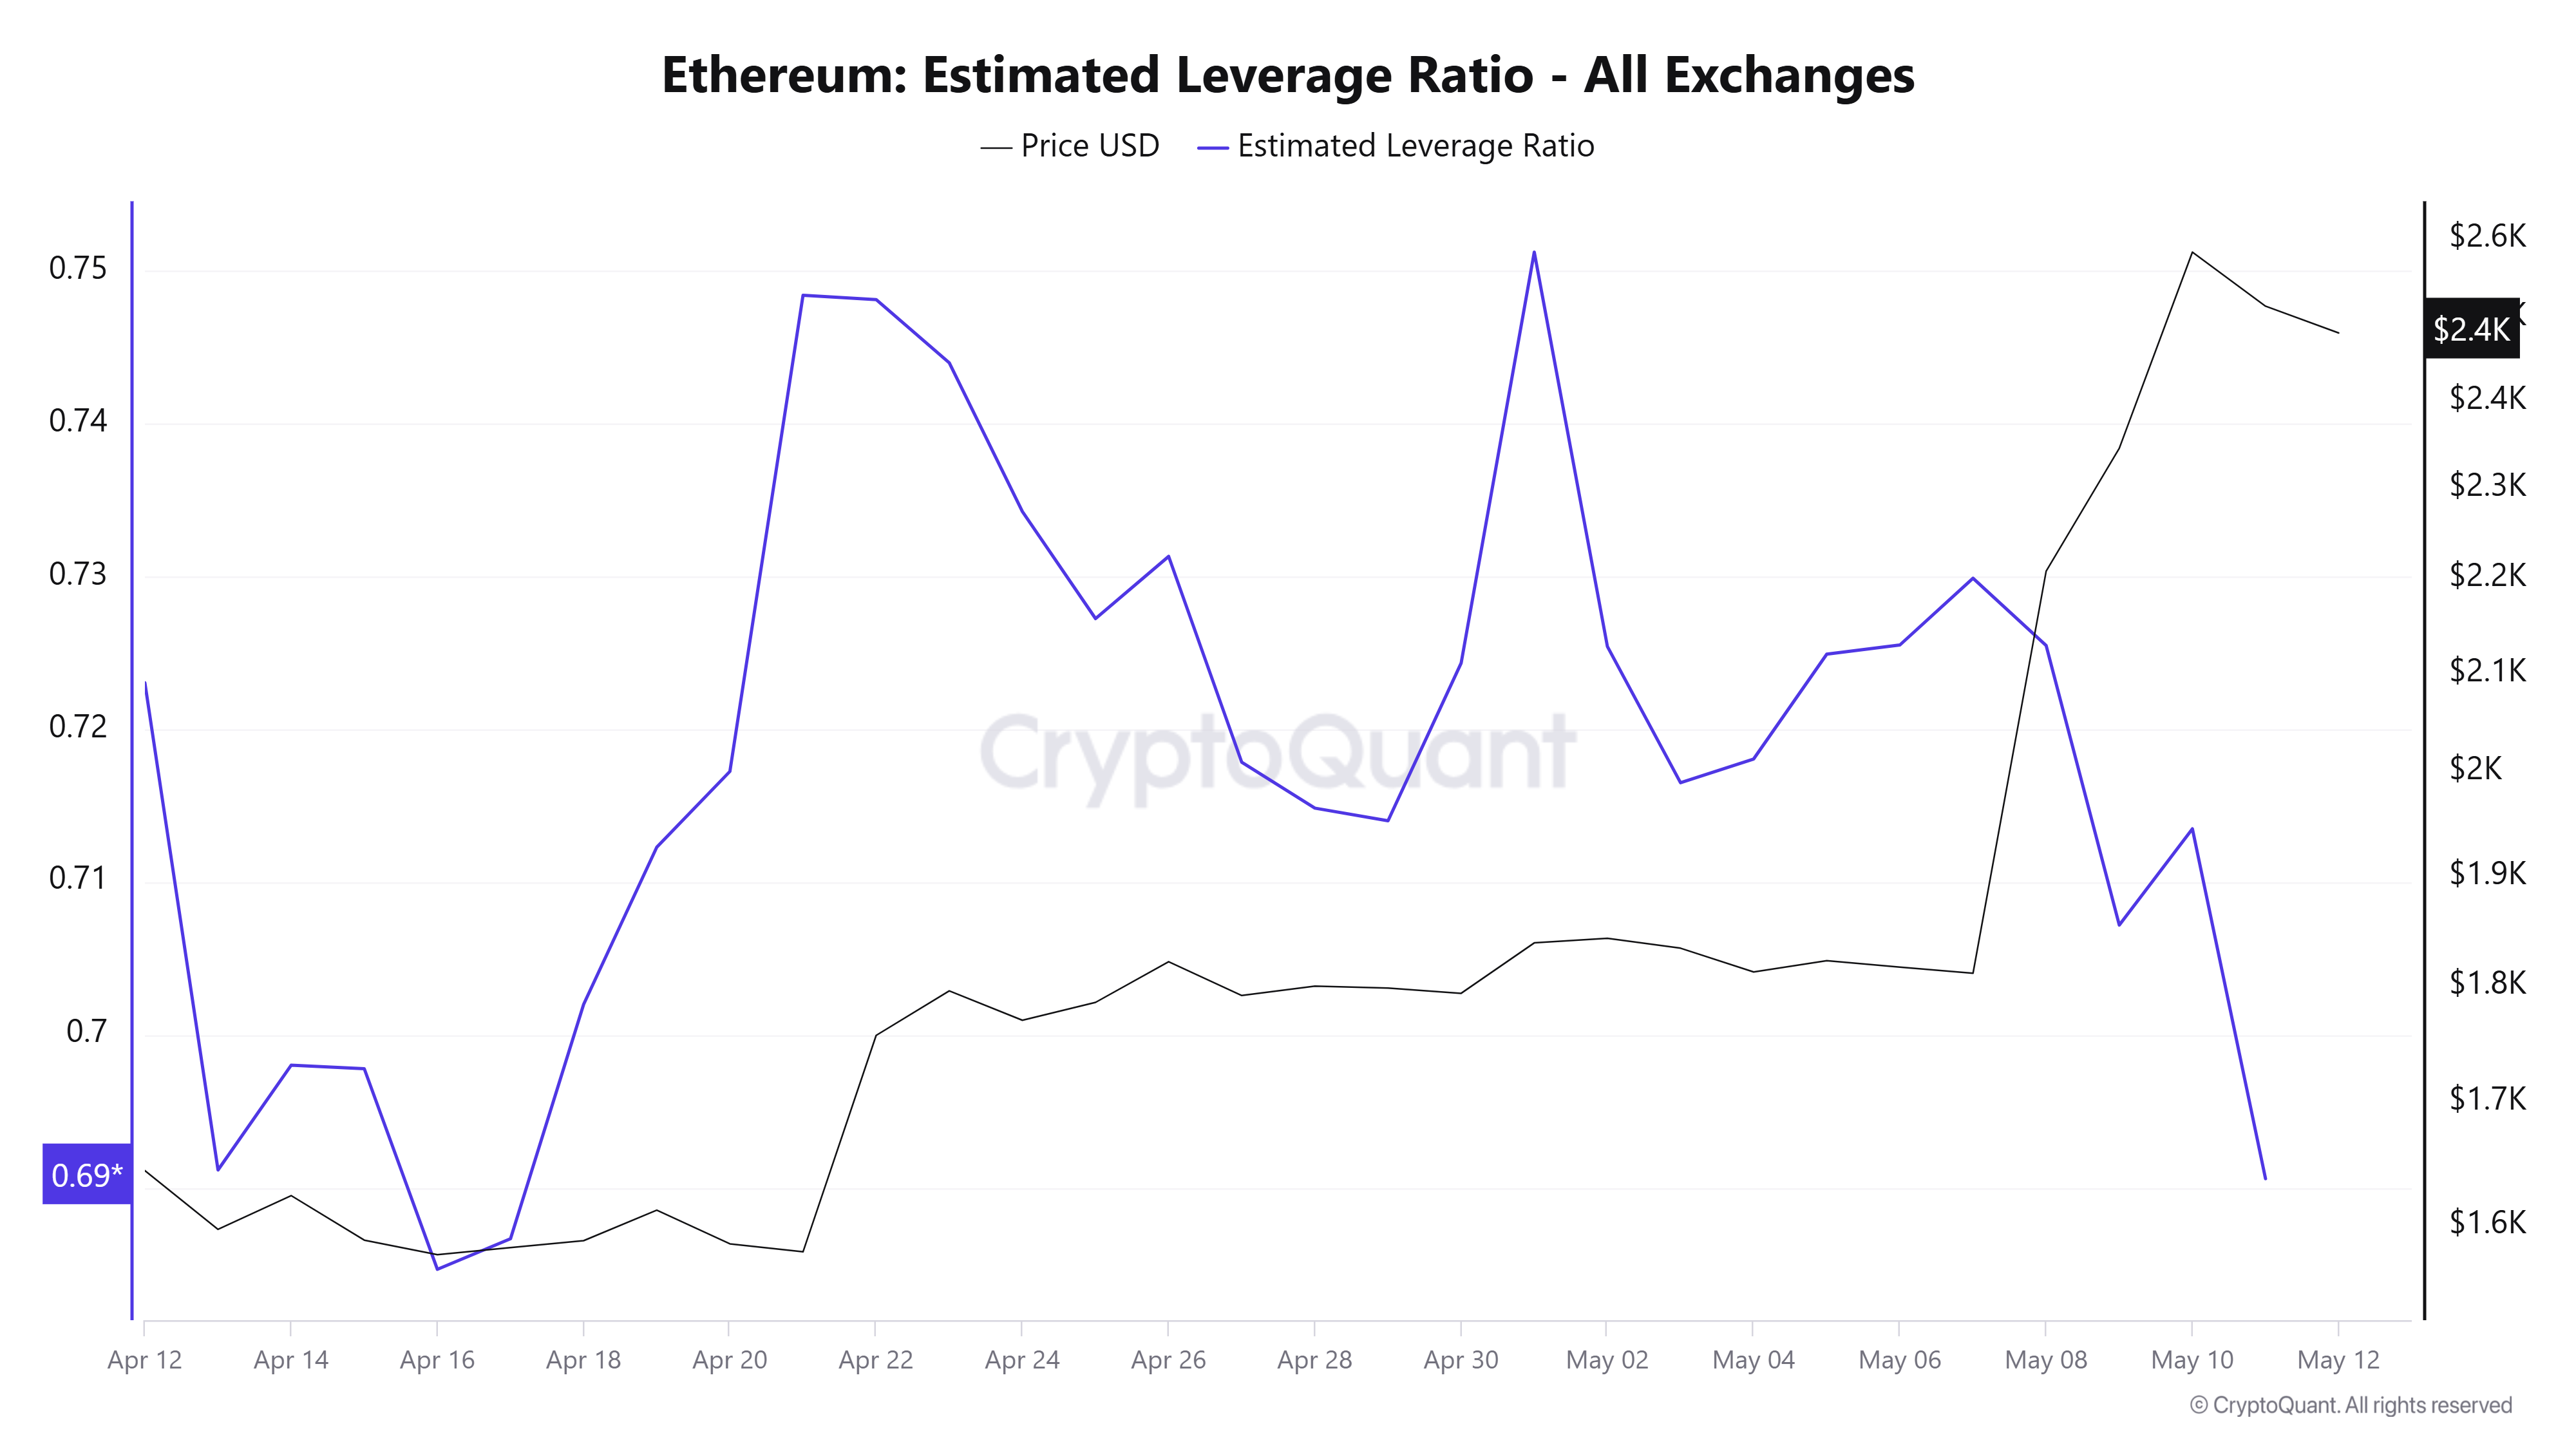
ETH Estimated Leverage Ratio. Source: CryptoQuant
The decline in leverage was accompanied by sustained spot buying pressure, where exchanges have seen net outflows of 323,700 ETH in the past four days. Most of the recent ETH outflows have flowed into staking protocols following a 180,000 ETH surge in Ethereum’s Total Value Staked in the past week. The rise in staked ETH suggests a preference toward long-term holding among investors.
-1747083754442.png)
ETH Total Value Staked. Source: CryptoQuant
The recent rally has also seen ETH’s price move above the average cost basis of all balance cohorts. It’s important to watch the cost basis of these investors if prices decline toward them, as it could provide support or lead to increased distribution.
Ethereum saw $166.89 million in futures liquidations in the past 24 hours, per Coinglass data. The total amount of long and short liquidations is $112.08 million and $54.81 million, respectively.
ETH recorded a 40% gain last week, surging from $1,800 to around $2,600 — its highest weekly gain since December 2020. After a three-day rally, the top altcoin saw a rejection near the 200-day Simple Moving Average (SMA), with bears aiming to hold the $2,544 resistance.
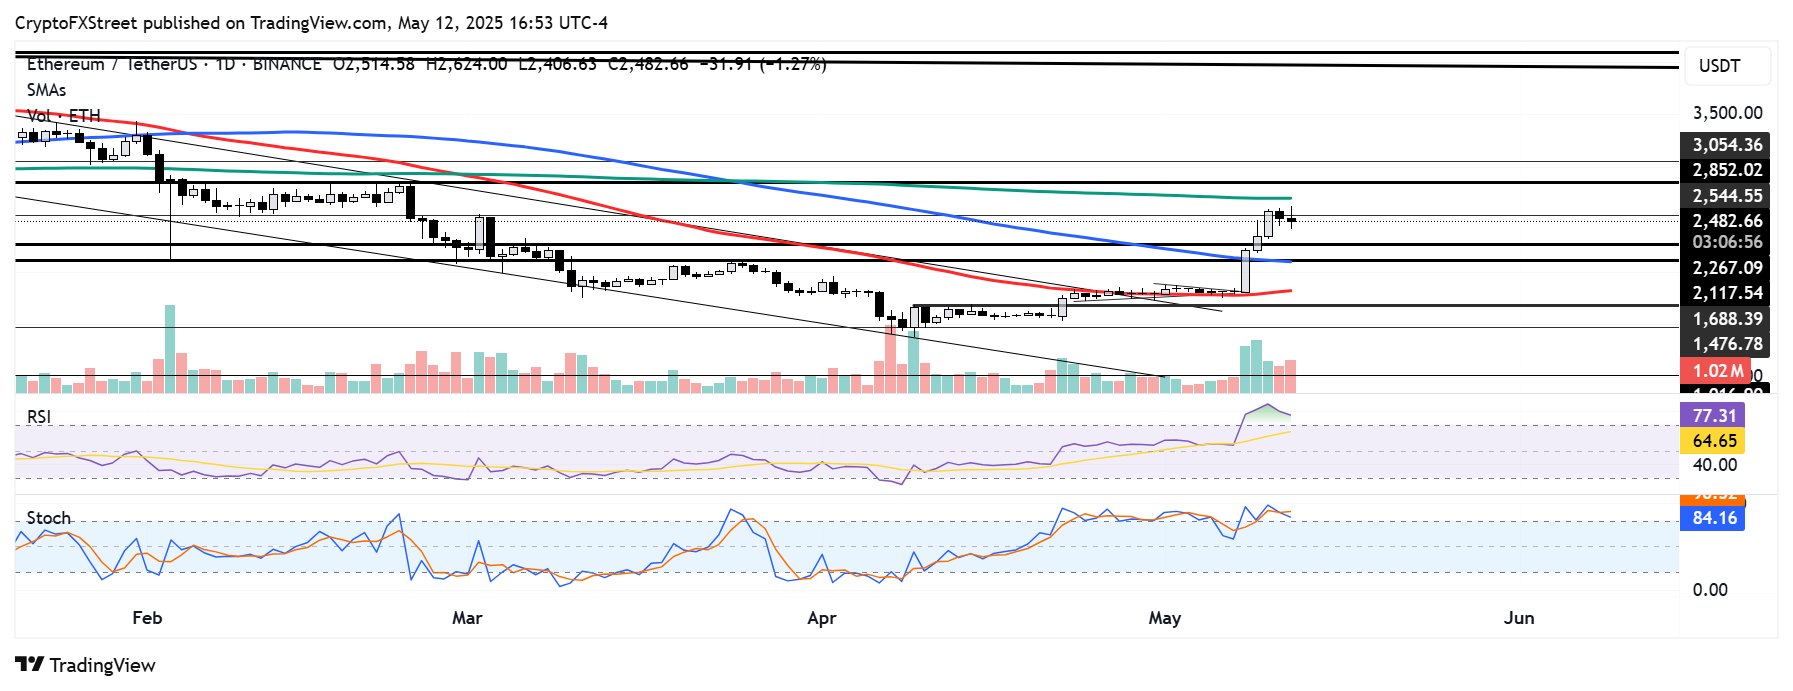
ETH/USDT daily chart
On the downside, ETH could find support between the $2,260 – $2,110 range, strengthened by the 100-day SMA. If ETH bounces off this support or quickly sees a recovery, it could post a bullish flag and stretch its rally to test the $2,850 key resistance level.
The Relative Strength Index (RSI) and Stochastic (Stoch) are in the overbought region, indicating heightened bullish momentum and a potential near-term correction.
A decline below the $2,260 – $2,110 range will invalidate the thesis and potentially send ETH toward the 50-day SMA support.
Share:
Cryptos feed
Information on these pages contains forward-looking statements that involve risks and uncertainties. Markets and instruments profiled on this page are for informational purposes only and should not in any way come across as a recommendation to buy or sell in these assets. You should do your own thorough research before making any investment decisions. FXStreet does not in any way guarantee that this information is free from mistakes, errors, or material misstatements. It also does not guarantee that this information is of a timely nature. Investing in Open Markets involves a great deal of risk, including the loss of all or a portion of your investment, as well as emotional distress. All risks, losses and costs associated with investing, including total loss of principal, are your responsibility. The views and opinions expressed in this article are those of the authors and do not necessarily reflect the official policy or position of FXStreet nor its advertisers. The author will not be held responsible for information that is found at the end of links posted on this page.
If not otherwise explicitly mentioned in the body of the article, at the time of writing, the author has no position in any stock mentioned in this article and no business relationship with any company mentioned. The author has not received compensation for writing this article, other than from FXStreet.
FXStreet and the author do not provide personalized recommendations. The author makes no representations as to the accuracy, completeness, or suitability of this information. FXStreet and the author will not be liable for any errors, omissions or any losses, injuries or damages arising from this information and its display or use. Errors and omissions excepted.
The author and FXStreet are not registered investment advisors and nothing in this article is intended to be investment advice.
Search
RECENT PRESS RELEASES
Related Post

