Ethereum Price Prediction: ETH Price Bounces from $2,650 Support and Forms Megaphone Patte
November 26, 2025
Technical formations, including a megaphone pattern and a contracting triangle, suggest that the digital asset could encounter resistance near $3,650 in the coming days, depending on market conditions.
The altcoin’s recovery follows several weeks of downward pressure, during which volatility increased across crypto markets. With easing short-term selling and institutional accumulation on-chain, Ethereum shows tentative stability. Traders and analysts are monitoring whether ETH can sustain momentum toward higher resistance levels in the near term.
Ethereum Price Rebounds After Strong Support
Using the daily ETH/USD chart on TradingView, Ethereum recently tested the $2,650–$2,750 zone, a support level that historically coincided with rebounds during the mid-2022 and mid-2023 market cycles. Support levels like this often indicate areas where buyers have previously stepped in, though past performance does not guarantee future outcomes.

Since 2016, periods when Ethereum’s (ETH) MVRV Z-Score falls below 0 have historically indicated optimal accumulation opportunities for investors. Source: Ali Martinez via X
“Ethereum’s bounce from $2,650 demonstrates resilience at a historically significant support level,” said Ali Martinez, an on-chain analyst who tracks Ethereum trends. “Indicators such as volume and recent candlestick patterns suggest that short-term momentum is gradually building for a possible upward move.”
Why this matters: Support levels provide traders with reference points for risk management and potential entry points. Monitoring volume and price action at these levels can help assess whether momentum is likely to continue.
Bullish Megaphone Pattern Signals Potential Upside
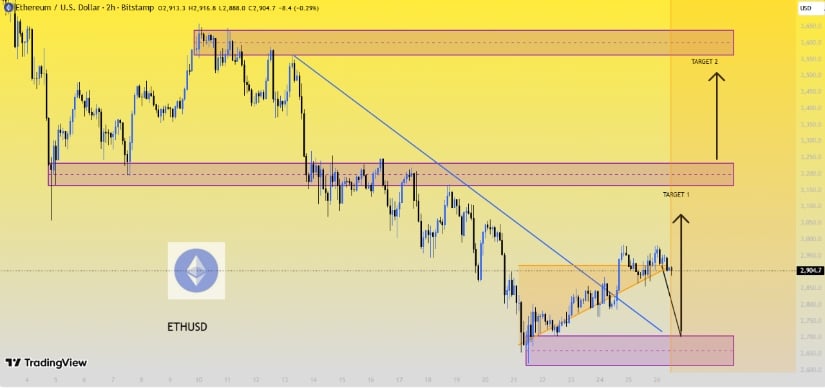
Ethereum’s charts show a bullish megaphone pattern, characterized by successively higher highs and higher lows. This formation often signals increasing volatility and the potential for upward breakouts, but it is not a certainty. Analysts also note a contracting triangle pattern on the same chart, which can precede continuation moves once the price breaks decisively from the structure.

Ethereum (ETH/USD) broke a descending trendline and consolidation, showing bullish momentum toward $3,250 and $3,650, supported by $2,650–$2,750 demand. Source: Harry Brook3 on TradingView
Based on 4-hour and daily timeframes, immediate technical targets for Ethereum are around $3,180–$3,250, with a secondary scenario reaching $3,550–$3,650 if momentum strengthens.
“Some market commentators express bullish sentiment on social platforms, though these views are speculative and based on short-term price movements rather than formal financial analysis,” said Gordon T., a crypto market analyst. “Such sentiment can influence short-term trading but should be interpreted cautiously.”
Key takeaway: Chart patterns like megaphones can indicate potential price ranges but are conditional, not predictive certainties. They should be considered alongside volume, RSI, and other technical indicators.
Institutional Confidence Supports Market Outlook
Institutional accumulation is an additional factor affecting the Ethereum price today. On-chain data from Etherscan and verified Ethereum treasury reports indicate that BitMine Immersion Technologies holds approximately 3.63 million ETH, representing about 3% of the circulating supply. While this figure comes from blockchain records rather than formal SEC filings, it provides a verifiable reference point for market participants.

BitMine Immersion Technology acquired 69,822 ETH (~$195M) last week, raising its total holdings to 3.63 million ETH, representing 3% of Ethereum’s circulating supply. Source: CoinMarketCap via X
The company has publicly indicated plans to stake part of its holdings on the MAVAN network in 2026. If implemented, this could reduce market liquidity and potentially support price levels, though these plans remain contingent on network and regulatory conditions.
“BitMine’s accumulation reflects confidence in Ethereum’s fundamental value, particularly in Layer-2 adoption and staking,” said Pradeep Chandravanshi, crypto market analyst. “Investors should consider these factors alongside broader macro conditions.”
Key Technical Levels to Monitor
Support Zones: $2,800–$2,900 are important short-term supports. A break below these levels on the daily charts could increase selling pressure.
Resistance Zones: $2,980–$3,000 is a psychological barrier, while $3,180–$3,250 is a first technical target. Extended bullish momentum could push Ethereum toward $3,550–$3,650.
Indicators: The Relative Strength Index (RSI) above 50 and the Stochastic Oscillator rebounding from oversold conditions suggest cautious optimism. These indicators provide context for momentum but do not guarantee price direction.
Why it matters: Understanding support, resistance, and momentum indicators helps traders set realistic targets and manage risk effectively.
Ethereum Price Prediction 2025
Based on historical patterns, technical formations, and verified institutional activity, Ethereum is positioned for potential short-term gains. However, analysts caution that macroeconomic factors, network upgrades, and regulatory developments remain significant risk factors.

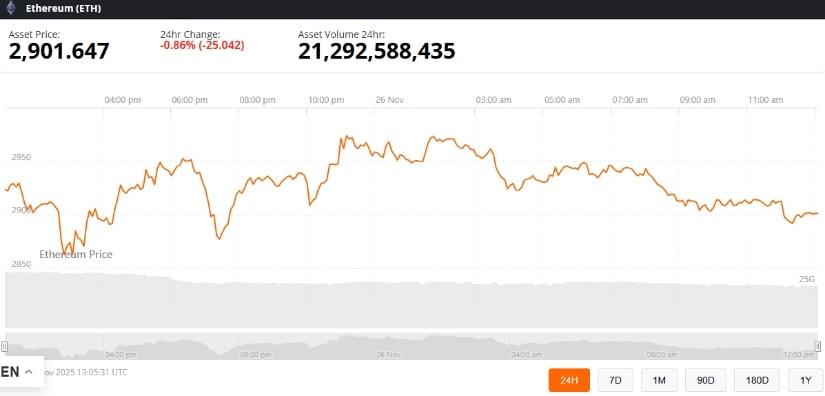
Ethereum was trading at around 2,901.64, down 0.86% in the last 24 hours at press time. Source: Ethereum price via Brave New Coin
Potential scenarios:
-
Bullish: Sustained momentum above $3,000 and support confirmation at $2,650 could see ETH approach $3,550–$3,650.
-
Bearish: Failure to maintain support could result in a retest of $2,800–$2,650, or lower, depending on broader market conditions.
Investors should monitor catalysts such as Ethereum ETF approvals, staking developments, and overall crypto market sentiment, as these factors will influence ETH price trajectories.
Final Thoughts
Ethereum’s recent rebound from $2,650, combined with the formation of a megaphone pattern and contracting triangle, highlights possible upside toward $3,650.
Verified institutional accumulation, cautiously positive technical indicators, and easing short-term selling pressure contribute to a neutral-to-bullish Ethereum price prediction for 2025. All scenarios remain conditional and should be interpreted alongside broader market and regulatory factors.
Search
RECENT PRESS RELEASES
Related Post


