Ethereum Price Prediction: ETH Price Confirms Bullish Pennant Breakout as Whales Add Over
December 10, 2025
This increase in deliberate accumulation, together with falling exchange reserves and improving network fundamentals, is influencing sentiment following several months of uneven trading. While analysts emphasize that no single indicator guarantees future performance, many note that Ethereum’s current structure resembles the early stages of previous recovery phases seen in earlier market cycles.
Whale Accumulation Tops 800,000 ETH Amid Strengthening Market Structure
Ethereum’s on-chain activity continues to draw interest as new data indicates notable accumulation among mid-sized and large holders. According to analytics platform Santiment, which tracks wallet cohorts and net flows using blockchain ledger data, wallets holding between 10,000 and 100,000 ETH added more than 800,000 ETH between mid-October and early December 2025. This figure reflects net accumulation across these addresses, based on aggregated wallet changes recorded during the period.
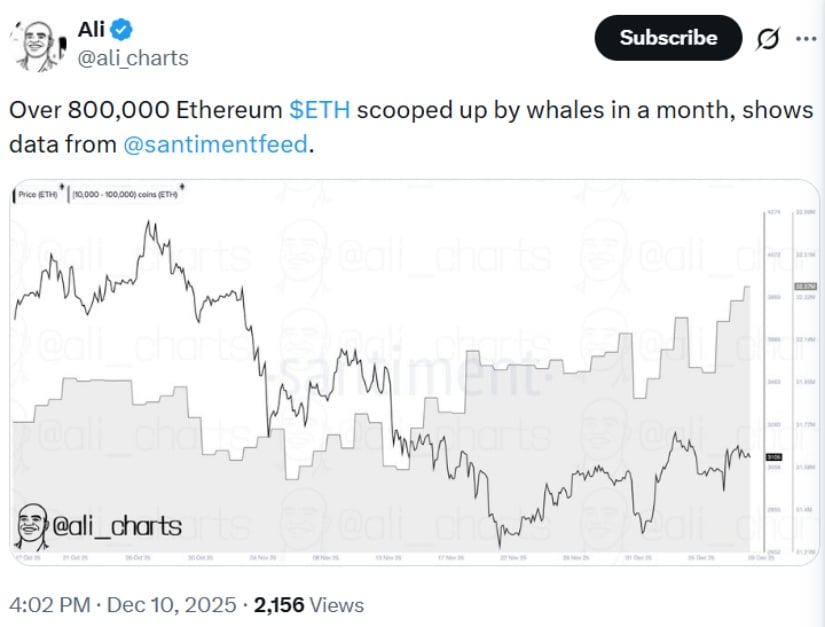
Whales accumulated over 800,000 Ethereum ($ETH) in a single month, according to Santiment data. Source: Ali Martinez via X
This occurred while the Ethereum price traded between $2,800 and $4,200, suggesting that certain sophisticated investors may have been positioning ahead of expected volatility. Santiment notes that similar wallet behavior emerged ahead of major moves in 2017 and 2021, though the firm acknowledges that historical patterns do not always repeat and can vary depending on broader market conditions.
“Mid-tier whales accumulating while retail exits have historically marked early phases of major Ethereum rallies,” Santiment researchers wrote, while cautioning that accumulation alone cannot predict outcomes without alignment from liquidity, macro conditions, and derivatives positioning.
Institutional participation also appears elevated, though it varies across categories. For instance, blockchain data shows that ETH staking rose about 5% during the same period, according to multiple staking dashboards that track validator growth. This uptick suggests more ETH is being locked in long-term protocols, reducing circulating supply. Still, analysts emphasize that “institutional demand” can refer to a mix of hedge funds, OTC desks, foundations, and corporates rather than a single identifiable group.
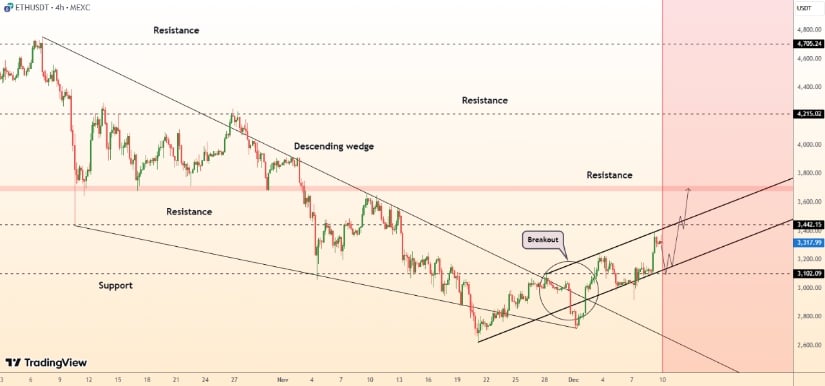
Bullish Pennant Breakout Sets Technical Target Near $3,700
Market attention sharpened after Ethereum broke above a bullish pennant on the 4-hour chart-a continuation pattern often associated with trend momentum. A pennant forms when price compresses between converging trendlines before breaking in the direction of the previous move.

Ethereum ($ETH) has broken out of a 4-hour bullish pennant, with a potential target near $3,700. Source: Trader Tardigrade via X
Crypto analyst Trader Tardigrade, who tracks pattern reliability and multi-timeframe signals, noted on X that the breakout projects a measured move toward $3,700, calculated by adding the pennant’s pole height (approximately $500) to the breakout zone near $3,200.
Technical pattern studies show mixed reliability, with pennants performing well in trending markets but less consistently during high-volatility or macro-driven periods. As of December 10, 2025, the current ETH price stands near $3,320, reflecting improved sentiment but still sensitive to broader risk conditions.
Exchange Reserves Fall to 8.6%, Signaling a Supply Shift
One of the more significant structural developments is the decline in available ETH on trading platforms. Data from CryptoQuant, a widely referenced provider using exchange-reported wallets to track inventory levels, shows that ETH balances on centralized exchanges have fallen to 8.6% of total supply – the lowest share since Ethereum began trading publicly in 2015.
This means that approximately 10.5 million ETH remain on exchanges out of roughly 120.7 million ETH in circulation. The trend accelerated following the Fusaka upgrade on December 3, which improved transaction efficiency and reportedly encouraged more holders to transfer assets into private wallets or staking mechanisms.
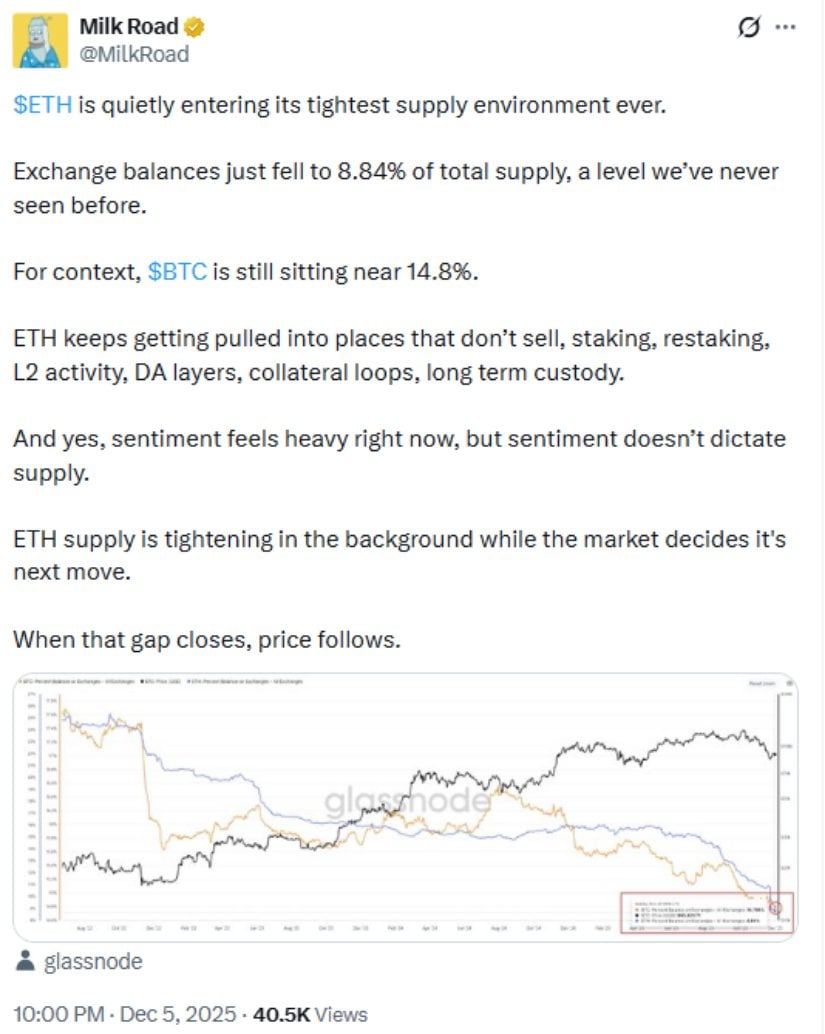
Ethereum ($ETH) is at its tightest supply ever, with only 8.84% on exchanges, as staking, L2 activity, and long-term custody remove coins from circulation despite cautious market sentiment. Source: Milk Road via X
Additionally, blockchain records show that Bitmine, a mining and infrastructure company, executed a $435 million ETH acquisition earlier in the quarter. Public wallet data suggests this holding represents slightly more than 3% of all ETH, though this figure may fluctuate due to market valuation updates. Analysts stress the importance of treating these concentration estimates as approximate, since corporate holdings can span multiple wallets.
Shrinking exchange supplies often correlate with reduced immediate sell-side liquidity. While not inherently bullish on their own, they can amplify price reactions during high-demand periods. Market observers also note that improving network efficiency-reflected in stabilizing Ethereum gas fees-has contributed to growing on-chain activity.
Ethereum Breaks Key Resistance as Technical Trend Strengthens
Ethereum’s reclaiming of the $3,100 resistance level marks a notable shift after weeks of consolidation. As of recent data, ETH trades around $3,325, recovering from its Q3 lows and lifting its market capitalization to roughly $401 billion.
Price structure has improved across multiple time frames. Ethereum recently broke out of a multi-week descending wedge, a structure that often precedes relief rallies, and is now trending within an ascending channel. Rising swing lows suggest accumulating demand, though analysts caution that trend continuation depends on maintaining key support levels.
Ethereum ($ETH) breaks into an ascending channel, holding $3,200 support, with momentum and ETF inflows pointing toward $3,450–$3,780. Source: DeGRAM on TradingView
If ETH holds above $3,200, technical models highlight $3,450 to $3,780 as possible resistance zones. A close above $3,400, which aligns with the 50-day moving average, would strengthen the bullish outlook. Conversely, if support at $3,100 breaks, the Ethereum price could revisit $2,900, with deeper levels at $2,750–$2,500 acting as potential stabilization zones.
Market strategists note that regulatory updates, funding rate shifts, or macroeconomic changes could also influence near-term movement – factors that remain outside chart-based models.
Fair Value Gaps Suggest Possible Pullback Before Continuation
Some technical frameworks point to the possibility of a short-term retracement before further upside. Analysts using Fair Value Gap (FVG) methodology – a concept describing price zones where rapid movement left limited transactional activity – identify a key support region between $2,850 and $3,000.
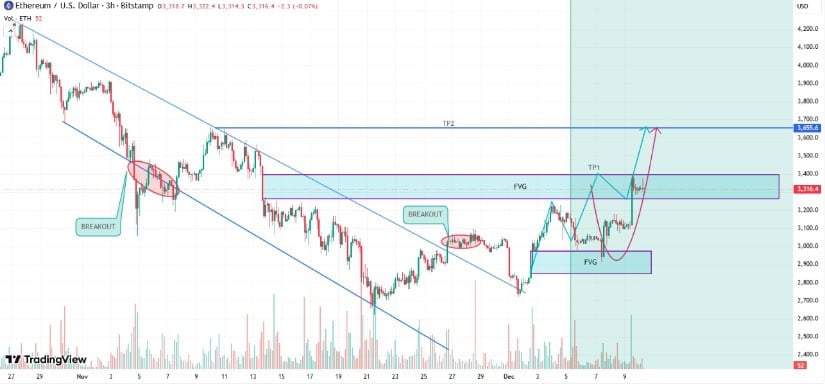
Ethereum ($ETH) has broken out of a downtrend channel, holding $2,850–$3,000 support, with potential targets of $3,400 and $3,650–$3,700 if bullish momentum continues. Source: Arthur_FXMaster on TradingView
FVGs often act as magnet zones where price returns to “rebalance” liquidity. A pullback toward this lower region would not necessarily invalidate the broader trend and could offer a healthier setup for continuation, depending on market conditions.
Above current levels, an upper FVG between $3,200 and $3,350 forms the next zone of supply. Clearing this area with meaningful volume would align with higher targets around $3,400 and later $3,650–$3,700, consistent with the earlier pennant analysis.
However, analysts warn that these are scenario-based projections, not certainties. If exchange outflows slow, whale accumulation reverses, or macro sentiment weakens, the setup could deteriorate quickly. This risk-oriented context is essential for interpreting any Ethereum price prediction.
Final Thoughts
While Ethereum’s current conditions show several supportive indicators – reduced exchange supply, increased staking, whale participation, and improving technical momentum-market specialists stress that the cryptocurrency remains sensitive to broader economic factors and regulatory changes. The alignment of these signals presents a constructive environment, but not a guaranteed trajectory.
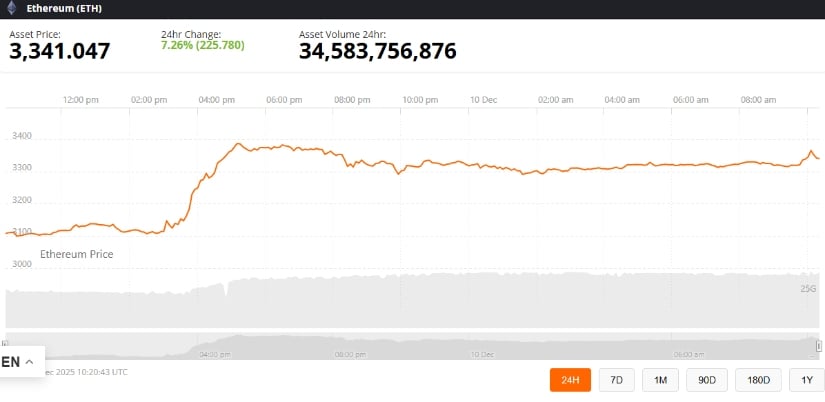
Ethereum was trading at around 3,341.04, up 7.26% in the last 24 hours at press time. Source: Ethereum price via Brave New Coin
Understanding both the opportunities and the limitations of technical and on-chain metrics helps maintain realistic expectations, aligning with a balanced, evidence-based approach to digital asset analysis.
Search
RECENT PRESS RELEASES
Related Post


