Ethereum Price Prediction: ETH Price Faces $2,500 Risk Amid Wave 2 Correction, But Long-Te
November 21, 2025
Based on Ethereum’s historical correction patterns and recent on-chain activity, the current market structure aligns with a broader Wave 2 retracement—one that typically precedes strong medium-term trend continuations. Despite intensified selling pressure, institutional interest and improving ETF-related flows continue to provide stability beneath the surface.
Ethereum Price Slides Below $2,800
As of November 21, 2025, Ethereum trades near $2,845 following a 10% weekly decline. According to liquidation dashboards from Coinglass, the market saw over $950 million in leveraged liquidations during the downturn, amplifying short-term volatility across major altcoins.
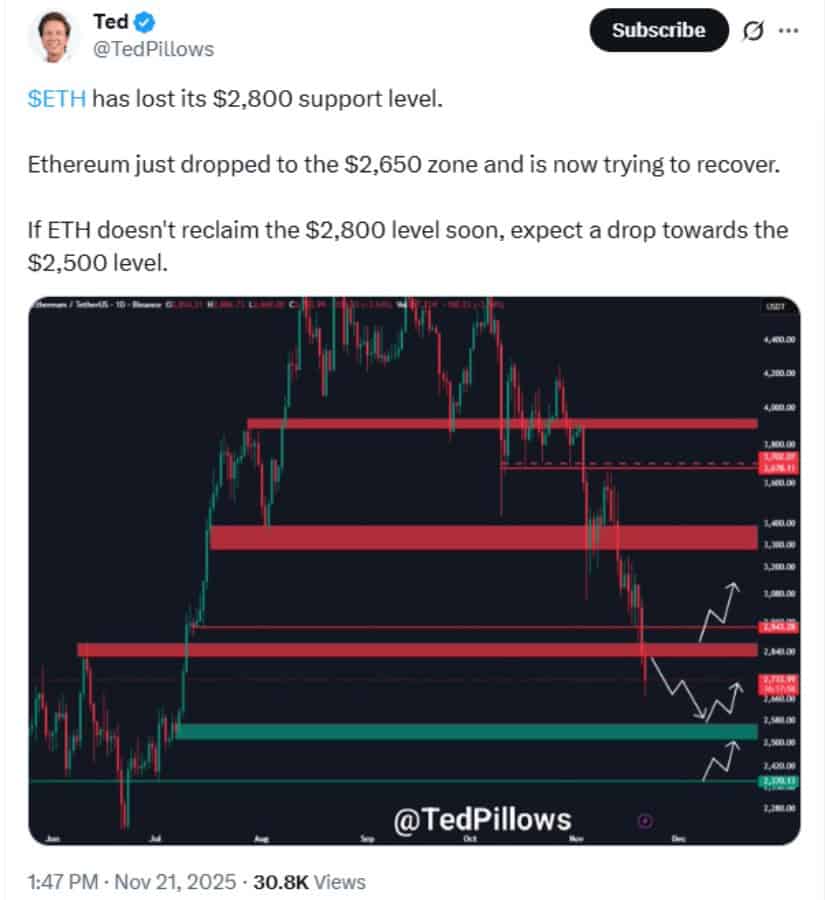
Ethereum has lost its $2,800 support, and after dipping to $2,650, it must reclaim that level soon to avoid a potential decline toward $2,500. Source: Ted via X
ETH recently breached the key $2,800 support, dipping to $2,650—a move that historically increases the likelihood of another 5–10% downside unless the price reclaims lost territory quickly. A trader known for volume-based analysis remarked that if ETH remains below $2,800, “it risks drifting toward the $2,500 demand zone amid fading spot momentum.” Their view represents broader market sentiment rather than a definitive prediction.
Technical indicators, including declining volume and weakening market breadth, support caution in the immediate term. Past cycles show that once ETH loses a major support cluster, price often consolidates or retests lower levels before recovery.
Wave 2 Correction Underway
Ethereum’s structure resembles a Wave 2 pullback within Elliott Wave theory—a model commonly used for trend mapping rather than precise forecasting.
A market analyst specializing in wave-based analysis noted that the breach of Wave 1 territory places ETH near the 0.618 Fibonacci retracement level around $2,748, which historically serves as a pivot zone for trend continuation.
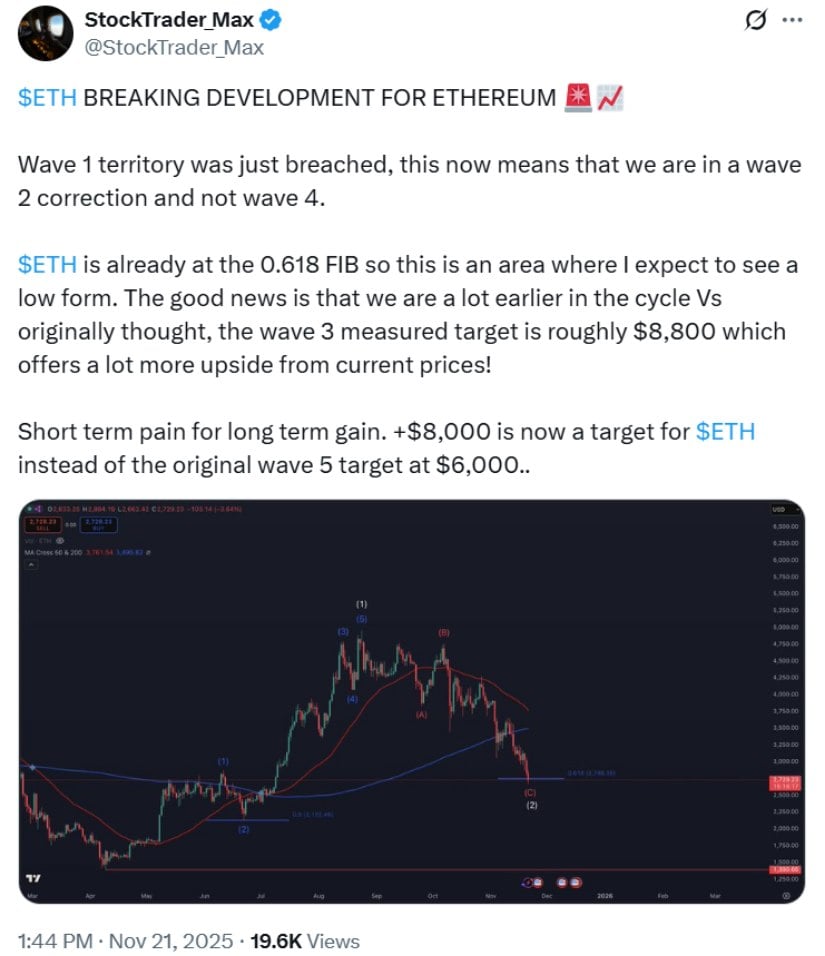
Ethereum has entered a Wave 2 correction at the 0.618 Fib level, signaling short-term weakness but raising the long-term target to around $8,800. Source: StockTrader Max via X
Wave 3 projections occasionally extend toward higher targets such as $8,000–$9,000, but these scenarios rely heavily on favorable macro conditions, sustained ETF inflows, and strengthening network activity. Such targets are hypothetical and should be viewed as long-range possibilities rather than expectations.
Technical Analysis and Key Support Levels
Drawing from prior ETH correction structures this year, several support and resistance zones continue to shape short-term sentiment:
- $2,830–$2,900: Immediate resistance is now acting as the first reclaim target.
- $2,681: A notable liquidity zone tested in past corrections.
- $2,606: A deeper support area aligned with the current downward momentum.

ETH long from $2,810, targeting $2,970, but all positions were manually closed at $2,740; the plan included adding more longs if the price dropped to $2,750. Source: salahuddin20041 on TradingView
Indicators such as RSI show near-oversold conditions, suggesting potential interest from long-term holders. Candlestick formations on the daily chart also reflect declining selling pressure, hinting at possible stabilization if volume returns.
These levels matter because they represent historical reaction ranges where institutional desks, high-volume traders, and liquidity providers have previously repositioned.
Whale Activity and Institutional Influence
On-chain data from Glassnode and IntoTheBlock shows that accumulation by large ETH holders slowed as prices dipped below $3,000. Addresses holding 1–10 million ETH have reduced activity, confirming reduced confidence in short-term price strength.
The MVRV long/short ratio recently touched a four-month low, indicating weakening profitability among long-term holders—a condition that often precedes either capitulation or fresh accumulation.
However, institutional demand remains a key long-term driver. Early ETF flow data from CoinShares implies steady capital rotation into ETH-related products, even during price drawdowns. Regulatory developments surrounding U.S. and Asian ETH ETF approvals continue to shape expectations for 2026, offering a structural foundation for future upside.
Short-Term Outlook and Trading Opportunities
Rather than offering explicit trading instructions, it’s helpful to understand how traders typically navigate correction phases.
Some traders use layered entry strategies during volatile pullbacks, using zones such as the $3,200–$3,000 range as reference points, depending on risk tolerance and timeframe. These are not signals but illustrate how market participants position themselves during uncertainty.
Correlation with assets like Bitcoin and Solana also influences Ethereum’s near-term direction. If Bitcoin struggles to reclaim key resistance, altcoins—including ETH—often experience extended consolidation or deeper retracements.
Long-Term Forecast: Bullish Potential Remains
Despite short-term instability, several long-term signals remain constructive:
- Accumulation in spot markets indicates that long-horizon investors are absorbing liquidation-driven sell pressure.
- Fibonacci and volume profile convergence around $2,880 suggests a multi-month demand zone.
- Analysts project medium-term targets near $3,800 and $4,400, with potential for a broader move toward $5,100 if macro conditions improve and ETF demand strengthens.
Ethereum is bearish, testing key support near $2,880, with potential downside to $2,200 if strength above $3,170 isn’t regained. Source: The-Thief on TradingView
These projections depend on several variables, including market liquidity, regulatory clarity, L2 adoption, and staking activity. However, the bullish outlook becomes invalidated if Ethereum sustains levels below $2,470, a historically significant structural support.
Final Thoughts
Ethereum continues to face pressure as the loss of $2,800 exposes short-term vulnerability down to $2,500. Technical data, whale behavior, and market structure all point to a cautious near-term environment.
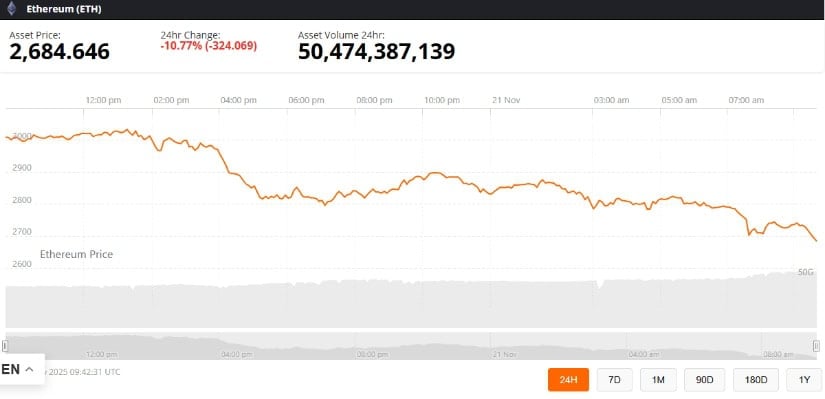
Ethereum was trading at around 2,684.64, down 10.77% in the last 24 hours at press time. Source: Ethereum price via Brave New Coin
Even so, institutional interest, improving ETF participation, and multi-year trend structures support a constructive long-term outlook. Investors and analysts will be watching Ethereum’s price action, reclaim levels, and macro developments closely as the market digests this Wave 2 correction.
Search
RECENT PRESS RELEASES

