Ethereum Price Prediction: ETH Price Tests Key $3,000 Support Could Spur Short-Term Rally
November 20, 2025
Ethereum (ETH) is showing signs of resilience as it stabilizes near the $3,000 support zone, which has historically acted as a pivot for price reversals.
If this level continues to hold, ETH could experience renewed upward momentum toward $3,300–$3,400, though several risk factors could alter this trajectory.
Traders and investors are closely monitoring Ethereum’s price action after the asset declined by approximately 1.4% over the past 24 hours, currently trading at around $3,024. The $3,000–$3,050 zone aligns with the Fibonacci Golden Pocket, a technical area that has previously coincided with both short-term corrections and subsequent bullish reversals.
Past reactions—such as the rebounds in March and August 2025—illustrate that buyers often step in near this level, supporting the idea that momentum could remain intact if market liquidity remains favorable.
Technical Indicators: Signals and Context
Ethereum’s technical setup presents mixed but cautiously bullish signals. On the daily ETH/BTC chart, a consolidation resembling a bull flag is forming, with the Relative Strength Index (RSI) recently climbing above 50, signaling a reduction in near-term bearish pressure. The MACD histogram also moved into positive territory, suggesting that momentum may be building.
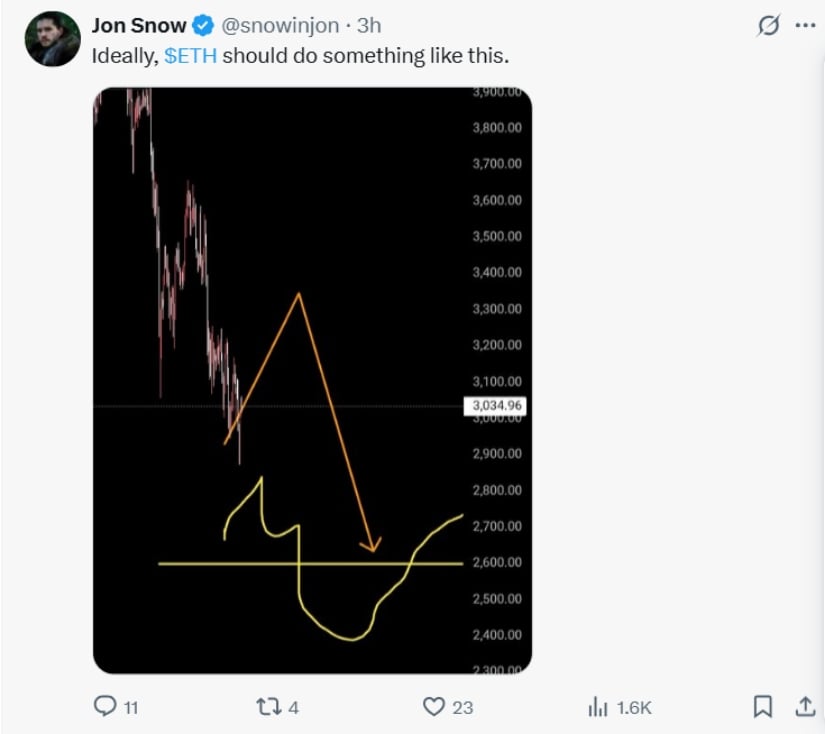
As of November 20, 2025, ETH trades around $3,045, with technical analysis and trader consensus projecting a short-term rally to $3,300–$3,400 before a potential corrective drop to $2,600. Source: Jon Snow via X
It is important to contextualize these indicators: while RSI and MACD breakouts can highlight early bullish momentum, their reliability depends on broader market conditions. In this case, the current macro environment—characterized by moderate liquidity and relative stability in major cryptocurrencies—adds some weight to these signals, but they are not guarantees of upward movement.
A projection from a professional cryptocurrency trader suggested that ETH could climb from $3,045 toward $3,300 before a corrective pullback to around $2,600. While illustrative of a possible short-term path, this projection should be considered alongside broader market data, including aggregated trading volume and on-chain metrics, rather than relying solely on one individual forecast.
Chart Patterns: Falling Wedge Analysis
ETH/USD is forming a falling wedge pattern, typically observed toward the end of corrective phases. Historically, falling wedges can precede breakouts, but analysts caution that their success rate is not absolute. For instance, similar wedges in July and September 2025 showed partial breakouts but also experienced failed follow-through due to macro-driven sell pressure.
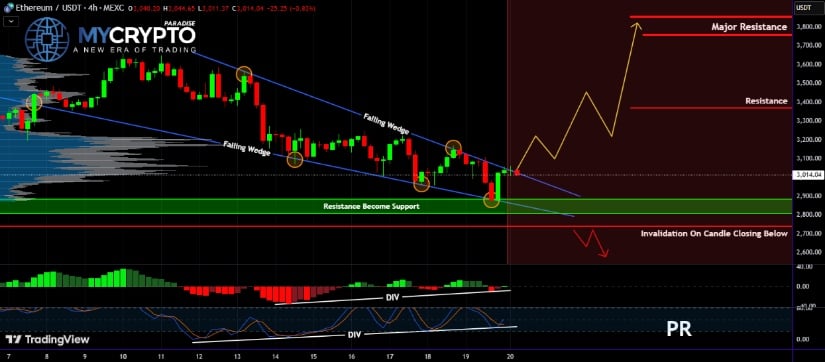
ETH/USD is forming a falling wedge with bullish divergences, signaling potential upside if it breaks out, while a drop below the invalidation level would negate the bullish setup. Source: MyCryptoParadise on TradingView
Indicators such as the Stochastic RSI are showing bullish divergence, which suggests weakening short-term bearish momentum. For traders, this means that while early signs favor buyers, confirmation through a decisive breakout above the wedge resistance—around $3,100—is advisable before committing to larger positions. Conversely, a breakdown below $2,950 would signal a potential pause in the bullish trend and warrant caution.
Risk Factors and Market Considerations
While technical analysis points to a possible rally, several factors could temper upward movement:
-
ETH/BTC ratio: Ethereum could underperform relative to Bitcoin if BTC strengthens, even if ETH maintains nominal gains.
-
Macro liquidity: Broader crypto market liquidity and leverage levels can amplify volatility, making short-term predictions less certain.
-
Network fundamentals: Developments in Ethereum’s ecosystem, such as Aave, Uniswap, and Lido initiatives, provide long-term confidence but may not immediately impact price.
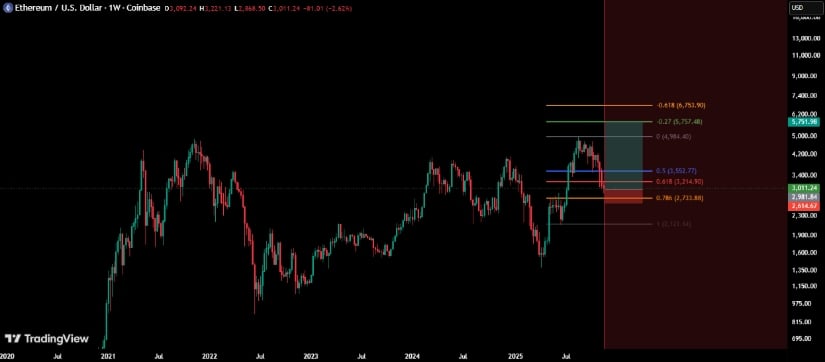
The market remains bullish on daily and weekly charts, with potential for further gains if current support holds, though trading carries high risk and requires caution. Source: WiLLProsperForex on TradingView
For short-term traders, holding above $3,000 helps maintain momentum, whereas long-term investors may benefit more from monitoring weekly trend structure and ecosystem developments. This distinction ensures actionable insight for different market participants.
Final Thoughts
Ethereum’s current consolidation above $3,000 demonstrates resilience and suggests a cautious bullish potential.
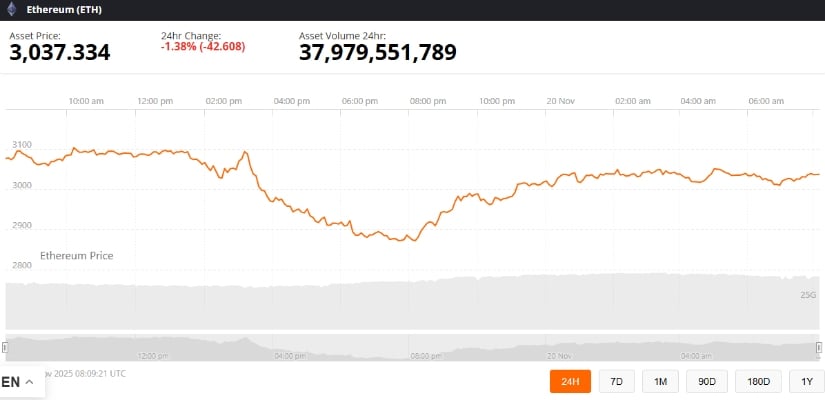
Ethereum was trading at around 3,037.33, down 1.38% in the last 24 hours at press time. Source: Ethereum price via Brave New Coin
While technical patterns and early indicators point toward a possible test of $3,300–$3,400, risks remain, including support breakdowns and macro-driven volatility. Market participants are advised to interpret signals in context, consider risk management strategies, and balance short-term technical setups with longer-term fundamentals.
Search
RECENT PRESS RELEASES
Related Post


