Ethereum Price Prediction: Whale Accumulation and ETF Inflows Strengthen Bullish Case—Can
December 13, 2025
Recent Ethereum price activity shows the asset stabilizing above key support zones after a period of choppy trading. Analysis of on-chain flows, derivatives exposure, and volume patterns indicates that downside pressure may have eased, positioning ETH for a potential move toward higher resistance levels if these support levels remain defended.
Golden Signal Highlights Growing Whale Participation
A key technical indicator gaining attention is Bryant’s so-called “golden signal,” which tracks relative changes in large-holder volume against price. This metric aims to highlight when whales—investors holding significant amounts of ETH—are accumulating in ways that historically precede trend reversals.
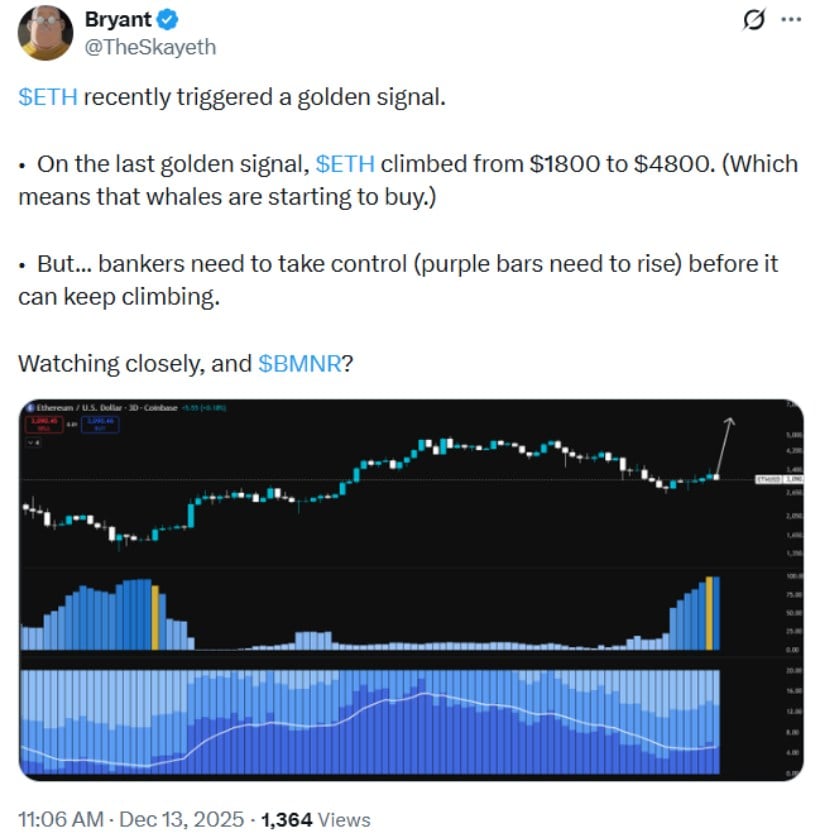
Ethereum (ETH) recently triggered a “golden signal,” indicating whale accumulation, though further gains may require increased institutional involvement. Source: Bryant via X
“On the last golden signal, ETH climbed from $1,800 to $4,800,” Bryant noted, underscoring past precedent. However, the signal is not a precise timing tool and can lag during sideways or range-bound markets.
Based on publicly available on-chain data, large ETH holders near the $3,000 mark have been steadily increasing their net holdings. This suggests that recent dips have been absorbed rather than triggering broad liquidation—a pattern consistent with defensive accumulation rather than speculative frenzy.
Interpretation: While the golden signal signals potential bullish momentum, sustained upward moves would likely require concurrent institutional participation and macro support.
ETF Inflows Mark a Shift in Institutional Sentiment
Institutional interest, particularly via Ethereum ETFs, has also shifted recently. Data from CoinMarketCap shows that spot Ethereum ETFs recorded net inflows of over $250 million in the past week, reversing prior outflows.
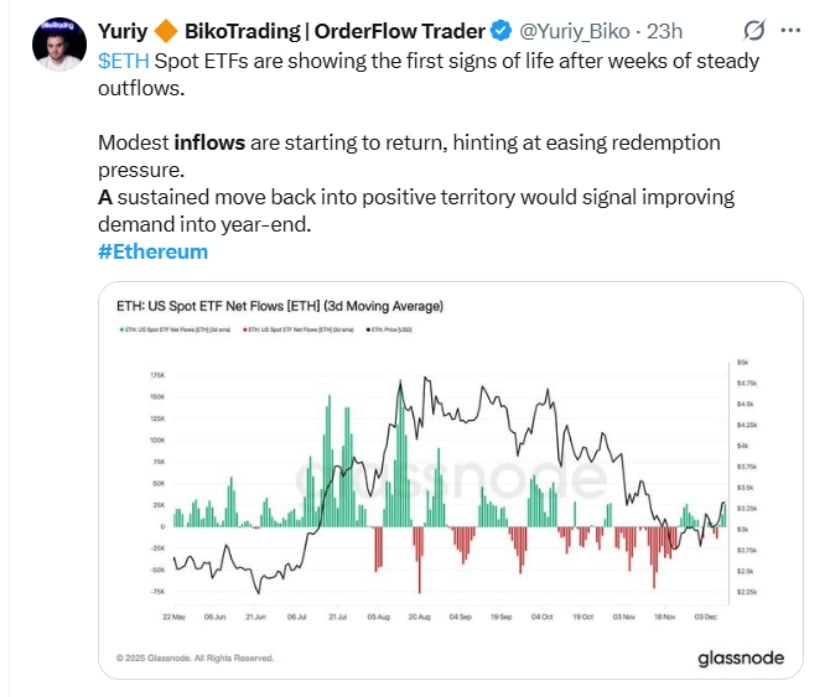
ETH spot ETFs are beginning to see modest inflows after weeks of outflows, suggesting easing redemption pressure and potential strengthening demand toward year-end. Source: Yuriy Biko Trading | Order via X
Notably, BlackRock’s Ethereum ETF contributed approximately $56.5 million in a single session. ETF inflows can increase spot demand, but their actual impact depends on broader market positioning, including derivatives hedging and risk sentiment.
Analysis: The convergence of ETF inflows and on-chain accumulation creates a zone near $3,100 where buying interest is materially higher, supporting short-term price stability. However, inflows alone do not guarantee sustained price increases, and investors should monitor liquidity trends and market depth.
Large Holders Accumulate Both Spot and Derivatives
On-chain distribution analysis shows wallets holding between 10,000 and 100,000 ETH increased their net holdings by roughly 800,000 ETH over the past month, valued at nearly $2.4 billion at average entry prices around $3,100.
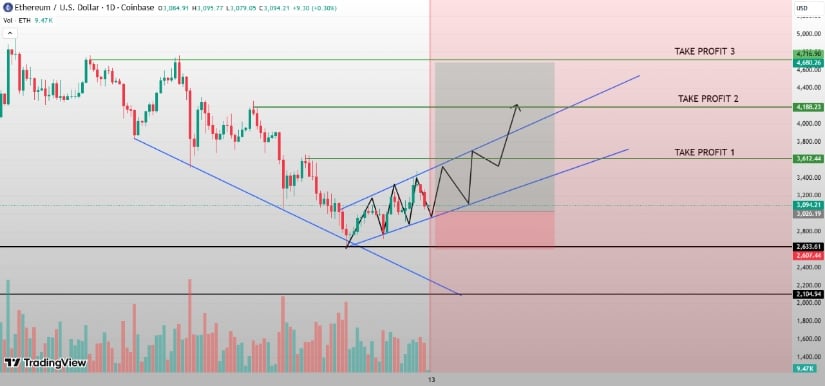
Ethereum (ETH) trades within an ascending channel, supported near $2,634, with potential targets at $3,612, $4,188, and $4,717, while a breakout above the channel could extend gains. Source: Gold_Dominator on TradingView
In the derivatives market, high-profile leveraged positions reinforce this accumulation. For instance, certain large traders have maintained significant long positions with liquidation levels well below current prices, indicating confidence in defended support zones.
Interpretation: The combined spot and derivatives exposure suggests that dips toward the $3,000–$3,100 range have been actively absorbed. Traders and investors may consider this as a conditional indicator of short-term support rather than a guaranteed price floor.
Ethereum Technical Analysis Shows Improving Structure
From a chart perspective, Ethereum remains in an ascending channel with higher lows and repeated defenses near $2,800–$2,900. The structure indicates that sellers have struggled to assert control over the market.
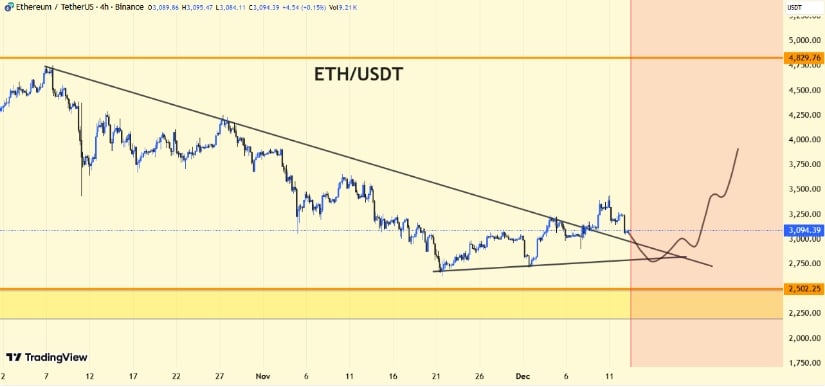
Ethereum (ETH) holds above $2,800 support, eyeing $3,300–$3,600, but a 4-hour close below $2,500 could trigger further downside. Source: CryptoSanders9563 on TradingView
A potential bearish pattern—a flag on the 12-hour chart identified by some analysts—warns that failure to hold the $3,100 support could lead to a move toward $2,400. However, visible accumulation by large holders offsets some of this risk.

Ethereum (ETH) forms a bearish flag toward $2,400 if $3,100 breaks, but whale buying may support a rebound to $3,400. Source: Ali Martinez via X
Interpretation: ETH’s price is currently range-bound within the channel. A sustained move above $3,300 could indicate follow-through beyond the recent trading range, while a breakdown below $2,800 would signal further retracement.
Order Flow and Market Behavior Turn More Balanced
Order-flow data from major exchanges indicate that aggressive selling has moderated. Net taker volume has moved closer to neutral, reflecting a shift toward balanced market participation.
Historically, such a transition from heavy selling to equilibrium has preceded short-term upward price adjustments. Yet, confirmation requires persistent demand and stability across exchanges, not just isolated inflows.
Network Improvements Add Fundamental Support
Ethereum’s underlying network metrics continue to strengthen. Transaction fees have dropped to multi-year lows due to rollup adoption and other protocol upgrades, improving ETH’s usability as a settlement layer.
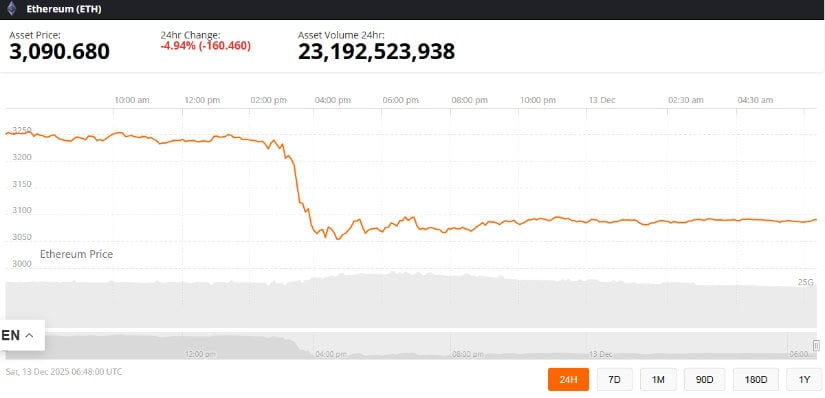
Ethereum was trading at around 3,090.68, down 4.94 in the last 24 hours at press time. Source: Ethereum price via Brave New Coin
Upcoming improvements, such as expanded data throughput for layer-2 solutions, are expected to reduce congestion further and support decentralized finance activity. These technical upgrades, coupled with a macro environment favoring growth assets, reinforce Ethereum’s case as a long-term platform play.
Analysis: Lower fees and increased capacity make Ethereum more attractive for institutional and retail users, potentially supporting sustained adoption and value capture.
Looking Ahead: Key Levels Define the Path Ahead
Near-term, key resistance levels include $3,600, $4,200, and $4,700, contingent on continued support and market stability. On the downside, a break below $2,800 could weaken the bullish structure and signal a deeper retracement.
While Ethereum price prediction 2025 and other long-term forecasts remain uncertain, the current alignment of whale accumulation, ETF flows, and technical stability suggests that ETH is in a critical phase of consolidation rather than an exhausted rally.
For now, Ethereum price news reflects a cautiously optimistic market supported by measurable demand while remaining sensitive to macro conditions and key resistance levels.
Search
RECENT PRESS RELEASES
Related Post


