Ethereum Price To Resume Downtrend? Market Expert Identifies Bearish Chart Setup
June 22, 2025

Trusted Editorial content, reviewed by leading industry experts and seasoned editors. Ad Disclosure
The Ethereum price made a swift and strong comeback at the beginning of the year’s second quarter, having struggled in the first few months of 2025. While the “king of altcoins” is in a much better place than it was a few months ago, ETH has not particularly impressed in the last few weeks.
The Ethereum price had been stuck within a consolidation range before falling to a new swing low over the past week. In the late hours of Saturday, June 21, the altcoin’s value fell below $2,300 in a single move, mirroring the brewing selling pressure in the market due to the escalating tensions in Asia.
Is ETH Price Bound For The $1,200 Level Again?
In a June 21st post on the X platform, Chartered Market Technician (CMT) Aksel Kibar painted an interesting bearish picture for the Ethereum price over the next few weeks. According to the market expert, the price of ETH could be gearing up for a period of significant downward movement.
Related Reading: Here’s Why The Ethereum, Dogecoin, And XRP Prices Suffered A Wipeout
The reasoning behind this bearish projection is the price movement of an ascending channel pattern on the Ethereum chart on the weekly timeframe. An ascending channel is a technical analysis pattern characterized by two major (upward-sloping) trendlines: the upper line linking the swing highs and the lower line connecting the swing lows.
Typically, the ascending channel pattern suggests the persistence of an upward price trend. However, a breakout of this channel can be used to identify a trend reversal or continuation. For instance, if a breakout occurs beneath the lower trendline, it suggests that there might be a shift from an upward trend to a downtrend.
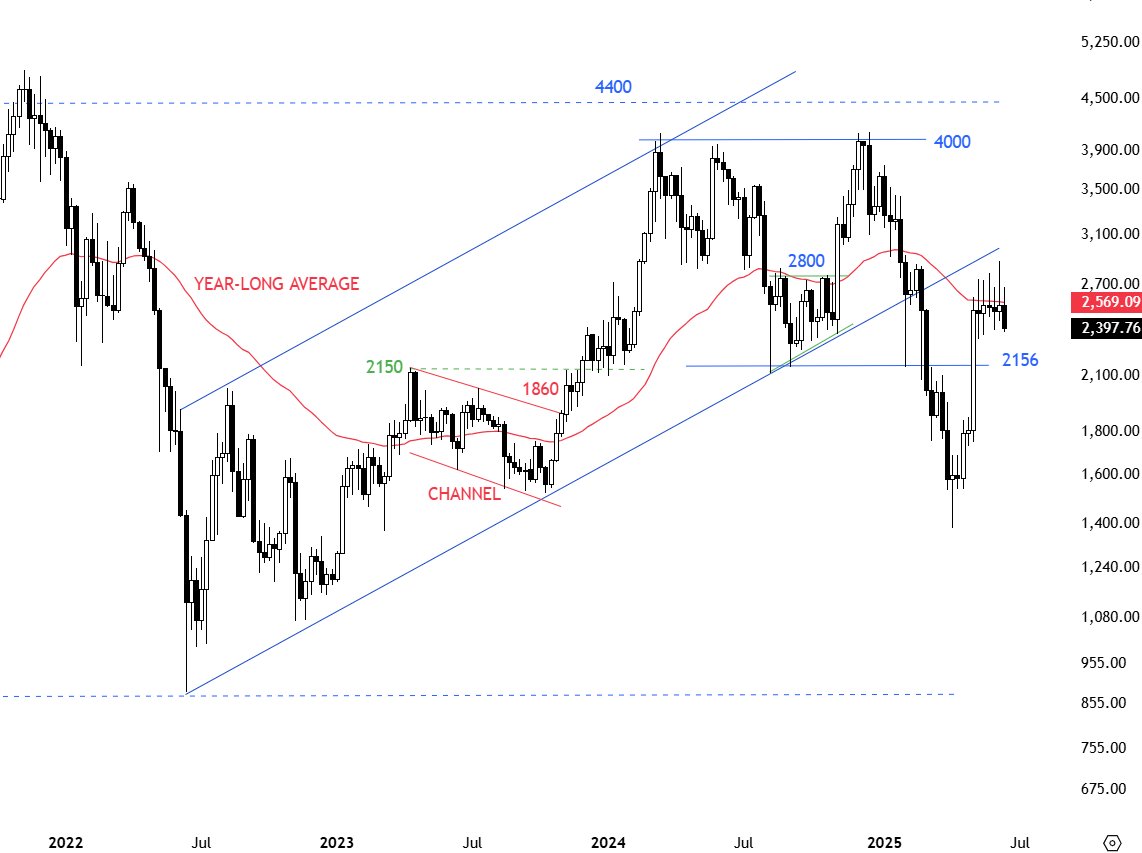
Source: @TechCharts on X
As shown in the chart above, this breakdown was the case for the Ethereum price when it succumbed to significant bearish pressure earlier this year. The altcoin’s value plunged to as low as $1,200 in early April before witnessing a strong resurgence back above the $2,000 level.
In his post on X, Kibar posited that the recent bullish momentum seen with the Ethereum price could be a mere retest of the broken lower channel boundary. If this is the case, the price of ETH may be headed back to $1,200 or even lower — around the $900 region.
Ethereum Price At A Glance
As of this writing, the price of ETH sits just beneath the $2,300 level, reflecting an over 5% decline in the past 24 hours. According to data from CoinGecko, the altcoin is down by nearly 9% on the weekly timeframe.
Related Reading: Bitcoin ‘Rainbow Chart’ Signals Buying Opportunity, But Weak Demand Raises Concerns
The price of ETH on the daily timeframe | Source: ETHUSDT chart on TradingView
Featured image from iStock, chart from TradingView
Editorial Process for bitcoinist is centered on delivering thoroughly researched, accurate, and unbiased content. We uphold strict sourcing standards, and each page undergoes diligent review by our team of top technology experts and seasoned editors. This process ensures the integrity, relevance, and value of our content for our readers.
Search
RECENT PRESS RELEASES
Related Post


