Ethereum Statistics 2025: Data-Driven Insights into the Crypto Giant
July 1, 2025
It was only a decade ago when Ethereum was dismissed as just another altcoin. Fast forward to 2025, and it’s clear that Ethereum has become the backbone of the decentralized internet. From NFT marketplaces to DeFi ecosystems, Ethereum powers the infrastructure of Web3 innovation.
In this article, we unpack the key Ethereum statistics shaping 2025, digging into transaction trends, gas fee dynamics, wallet adoption, and more. Whether you’re an investor, developer, or simply Ethereum-curious, these data points offer clarity in a rapidly evolving blockchain landscape.
- Ethereum’s total market cap surpassed $400 billion in Q1 2025, reclaiming dominance in the Layer 1 space.
- As of March 2025, the daily Ethereum transaction volume consistently exceeds 1.6 million transactions per day.
- The number of active Ethereum wallets has reached an all-time high of 127 million, marking a 22% YoY increase.
- Average gas fees have dropped to $3.78 per transaction, down from over $18 in early 2022, thanks to Layer 2 scaling.
- Over 30 million ETH is currently staked in Ethereum’s Proof-of-Stake system, representing 25% of the total supply.
- Ethereum hosts over $45 billion in TVL (Total Value Locked) across DeFi protocols, maintaining its top position in DeFi dominance.
- The Ethereum NFT sector generated more than $5.8 billion in trading volume during the first quarter of 2025 alone.
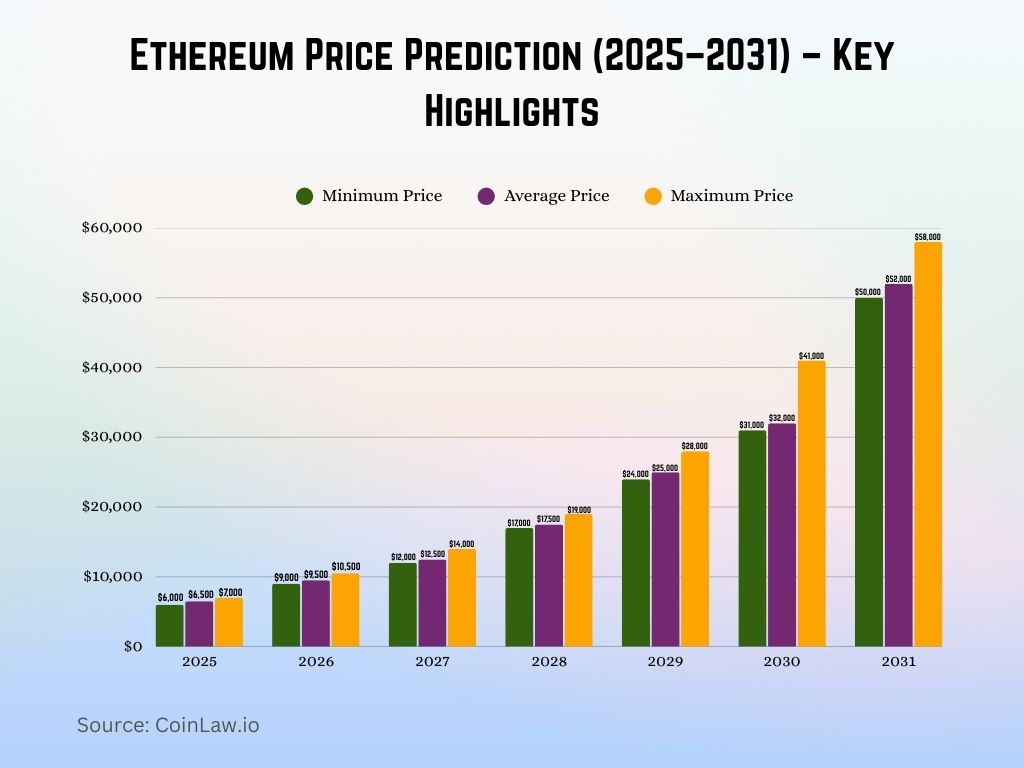
- In 2025, Ethereum is expected to start strong with a minimum price of $6,000, an average of $6,500, and a maximum of $7,000.
- By 2026, prices are predicted to climb further, with the average price reaching $9,500 and a potential peak at $10,500.
- In 2027, ETH could see continued growth, with a minimum of $12,000, an average of $12,500, and a maximum of $14,000.
- The year 2028 forecasts Ethereum at a minimum of $17,000, with an average price of $17,500, and a maximum of $19,000.
- 2029 shows more bullish sentiment, projecting a minimum price of $24,000, an average of $25,000, and a maximum potential of $28,000.
- 2030 could mark a significant jump, with the average price hitting $32,000 and Ethereum possibly reaching as high as $41,000.
- By 2031, Ethereum may achieve a substantial milestone with a minimum price of $50,000, an average of $52,000, and a maximum target of $58,000.
- As of March 2025, Ethereum’s market cap sits at approximately $408 billion, up from $319 billion at the end of 2024.
- Ethereum represents 18.7% of the total cryptocurrency market capitalization globally.
- Ethereum’s market dominance has grown steadily, rising from 15.9% in early 2024 to nearly 19% in 2025.
- Ethereum reclaimed its position as the #2 digital asset, maintaining a consistent gap above BNB and other competitors.
- Institutional accumulation helped push Ethereum’s Q1 2025 rally, with $9.2 billion in inflows since January.
- The Ethereum Foundation’s treasury increased by 11%, and it now holds assets worth over $1.1 billion, mostly in ETH.
- Market volatility remains moderate, with Ethereum’s 30-day volatility index at 28.3%, lower than historical averages.
- Analysts project that Ethereum’s market cap could hit $500 billion by the end of 2025 if the current growth rate holds.
- Ethereum processes an average of 1.65 million transactions daily as of Q1 2025, up from 1.3 million in early 2024.
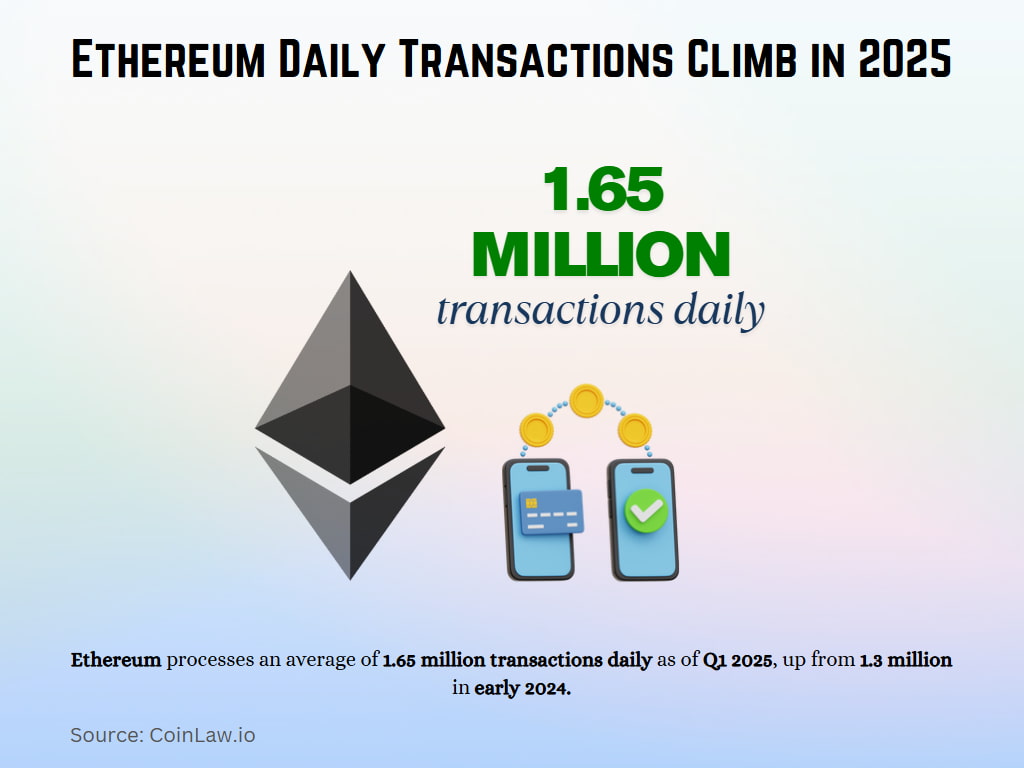
- The highest single-day transaction count in 2025 so far was 1.92 million, recorded on February 17th.
- Smart contract interactions account for nearly 62% of all daily transactions on Ethereum.
- The NFT sector alone is responsible for over 180,000 transactions per day, led by platforms like Blur and OpenSea.
- DeFi protocols such as Uniswap and Aave contribute to roughly 25% of the daily volume.
- With Layer 2 integrations, gas-optimized contracts on mainnet have reduced bloat by 18% compared to 2023.
- On average, Ethereum’s daily transaction value sits around $11.7 billion, an increase of 14% YoY.
- Weekend transaction volume has grown significantly due to global adoption, with Saturdays now averaging 1.55 million transactions.
- The number of active Ethereum wallets reached 127 million in March 2025, a notable 22% YoY increase.
- Ethereum adds approximately 350,000 new wallets per week, driven by user onboarding through Layer 2s.
- MetaMask remains the most popular Ethereum wallet, with over 40 million monthly active users.
- Nearly 11% of active wallets have interacted with at least one DeFi protocol in the past 30 days.
- Wallets linked to NFT marketplaces make up 19% of the total daily activity, indicating strong retail engagement.
- A record 6.1 million wallets participated in on-chain governance votes in Q1 2025.
- The number of multi-signature wallets has grown to 1.4 million, highlighting rising demand for smart contract security.
- Cold wallet usage among Ethereum holders is up by 16%, showing increased focus on self-custody.
- Average Ethereum gas fees are now around $3.78 per transaction, compared to $5.90 in March 2024.
- Peak gas spikes still occur, with some NFT mint events briefly pushing fees over $25, though such cases are rare.
- The most gas-efficient day in 2025 so far was February 6th, with average fees as low as $1.82.
- Layer 2 adoption has driven down base layer congestion, contributing to a 35% reduction in average gas fees.
- Arbitrum and Optimism combined now account for 47% of Ethereum transaction executions, significantly alleviating Layer 1.
- EIP-4844 (proto-danksharding) implementation helped bring down gas fees for rollups by more than 50%.
- Flashbots usage has stabilized, with 35% of blocks now using MEV-boost for efficient transaction ordering.
- Despite lower fees, Ethereum remains the most expensive Layer 1 network in terms of average transaction costs.
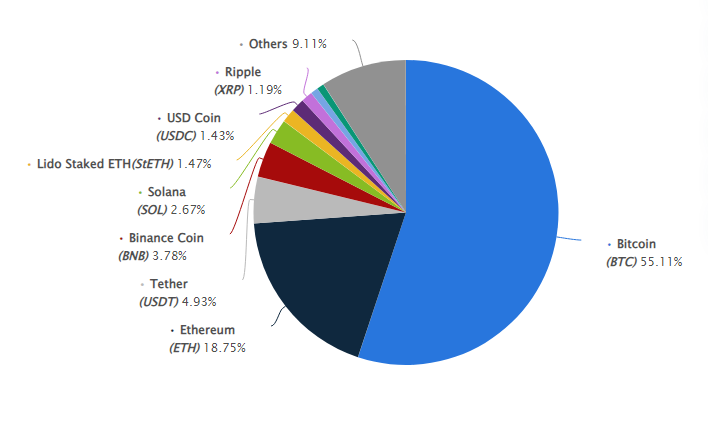
- Bitcoin (BTC) holds the dominant position with 55.11% of the total crypto market.
- Ethereum (ETH) follows as the second-largest player, with a market share of 18.75%.
- Tether (USDT) accounts for 4.93%, reflecting strong stablecoin utility.
- Binance Coin (BNB) takes up 3.78% of the market.
- Solana (SOL) secures 2.67%, showing continued relevance among altcoins.
- Lido Staked ETH (stETH) contributes 1.47% to the total share.
- USD Coin (USDC) has 1.43%, another major stablecoin in the mix.
- Ripple (XRP) represents 1.19% of the crypto market.
- Others (all remaining cryptocurrencies combined) make up 9.11% of the total market cap.
- As of March 2025, over 1.04 million validators are securing Ethereum, up from 890,000 in late 2024.
- The total ETH staked stands at 30.2 million, representing 25% of the entire circulating supply.
- Solo staking now accounts for 11% of all staked ETH, a rise driven by improvements in user-friendly node tools.
- Lido remains the largest staking protocol, managing approximately 8.1 million ETH, followed by Rocket Pool with 2.3 million ETH.
- Ethereum staking yields currently average 3.8% APY, slightly lower than the 4.2% recorded in mid-2024.
- The average staking duration is 11.2 months, with 70% of stakers holding long-term positions.
- Ethereum validators earned a cumulative $1.45 billion in rewards in Q1 2025 alone.
- Since the Shanghai upgrade, over 9.3 million ETH has been successfully withdrawn by stakers.
- The churn limit for validator activation stands at 12 per epoch, maintaining network stability during staking surges.
- Ethereum’s validator participation rate consistently hovers around 99.5%, indicating exceptional uptime.
- The Ethereum NFT market generated $5.8 billion in trading volume in Q1 2025, showing a 21% increase YoY.
- Blur now dominates NFT trading with a 42% market share, overtaking OpenSea, which holds 31%.
- Over 4.3 million NFT transactions were processed on Ethereum during the first three months of 2025.
- The average sale price for Ethereum-based NFTs is now $624 compared to $531 in Q1 2024.
- Digital art accounts for 34% of all Ethereum NFT activity, while gaming assets make up 28%.
- More than 9.5 million unique wallets have interacted with Ethereum NFTs since January 2025.
- Fractional NFTs have grown in popularity, with $142 million locked across fractionalization protocols.
- ENS domain sales surged in 2025, with over 137,000 new registrations in Q1 alone.
- Ethereum Layer 2 platforms like Zora and Base have started hosting NFT projects, boosting cross-chain activity.
- Brands like Nike, Gucci, and Adidas collectively generated over $140 million in NFT revenue on Ethereum in early 2025.
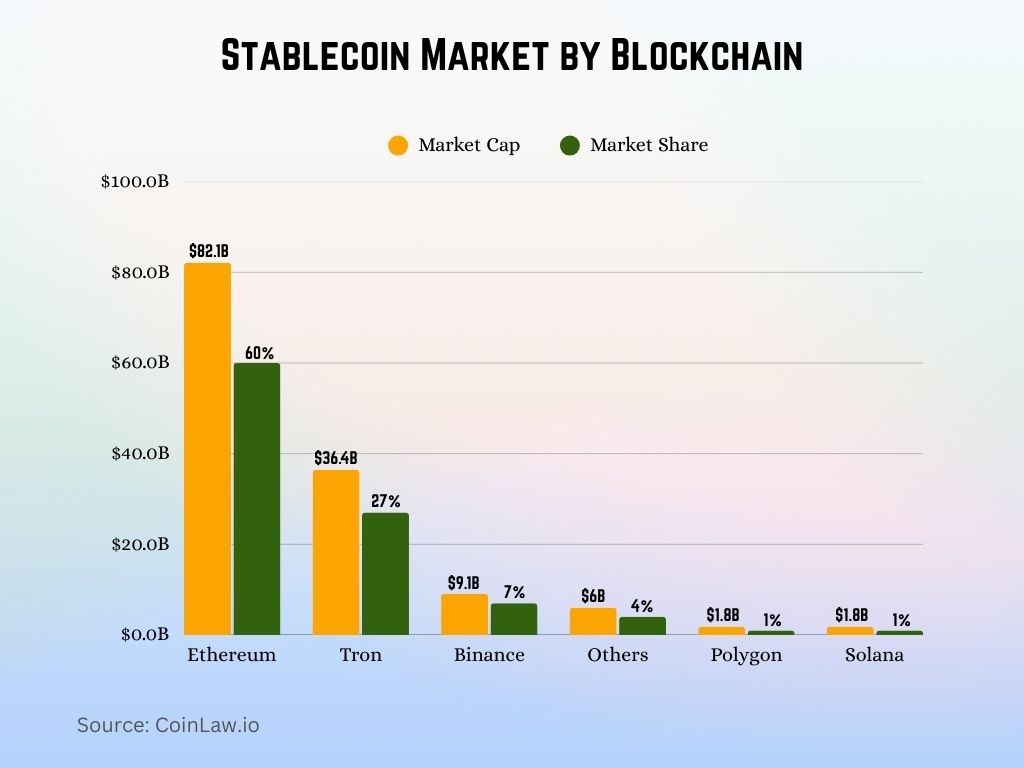
- Ethereum leads the stablecoin market by a wide margin, holding a massive $82.1B, which equates to 60.0% of the total market cap.
- Tron follows in second place with a significant $36.4B, capturing 27.0% of the market.
- Binance stands third, contributing $9.1B, or 7.0% of the overall stablecoin value.
- Others, including smaller or emerging blockchains, collectively make up $6.0B, accounting for 4.0% of the market.
- Both Polygon and Solana each hold $1.8B, sharing an equal market portion of 1.0% apiece.
- Ethereum remains the DeFi leader with over $45 billion in TVL (Total Value Locked) across protocols.
- Uniswap processes more than $2.1 billion in daily volume, with its V4 release in January fueling renewed interest.
- Lending platforms like Aave and Compound together hold over $13 billion in locked assets.
- The number of active DeFi users on Ethereum has surpassed 7.8 million, a 19% YoY increase.
- Liquid staking derivatives (LSDs) now represent 18% of Ethereum’s DeFi TVL, led by stETH and rETH.
- DEX trading on Ethereum outpaces centralized exchanges on-chain, with Uniswap and Curve handling the majority share.
- Ethereum-based real-world asset (RWA) protocols like Centrifuge and Maple Finance collectively hold over $1.1 billion in tokenized assets.
- Stablecoins on Ethereum exceed $92 billion in circulating supply, led by USDC, DAI, and Tether.
- Governance activity is growing, with over 2 million token holders participating in proposals across DeFi DAOs.
- DeFi-related contract exploits dropped by 38% YoY, reflecting improved smart contract audits and security measures.
- Layer 2 solutions on Ethereum process over 60% of total Ethereum transactions as of Q1 2025.
- Arbitrum remains the most used L2, handling 46 million monthly transactions, followed by Optimism with 32 million.
- The total value locked across Ethereum L2s exceeds $27 billion, up 37% YoY.
- ZK-rollups (like zkSync and Scroll) are gaining traction, with zkSync Era surpassing $4 billion in TVL.
- Ethereum mainnet gas usage dropped by 30%, thanks to Layer 2 migration and data compression upgrades.
- Base, Coinbase’s L2 network, reported 3.2 million active users in March 2025.
- Transaction fees on Layer 2s average $0.08 compared to $3.78 on Ethereum mainnet.
- Bridging assets between Layer 1 and Layer 2 reached a monthly volume of $11.2 billion in Q1 2025.
- Developers now deploy more than 65% of new Ethereum smart contracts directly on Layer 2 networks.
- Layer 2 airdrops like Arbitrum’s ARB and Optimism’s OP incentivized millions of wallet signups in early 2025.
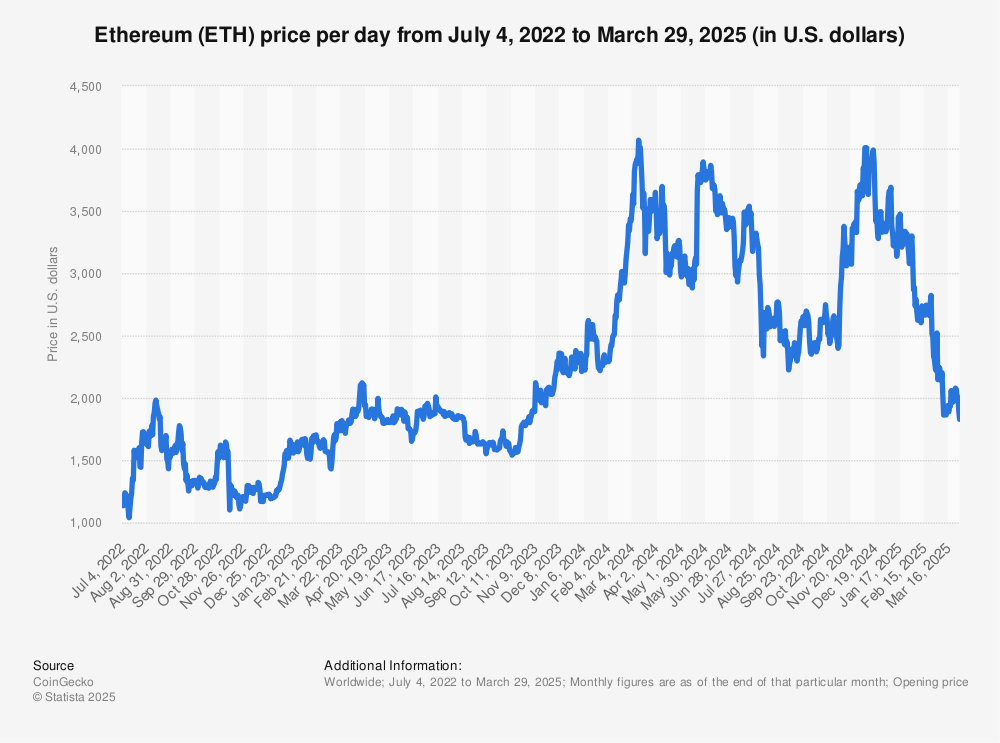
- Ethereum started around $1,100 in July 2022, marking a recovery phase after the crypto winter.
- ETH experienced a notable surge in early 2023, hitting nearly $2,100 by April 2023.
- In mid-2024, Ethereum reached its peak, crossing the $4,000 mark around May–June 2024 — the highest point in the observed period.
- After the peak, prices saw high volatility, with repeated dips and rebounds through the rest of 2024.
- In early 2025, ETH showed a downward trend, falling below $2,000 again by March 2025.
Overall, the chart reflects Ethereum’s cyclical nature, highlighting periods of rapid growth followed by sharp corrections.
- Since The Merge, Ethereum has become net deflationary, with a total supply decrease of −332,000 ETH as of March 2025.
- The annualized burn rate of Ethereum is currently 1.32%, largely driven by EIP-1559’s base fee mechanism.
- Over 4.1 million ETH has been burned since the EIP-1559 upgrade, including 860,000 ETH in Q1 2025.
- The average daily ETH burned sits around 10,200 ETH, higher during peak NFT or DeFi activity.
- The net issuance rate is approximately −0.75%, reinforcing Ethereum’s “ultrasound money” narrative.
- The burn rate often exceeds issuance during network congestion, especially during NFT launches.
- Top contributors to ETH burns include Uniswap, OpenSea, and Tether transactions, with each consistently among the top 10 burners.
- Ethereum’s current circulating supply is approximately 117.2 million ETH, down from its pre-Merge peak.
- Supply deflation has increased Ethereum’s store-of-value appeal among institutional and retail holders.
- As of 2025, there are approximately 6,300 Ethereum nodes operating globally.
- The United States hosts the largest share, with 33.2% of all Ethereum nodes.
- Germany ranks second, hosting around 13.1%, followed by Singapore at 6.5%.
- Node decentralization has improved slightly year-over-year, with node distribution outside of North America and Europe rising to 27%.
- Asia-Pacific regions now account for 15.8% of active Ethereum nodes, up from 11.6% in early 2024.
- The number of home-run nodes increased by 18%, reflecting a resurgence in decentralization efforts.
- Ethereum clients remain diverse: Geth leads with a 62% share, followed by Nethermind and Besu.
- The growth of light nodes and mobile clients has accelerated, supporting scalability and accessibility.
- More than 50% of nodes now support MEV-boost, contributing to fairer transaction inclusion and ordering.
- Ethereum Archive Nodes, used for full historical state data, make up less than 4% due to high storage needs.
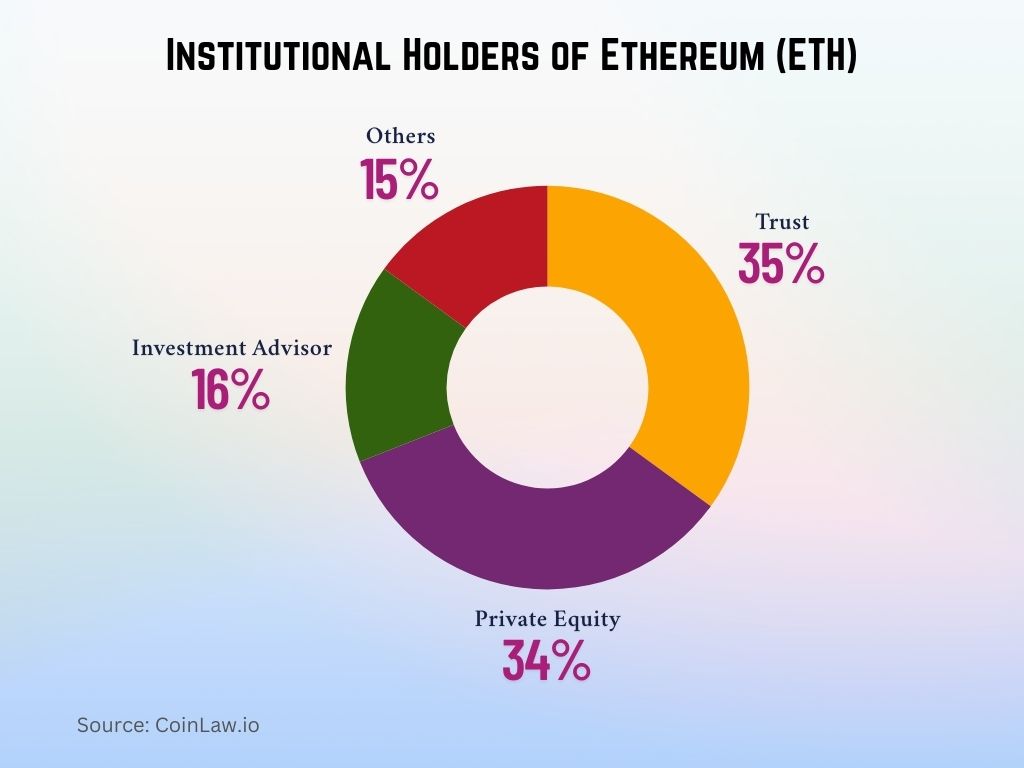
- Trusts are the largest institutional holders of Ethereum, accounting for 35% of total ETH fund ownership.
- Private Equity firms follow closely behind, managing 34% of Ethereum-based funds.
- Investment Advisors represent a smaller but notable share at 16%, reflecting growing professional interest.
- Others (a mix of smaller entities and categories) collectively hold 15% of ETH fund allocations.
- Ethereum recorded over 28,400 GitHub commits across core repositories in the past 12 months.
- The number of active developers contributing to Ethereum-related projects sits at 5,200+, up from 4,600 in 2024.
- The Merge, EIP-4844, and upcoming Verkle trees have driven significant core dev engagement.
- Client diversity has increased, with more contributors joining Besu, Erigon, and Lighthouse teams.
- Weekly development activity remains highest among Layer 1 protocols, consistently topping GitHub charts.
- Ethereum Improvement Proposals (EIPs) submitted in 2025 exceeded 230, with 37 accepted and merged.
- Tooling for developers improved, with popular projects like Foundry and Hardhat receiving major upgrades.
- Grants programs from the Ethereum Foundation distributed over $48 million in funding during 2024–25.
- Regional dev hubs in Vietnam, Nigeria, and Argentina are gaining momentum, supported by community-run hackathons.
- Security-focused development increased by 23%, focusing on formal verification and runtime audits.
- Ethereum has not experienced any critical Layer 1 security breaches since The Merge in 2022.
- In 2025, only four high-profile smart contract exploits occurred, totaling $46 million in losses, a 62% YoY drop.
- Bug bounty programs paid out more than $7.6 million in rewards during the last 12 months.
- Over 420 smart contracts were voluntarily paused or upgraded after on-chain anomaly detection.
- MEV-related risks remain under scrutiny, with over $1.3 billion extracted in 2024–25, but tools like Flashbots Protect help mitigate user harm.
- The introduction of intent-based transaction models has reduced frontrunning attacks by 29%.
- Ethereum staking services now require security disclosures, boosting transparency for new validators.
- More than 60% of top DeFi protocols run real-time security monitors that detect malicious patterns.
- The deployment of Account Abstraction (ERC-4337) has enhanced wallet security by enabling programmable recovery features.
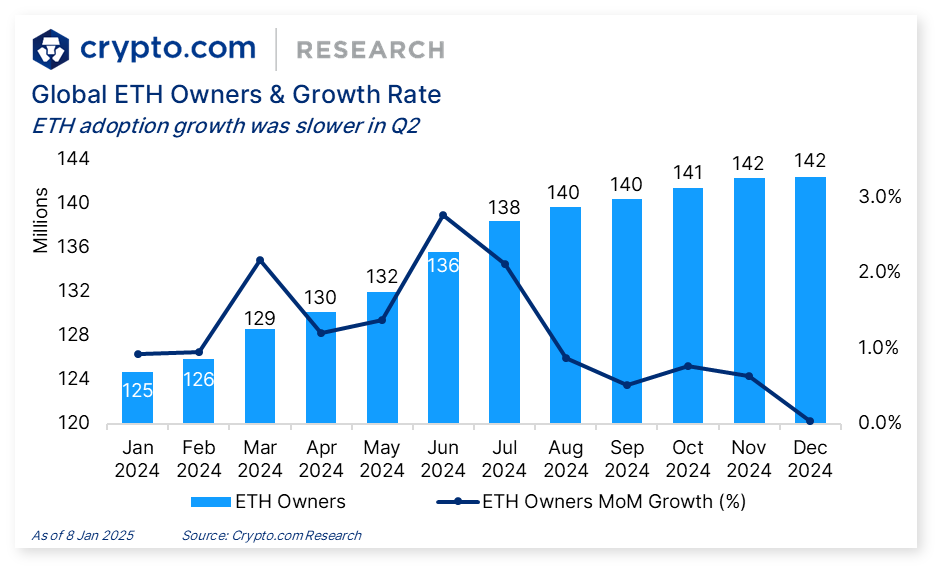
- ETH owners grew from 125 million in January to 142 million by December 2024, indicating consistent adoption throughout the year.
- The highest growth rate occurred in June 2024, with ownership jumping from 132M to 136M, reflecting a 3% month-over-month (MoM) increase.
- Growth momentum slowed down significantly in Q3, with no change between August and September (140M).
- Q4 growth flattened, with ETH holders remaining stable at 142M from October to December and MoM growth nearing 0% by year-end.
- Despite a slowdown in later months, the year saw a total increase of 17 million ETH owners, signaling a positive long-term adoption trend.
- Ethereum’s market cap of $408 billion is second only to Bitcoin’s $1.3 trillion as of Q1 2025.
- Ethereum consistently processes 6x more daily transactions than Bitcoin 1.6 million vs. 260,000.
- Bitcoin’s average transaction fee remains around $2.10, while Ethereum’s is slightly higher at $3.78.
- Ethereum outpaces other Layer 1s in developer activity, boasting over 5,200 monthly contributors—nearly double that of Solana or Avalanche.
- Ethereum’s TVL in DeFi remains dominant at $45 billion, compared to $6.7B on Solana and $2.4B on BNB Chain.
- In NFT activity, Ethereum still leads despite growing competition from Solana and Polygon.
- Ethereum leads in Layer 2 integration, while Bitcoin’s Layer 2 ecosystem (e.g., Lightning Network) remains limited in adoption.
- Energy usage of Ethereum post-Merge is now 99.95% lower than Bitcoin, thanks to its PoS model.
- Ethereum remains the most flexible platform for smart contract deployment, compared to Bitcoin’s minimal scripting capability.
- As of late March 2025, Ethereum is trading at approximately $3,420, up from $2,170 at the start of 2024.
- Ethereum’s 24-hour trading volume hovers around $28 billion, placing it among the top 3 most-traded assets globally.
- Year-to-date growth stands at 57%, driven by macroeconomic shifts and institutional inflows.
- The all-time high (ATH) for Ethereum remains $4,878, reached in November 2021.
- Ethereum’s monthly average price in Q1 2025 was $3,280, with steady upward momentum.
- On-chain data shows that over 3.8 million ETH has moved off exchanges, signaling long-term holding behavior.
- The volatility index for ETH remains moderate, trending at 27.8, compared to Bitcoin’s 24.3.
- Large wallet addresses (aka “whales”) holding 10,000 ETH or more have increased by 11.4% YoY.
- Google Trends search interest in “Ethereum” is up 38% YoY, peaking during major updates like the EIP-4844 launch.
- EIP-4844 (proto-danksharding) was launched in February 2025, reducing Layer 2 data costs by over 50%.
- The rollout of ERC-4337 Account Abstraction enables gasless transactions, biometric authentication, and smart wallet recovery.
- EigenLayer, Ethereum’s re-staking protocol, has surpassed $6 billion in deposits within 6 months of its public mainnet launch.
- LayerZero and CCIP are driving cross-chain composability, allowing seamless asset bridging from Ethereum to Cosmos, Solana, and others.
- Ethereum’s Dencun upgrade is scheduled for Q3 2025, targeting improvements in data availability and validator rotation.
- Multiple real-world asset tokenization pilots have been launched, including collaborations with HSBC and BlackRock.
- The Ethereum Foundation introduced a new Sustainability Grant Track, funding eco-focused infrastructure solutions.
- Rollup-as-a-Service (RaaS) platforms are booming, with over 300 projects now building custom Ethereum rollups.
- Ethereum’s native mobile wallet project, “Nimbus Light”, is currently in beta and expected to launch by Q4.
- Regulatory clarity is improving in the US, with Ethereum recognized as a commodity in several new legal rulings.
Ethereum’s evolution in 2025 reflects a network that is both scaling and maturing. From explosive growth in validator participation to Layer 2 breakthroughs, the protocol has achieved a delicate balance of decentralization, security, and innovation. Whether you’re eyeing DeFi, NFTs, or real-world asset integration, Ethereum remains at the core of blockchain’s most transformative applications. With macro support growing and user metrics surging, Ethereum continues to assert itself not just as a platform but as infrastructure for the next internet.
Disclaimer: The content published on CoinLaw is intended solely for informational and educational purposes. It does not constitute financial, legal, or investment advice, nor does it reflect the views or recommendations of CoinLaw regarding the buying, selling, or holding of any assets. All investments carry risk, and you should conduct your own research or consult with a qualified advisor before making any financial decisions. You use the information on this website entirely at your own risk.
Search
RECENT PRESS RELEASES
Related Post


