Ethereum technical analysis shows bulls crossing up this important resistance
May 5, 2026
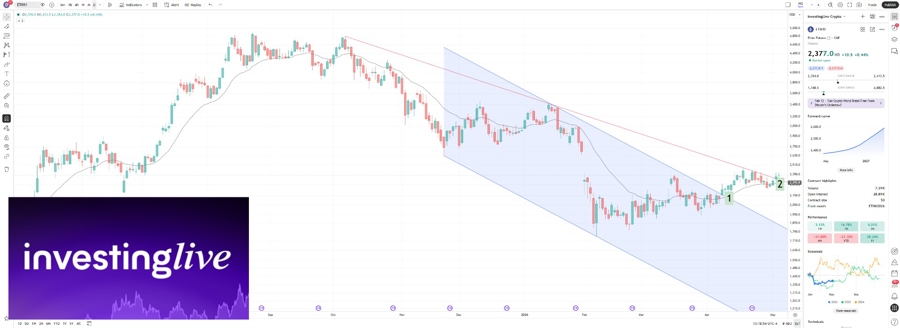
The technical landscape for Ethereum (ETH) as of May 5, 2026, reveals a pivotal shift in momentum based on the daily chart above. This internal strength is developing alongside a broader market recovery where tech shares are leading a rebound and US futures remain steady despite geopolitical tensions. As I also wrote this morning, Nasdaq futures traders are good as they watch price holding above 27942 (Nasdaq futures reached apx 200 points above that threshold from this morning), so Nasdaq is not hurting the bullish crypto sentiment. Bulls grinding up and shorts being repeatedly stopped out. I tried to save a few eager shorts this whole month from being liquadated. Some got the hints, others didn’t. It is what it is.
Technical Analysis Breakdown for EthereumToday
1. The Blue Bull Flag Breakout
The price has successfully exited the downward-sloping blue flag pattern labeled in point 1 in my chart above. This breakout is mirrored by Bitcoin’s recent order-flow shift, which shows buyers reclaiming control as BTC tests major psychological resistance.
-
Target: Conventional technical analysis of this breakout suggests a measured move target of approximately $3,000.
-
Significance: Reclaiming levels above the flag structure suggests that crypto assets are finding buyers at the highest levels seen since early Q1 2026.
2. Red Trend Line and Moving Averages
The red trend line labeled in my chart as points 2 above represents a significant long-term resistance level.
-
Current Status: Ethereum is currently testing this boundary. Much like Bitcoin’s migration toward a higher Point of Control (POC), ETH needs to prove it can build value above this trend line to sustain the move.
-
The Fakie Risk: A false breakout occurs if the price wicks above the red line but fails to close above it. Traders are looking for a confirmed daily close to distinguish a genuine trend reversal from a “liquidity push.”
3. Key Levels to Watch
| Level | Type | Significance |
| $2,420 | Resistance | A clean close above this level confirms the breakout from the red trend line (2). |
| $2,300 | Support | The previous resistance of the blue flag (1) should now act as a floor. |
| $2,150 | Critical Support | Losing this level would invalidate the current bullish structure seen in image_dbcb7e.png. |
The Crypto Educational Section: Chart Patterns and Market Traps
Understanding the Bull Flag
A Bull Flag is a continuation pattern consisting of a strong upward move (the flagpole) followed by a downward-sloping channel (the flag).
-
Interpretation: It represents a period where buyers are taking profits while the market digests the previous move before continuing higher.
-
Volume: Ideally, volume should spike during the breakout at point (1), signaling strong conviction.
What is a “Fakie”?
A Fakie, or false breakout, is a market trap where the price appears to break a major level (like the red trend line in image_dbcb7e.png), only to reverse sharply.
-
Confirmation: To avoid being caught in a fakie, traders often wait for a retest. This is when the price breaks above the line, returns to touch it from above (testing it as support), and then bounces.
Outlook and Sentiment for Ethereum
The technical indicators on my chart show a constructive “higher-low” pattern. This alignment with rising US equities provides a supportive backdrop for risk assets. If the breakout at (2) is sustained, the next major hurdle will be psychological resistance at $2,500. Conversely, if this proves to be a fakie (we will soon know… this week probably), a return to the mid-channel of the blue flag is the likely trajectory.
Search
RECENT PRESS RELEASES
Related Post


