Ethereum Tracks Bitcoin as ETH Price Prediction Signals Further 60% Drop to April Lows
November 17, 2025
Ethereum (ETH) price has tested
the psychological $3,000 level, deepening medium-term lows and falling to the
lowest levels in over 4 months. And although the ETH price is rising today (Monday),
November 17, 2025, rebounding over 3.46% to trade at $3,199.35, my Ethereum forecasts
remain bearish.
The
cryptocurrency faces a potentially catastrophic 60% decline scenario as extreme
fear grips the market and technical signals flash warning signs of deeper
correction ahead. Let’s check together why Ethereum is falling with other
crypto and what the ETH/USDT technical chart hides.
Follow me on X for more up-to-date analysis
and forecasts on major cryptocurrencies and other financial instruments.
Bitcoin (BTC) briefly fell below
$94,000 for the first time since May 6 on Sunday, triggering a cascade across
the entire cryptocurrency market, including Ethereum. Analysts pointed to
intensifying fear among traders and flagged possible downside risks as
sentiment stayed locked in extreme fear territory. As I wrote in my previous
Bitcoin price analysis, the
oldest cryptocurrency may fall another 30% from the current levels.
The Crypto
Fear & Greed Index stood at 10, firmly in its extreme fear band,
after already sitting at the same level on Saturday.
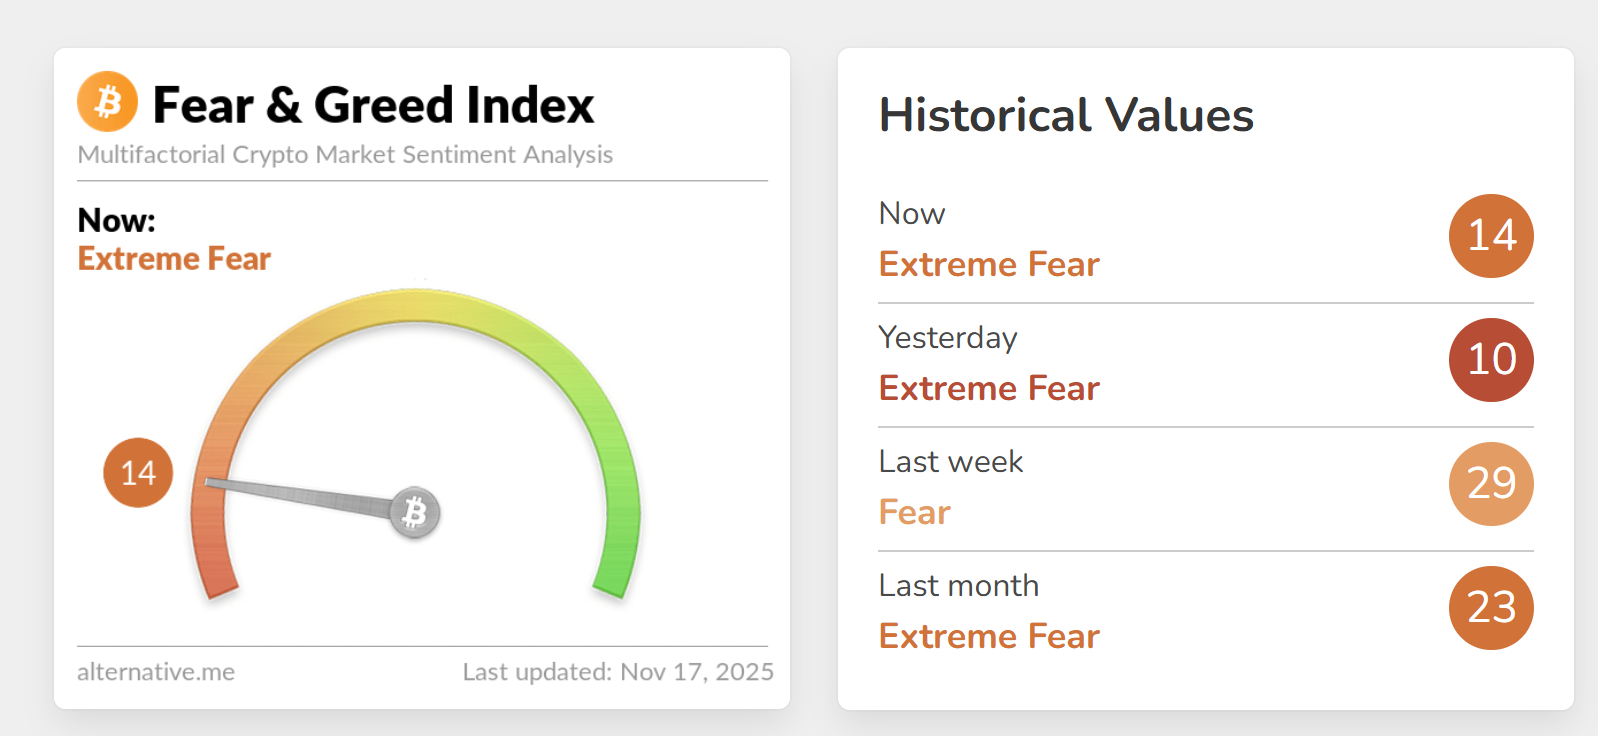
This
represents one of the most severe sentiment readings in 2025, reflecting
widespread panic as the crypto market experienced a $19 billion liquidation
event.
“Volatility
has not been limited to equity markets – economic uncertainty and the recent
tech sector sell-offs have had a direct and immediate impact on the price of
Bitcoin,” Hina Sattar Joshi, Director at TP ICAP Digital Assets, explained. “After
the summer’s exuberance, this month, the cryptocurrency experienced a $19
billion liquidation and continued the most sustained declines in price since
Donald Trump’s inauguration.”
Ethereum
has underperformed Bitcoin during this selloff, declining from its August year
high of $4,955.90 to current levels around $3,199.35, a decline approaching 40%
from peak levels. This underperformance signals particular weakness in the
altcoin leader as institutional and retail participants alike reduce exposure
to digital assets amid deteriorating market conditions.
Why Ethereum Is Falling
Today? Death Cross Formation Imminent
According
to my technical analysis, from this year’s highs, ETH has corrected so strongly
that, from a standard market perspective, it would mean entering a downtrend
with double force. Moreover, since the beginning of the month we’ve been moving
below the 200 EMA, which for me is a binary separation between bull trend and
bear trend.
We’ll soon
see a death cross formation on the chart as the 50 EMA is
rapidly approaching the crossover of the 200 EMA, which will be a strong sell
signal for me. Ethereum’s 50-day moving average currently sits at $3,892.98
while the 200-day moving average is at $3,467.40, a narrowing gap that suggests
the crossover could occur within days. The last time such a crossover occurred
was at the beginning of the year in February, when ETH subsequently fell 50% to
the April lows.
“This
time, the signal comes at a moment when liquidity is only starting to
stabilize, December rate-cut odds have fallen from near-certainty to ~50%, and
market risks remain unresolved, including Tom Lee’s warnings about two major
market makers facing financial deficits,” said Lacie Zhang, Research Analyst at
Bitget Wallet. “With institutional flows gradually returning, traders should
approach this cross with caution: it can reinforce a risk-off structure,
favoring defensive positioning, hedging through derivatives, or disciplined
spot accumulation.”
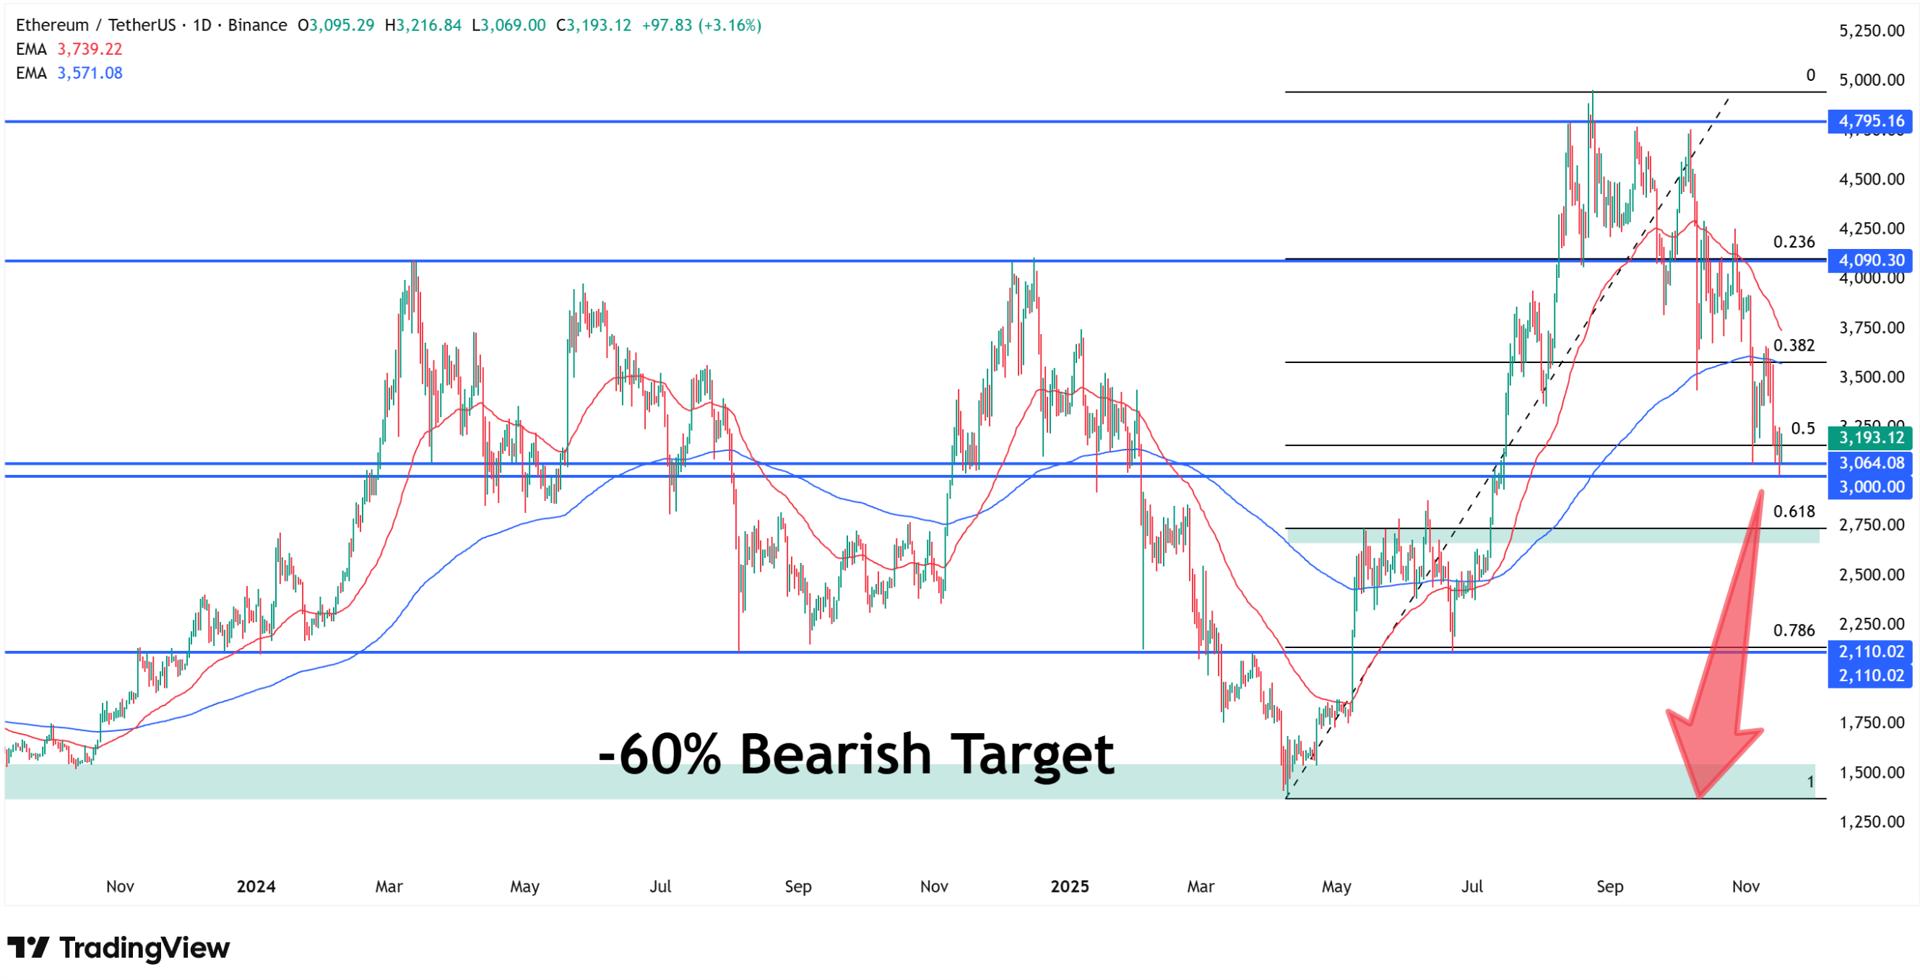
How Low Can Ethereum Go? -60%
Ethereum Price Prediction
How low
could Ethereum fall? According to my ETH price forecasts, if current
psychological support doesn’t hold, then price will head toward the support
zone determined by local highs from May and June this year around $2,700-$2,750,
additionally strengthened by the 61.8% Fibonacci retracement.
The next
target is $2,150, the June lows coinciding with the intraday
minimum on February 3 and the lows from August 2024. This level represents a
33% decline from current $3,199 prices and would mark a significant
psychological breakdown for Ethereum holders who accumulated during the summer
rally.
The
ultimate level of decline for me is the zone between $1,500 (September
2023 lows) and $1,370 (April 2025 minimums). If Ethereum were
heading in that direction, it could lose almost 60% from current levels. This
catastrophic scenario would take ETH back to year-low territory at $1,383.26,
essentially erasing all gains achieved since the spring bottom.
Institutional Outflows and
Macro Headwinds Are Not Helping
Linh Tran,
Market Analyst at XS.com, emphasized that the selling pressure extends beyond
retail panic: “Bitcoin fell below the USD 93,000 mark this weekend, which
is the lowest level in nearly six months. This decline marks one of the
strongest corrections since the beginning of the year. It also reflects a shift
in overall market sentiment from the risk-on optimism at the beginning of Q4 to
a more cautious and defensive risk-off tone.”
Tran
continued: “From the peak near USD 125,000 in early October, Bitcoin has
lost nearly 25% of its value, showing that the current selling pressure
does not come only from retail investors but also from institutional flows,
which are highly sensitive to macroeconomic signals.”
The $19
billion Bitcoin liquidation event described by Hina Joshi represents forced
selling that cascaded across all digital assets. When Bitcoin experiences such
massive liquidations, altcoins like Ethereum typically suffer amplified losses
as leveraged positions unwind and traders flee to cash or stablecoins for
safety.
What Would Invalidate Ethereum
Bearish Scenario?
What would
need to happen for me to start looking at the ETH/USD chart bullishly again?
First of all, we would need to return above the grid of 50 and 200 EMAs,
simultaneously at the 38.2% Fibonacci retracement. In my opinion, this would
open the way to looking again at a test of this year’s historical highs, and
earlier a return to the round level of $4,000.
Technically,
Ethereum would need to reclaim the $3,600-$3,900 zone decisively, ideally on
strong volume, to negate the death cross signal before it fully forms. This
would require approximately 12-22% gains from current $3,199 levels—a
significant move that would necessitate major positive catalysts.
Potential
catalysts for reversal include:
- Aggressive Fed easing: If December rate cut
materializes and guidance signals continued easing into 2026 - Ethereum network upgrades: The upcoming Fusaka
upgrade delivering performance improvements - Institutional ETF inflows: Resumption of flows into
Ethereum ETFs after recent outflows - Bitcoin stabilization: BTC holding above $90,000
and reclaiming $100,000 psychological level - Liquidity injection: Resolution of market
maker concerns and return of risk appetite
Ethereum Price Analysis,
FAQ
Why is Ethereum going
down?
Ethereum is
declining due to multiple converging factors: the imminent death cross
formation (50 EMA approaching crossover below 200 EMA), Crypto Fear & Greed
Index at 10 (Extreme Fear), and the $19 billion Bitcoin liquidation event
triggering cascade selling across altcoins.
Why is crypto going down?
The
cryptocurrency market is experiencing one of its strongest corrections since
the beginning of 2025, driven by a $19 billion Bitcoin liquidation event,
extreme fear sentiment (Fear & Greed Index at 10), and a shift from Q4
risk-on optimism to defensive positioning.
How low can Ethereum go?
According
to my ETH price forecasts, Ethereum faces a potential 60% decline from current
levels around $3,199 to the ultimate downside zone between $1,370-$1,500
matching April 2025 and September 2023 lows.
How much will Ethereum be
worth in 2025?
If the
imminent death cross confirms (50 EMA crossing below 200 EMA) and $3,000
support fails, my forecast shows Ethereum could decline through multiple
levels: first to $2,700-$2,750 (May/June local highs strengthened by 61.8%
Fibonacci retracement), then $2,150 (June lows coinciding with February
intraday minimum), and ultimately to $1,370-$1,500 matching April 2025 lows and
September 2023 levels.
Ethereum (ETH) price has tested
the psychological $3,000 level, deepening medium-term lows and falling to the
lowest levels in over 4 months. And although the ETH price is rising today (Monday),
November 17, 2025, rebounding over 3.46% to trade at $3,199.35, my Ethereum forecasts
remain bearish.
The
cryptocurrency faces a potentially catastrophic 60% decline scenario as extreme
fear grips the market and technical signals flash warning signs of deeper
correction ahead. Let’s check together why Ethereum is falling with other
crypto and what the ETH/USDT technical chart hides.
Follow me on X for more up-to-date analysis
and forecasts on major cryptocurrencies and other financial instruments.
Bitcoin (BTC) briefly fell below
$94,000 for the first time since May 6 on Sunday, triggering a cascade across
the entire cryptocurrency market, including Ethereum. Analysts pointed to
intensifying fear among traders and flagged possible downside risks as
sentiment stayed locked in extreme fear territory. As I wrote in my previous
Bitcoin price analysis, the
oldest cryptocurrency may fall another 30% from the current levels.
The Crypto
Fear & Greed Index stood at 10, firmly in its extreme fear band,
after already sitting at the same level on Saturday.
This
represents one of the most severe sentiment readings in 2025, reflecting
widespread panic as the crypto market experienced a $19 billion liquidation
event.
“Volatility
has not been limited to equity markets – economic uncertainty and the recent
tech sector sell-offs have had a direct and immediate impact on the price of
Bitcoin,” Hina Sattar Joshi, Director at TP ICAP Digital Assets, explained. “After
the summer’s exuberance, this month, the cryptocurrency experienced a $19
billion liquidation and continued the most sustained declines in price since
Donald Trump’s inauguration.”
Ethereum
has underperformed Bitcoin during this selloff, declining from its August year
high of $4,955.90 to current levels around $3,199.35, a decline approaching 40%
from peak levels. This underperformance signals particular weakness in the
altcoin leader as institutional and retail participants alike reduce exposure
to digital assets amid deteriorating market conditions.
Why Ethereum Is Falling
Today? Death Cross Formation Imminent
According
to my technical analysis, from this year’s highs, ETH has corrected so strongly
that, from a standard market perspective, it would mean entering a downtrend
with double force. Moreover, since the beginning of the month we’ve been moving
below the 200 EMA, which for me is a binary separation between bull trend and
bear trend.
We’ll soon
see a death cross formation on the chart as the 50 EMA is
rapidly approaching the crossover of the 200 EMA, which will be a strong sell
signal for me. Ethereum’s 50-day moving average currently sits at $3,892.98
while the 200-day moving average is at $3,467.40, a narrowing gap that suggests
the crossover could occur within days. The last time such a crossover occurred
was at the beginning of the year in February, when ETH subsequently fell 50% to
the April lows.
“This
time, the signal comes at a moment when liquidity is only starting to
stabilize, December rate-cut odds have fallen from near-certainty to ~50%, and
market risks remain unresolved, including Tom Lee’s warnings about two major
market makers facing financial deficits,” said Lacie Zhang, Research Analyst at
Bitget Wallet. “With institutional flows gradually returning, traders should
approach this cross with caution: it can reinforce a risk-off structure,
favoring defensive positioning, hedging through derivatives, or disciplined
spot accumulation.”
How Low Can Ethereum Go? -60%
Ethereum Price Prediction
How low
could Ethereum fall? According to my ETH price forecasts, if current
psychological support doesn’t hold, then price will head toward the support
zone determined by local highs from May and June this year around $2,700-$2,750,
additionally strengthened by the 61.8% Fibonacci retracement.
The next
target is $2,150, the June lows coinciding with the intraday
minimum on February 3 and the lows from August 2024. This level represents a
33% decline from current $3,199 prices and would mark a significant
psychological breakdown for Ethereum holders who accumulated during the summer
rally.
The
ultimate level of decline for me is the zone between $1,500 (September
2023 lows) and $1,370 (April 2025 minimums). If Ethereum were
heading in that direction, it could lose almost 60% from current levels. This
catastrophic scenario would take ETH back to year-low territory at $1,383.26,
essentially erasing all gains achieved since the spring bottom.
Institutional Outflows and
Macro Headwinds Are Not Helping
Linh Tran,
Market Analyst at XS.com, emphasized that the selling pressure extends beyond
retail panic: “Bitcoin fell below the USD 93,000 mark this weekend, which
is the lowest level in nearly six months. This decline marks one of the
strongest corrections since the beginning of the year. It also reflects a shift
in overall market sentiment from the risk-on optimism at the beginning of Q4 to
a more cautious and defensive risk-off tone.”
Tran
continued: “From the peak near USD 125,000 in early October, Bitcoin has
lost nearly 25% of its value, showing that the current selling pressure
does not come only from retail investors but also from institutional flows,
which are highly sensitive to macroeconomic signals.”
The $19
billion Bitcoin liquidation event described by Hina Joshi represents forced
selling that cascaded across all digital assets. When Bitcoin experiences such
massive liquidations, altcoins like Ethereum typically suffer amplified losses
as leveraged positions unwind and traders flee to cash or stablecoins for
safety.
What Would Invalidate Ethereum
Bearish Scenario?
What would
need to happen for me to start looking at the ETH/USD chart bullishly again?
First of all, we would need to return above the grid of 50 and 200 EMAs,
simultaneously at the 38.2% Fibonacci retracement. In my opinion, this would
open the way to looking again at a test of this year’s historical highs, and
earlier a return to the round level of $4,000.
Technically,
Ethereum would need to reclaim the $3,600-$3,900 zone decisively, ideally on
strong volume, to negate the death cross signal before it fully forms. This
would require approximately 12-22% gains from current $3,199 levels—a
significant move that would necessitate major positive catalysts.
Potential
catalysts for reversal include:
- Aggressive Fed easing: If December rate cut
materializes and guidance signals continued easing into 2026 - Ethereum network upgrades: The upcoming Fusaka
upgrade delivering performance improvements - Institutional ETF inflows: Resumption of flows into
Ethereum ETFs after recent outflows - Bitcoin stabilization: BTC holding above $90,000
and reclaiming $100,000 psychological level - Liquidity injection: Resolution of market
maker concerns and return of risk appetite
Ethereum Price Analysis,
FAQ
Why is Ethereum going
down?
Ethereum is
declining due to multiple converging factors: the imminent death cross
formation (50 EMA approaching crossover below 200 EMA), Crypto Fear & Greed
Index at 10 (Extreme Fear), and the $19 billion Bitcoin liquidation event
triggering cascade selling across altcoins.
Why is crypto going down?
The
cryptocurrency market is experiencing one of its strongest corrections since
the beginning of 2025, driven by a $19 billion Bitcoin liquidation event,
extreme fear sentiment (Fear & Greed Index at 10), and a shift from Q4
risk-on optimism to defensive positioning.
How low can Ethereum go?
According
to my ETH price forecasts, Ethereum faces a potential 60% decline from current
levels around $3,199 to the ultimate downside zone between $1,370-$1,500
matching April 2025 and September 2023 lows.
How much will Ethereum be
worth in 2025?
If the
imminent death cross confirms (50 EMA crossing below 200 EMA) and $3,000
support fails, my forecast shows Ethereum could decline through multiple
levels: first to $2,700-$2,750 (May/June local highs strengthened by 61.8%
Fibonacci retracement), then $2,150 (June lows coinciding with February
intraday minimum), and ultimately to $1,370-$1,500 matching April 2025 lows and
September 2023 levels.
Search
RECENT PRESS RELEASES
What Europe needs to scale renewable energy in agriculture
SWI Editorial Staff2025-11-17T09:08:16-08:00November 17, 2025|
India power regulator warns renewable projects of disconnection for grid violations
SWI Editorial Staff2025-11-17T09:07:53-08:00November 17, 2025|
Jeff Bezos reportedly returns to the trenches as co-CEO of new AI startup, Project Prometh
SWI Editorial Staff2025-11-17T09:07:27-08:00November 17, 2025|
Amazon launches $12 billion bond sale as AI boom fuels need for capital
SWI Editorial Staff2025-11-17T09:07:00-08:00November 17, 2025|
Jeff Bezos returns as co-CEO of $6.2B AI startup Prometheus
SWI Editorial Staff2025-11-17T09:06:36-08:00November 17, 2025|
Investors Are Sick of Amazon
SWI Editorial Staff2025-11-17T09:06:09-08:00November 17, 2025|
Related Post


