Ethereum’s Busiest Quarter Hasn’t Moved Its Price – That Gap is the Story
April 17, 2026
Ethereum crossed 200 million quarterly transactions for the first time in Q1 2026, a 43% jump from Q4 2025’s 145 million, according to Artemis data reported by CoinDesk. Activity bottomed near 90 million in 2023, then spent most of 2024 grinding between 100 million and 120 million. The recovery is a clear U-shape from the 2023 lows — the kind of multi-year usage recovery that historically precedes price movement rather than trailing it.
Most of the activity lives on Layer 2s — separate networks built on top of Ethereum that process transactions cheaply and batch settlements to the base layer. Base and Arbitrum are the two largest, and their traffic shows up on Ethereum’s base layer as settlement and bridging activity, even when end users never directly touch L1.
Stablecoin supply on Ethereum has also reached a record $180 billion, according to Token Terminal data cited by CoinDesk, accounting for roughly 60% of global stablecoin supply. Both L2 growth and stablecoin usage push transaction counts higher at L1 through settlement and bridging, even as per-transaction revenue on the base layer has declined.
The Dencun Effect and the Fee Problem
The risk embedded in this usage recovery is structural. After Ethereum’s Dencun upgrade significantly reduced data costs for L2s, more activity no longer translates cleanly into more base-layer revenue.
Ethereum earns less per transaction than it did pre-Dencun, meaning the 200 million quarterly record does not translate into proportional fee burn or holder value. The activity is real; the economic model underneath it has shifted.
The ETH/BTC Structure
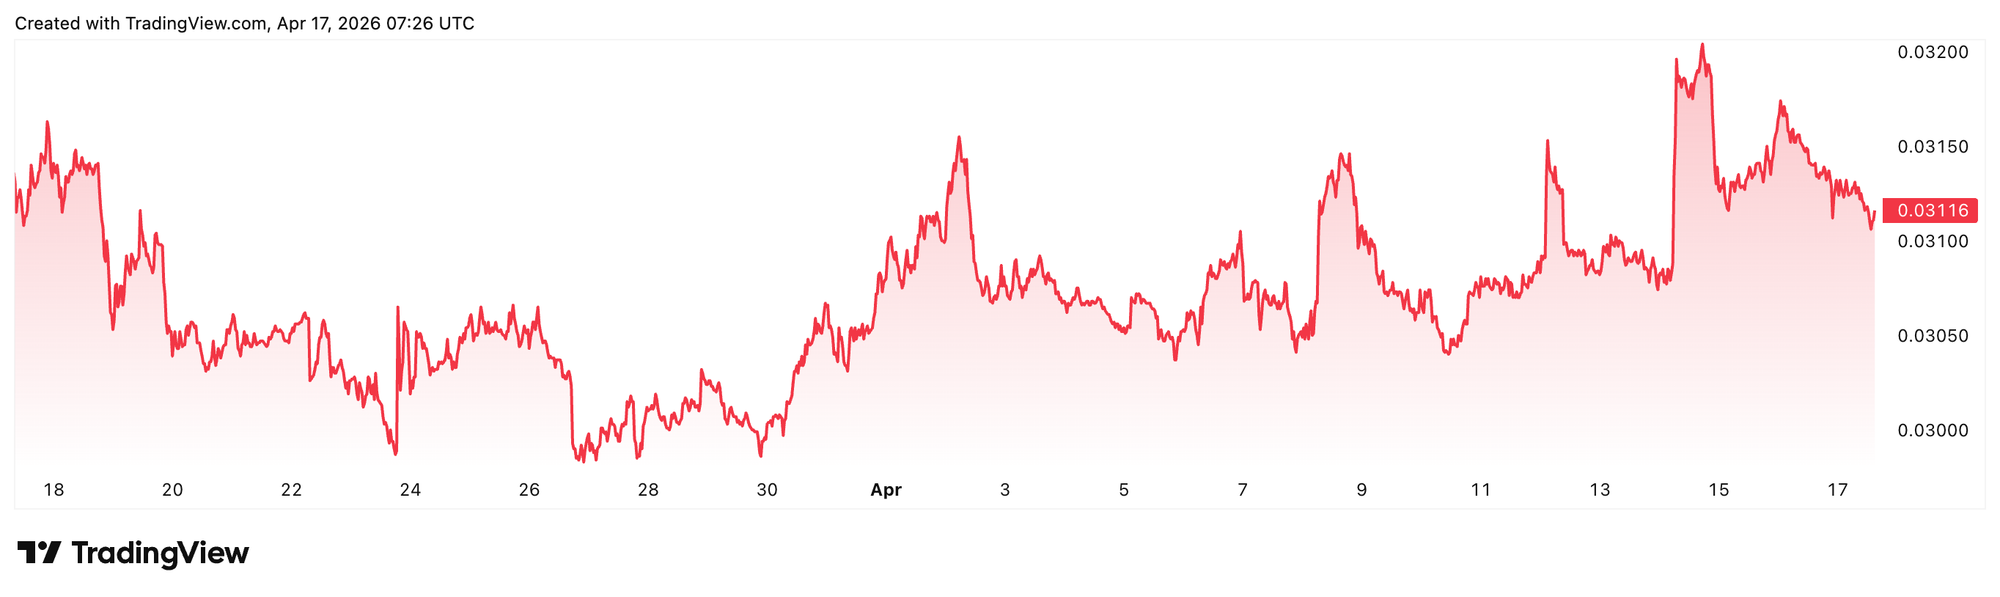
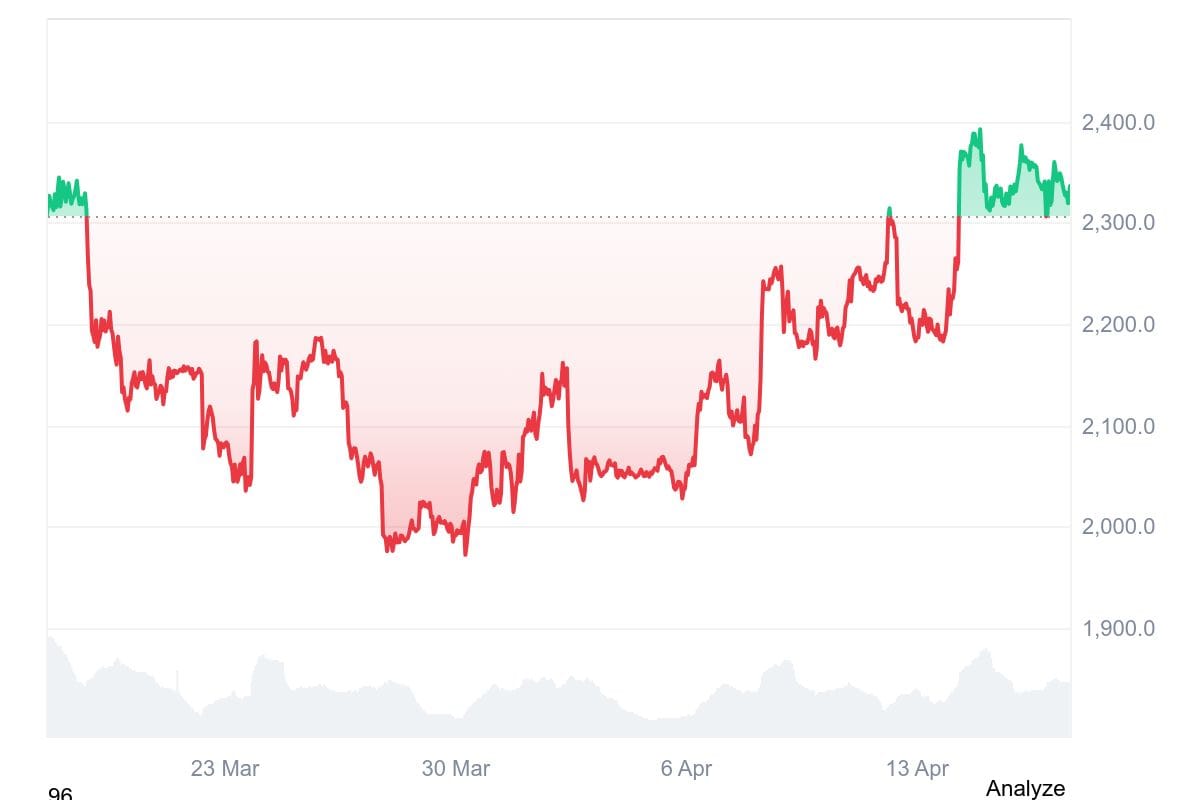
ETH has outperformed Bitcoin on a 7-day basis — ETH up 6.10% vs BTC up 3.94% — but this hasn’t changed the structural picture. The ETH/BTC ratio remains suppressed below the 0.034 resistance level. In the derivatives market, ETH funding rates have dipped below zero, indicating perpetual futures traders are predominantly short. Technical resistance sits between $2,388 and $2,450 (100-day EMA), and ETH/BTC chart – TradingView shows ETH failing to reclaim key levels across multiple attempts in 2026.
ETH briefly touched $2,400 following positive Middle East diplomatic headlines, then retreated, failing to hold even when macro tailwinds aligned. The 7-day outperformance is real. The realized price ceiling at ~$2,308 still acts as a distribution wall, and the path of least resistance on the charts remains lower until the ETH/BTC ratio reclaims 0.034 and funding rates turn positive.
The Opportunity
The divergence between usage and price is what makes this interesting. Ethereum’s onchain activity has completed a three-year recovery – the kind of fundamental recovery that typically precedes price, not follows it. The question is whether Q1’s 200 million figure holds in Q2, and whether growth continues to be driven by genuine onboarding rather than bot activity, which has increasingly dominated stablecoin transaction volume on-chain.
If usage continues to expand and the ETH/BTC ratio breaks above 0.034, the current price setup – ETH at ~$2,328, down 50%+ from its high – could represent a mean-reversion opportunity. If the fee economics don’t improve and the ratio stays suppressed, the usage record becomes a footnote in a different story.
➢ Stay ahead of the curve. Join Blockhead on Telegram today for all the latest in crypto.
+ Follow Blockhead on Google News
Search
RECENT PRESS RELEASES
Related Post


