Exploring the effects of global value chain participation, technological eco-innovation an
May 20, 2025
Abstract
Countries’ participation in the global value chain is significant since it offers them economic benefits. However, the sustainability of life on Earth depends on figuring out how participation in the global value chain affects the environment. Therefore, examining the environmental effects of participation in the global value chain is crucial for the formation, development, or modification of policies concerning nations’ participation in the global value chain. This study aims to examine the influence of variables such as participation in global value chains, technological eco-innovation, natural resource rents, GDP, and population growth on the degradation of the environment in the EU-14 nations. Indicators of environmental deterioration in the research included carbon emissions and ecological footprint. Data on population growth, economic development, carbon emissions, and natural resource rents were all taken from the World Bank database and utilized in the research. Data on ecological footprints, global value chain involvement, and technical eco-innovation were gathered from the Global Footprint Network, the UIBE GVC Laboratory, and the OECD database, respectively. The MMQR approach was used in the research to analyze yearly data for EU-14 nations spanning the years 2007–2021. KRLS and Driscoll-Kraay techniques were also used in the research to assess robustness. The findings indicate that participation in the global value chain across EU-14 nations leads to a decrease in carbon emissions and ecological footprint, resulting in enhanced environmental quality within these countries. Once again, research indicates that in EU-14 nations, technological eco-innovation lowers carbon emissions and ecological footprint. At all quantile levels, it is also discovered that natural resource rents raise carbon emissions and ecological footprint. Additionally, it was discovered that the outcomes of the robustness test agreed with the conclusions drawn. According to the study’s findings, the EU-14 countries should give priority to eco-friendly value chain management techniques in order to maintain environmental quality.
Introduction
Environmental degradation and climate change (hereafter, CC) have taken center stage on the global agenda in recent years. The previous half-century’s tremendous population expansion and rising human requirements (food, housing, etc.) provide the background for these problems1,2. Global production of goods and services has expanded as a result of population expansion and rising human demands, but because of growing energy consumption and the usage of fossil fuels, greenhouse gas emissions (hereafter, GGE) have also skyrocketed3,4. Over time, humanity’s unsustainable mindset has exacerbated environmental deterioration by harming agriculture, water supplies, natural life, and, most importantly, human health5,6. Today, approximately 80% of the global population lives in countries with environmental problems7. Because of this circumstance, it is now essential to assess the degree of environmental deterioration and take appropriate measures to find a solution. One of the most significant markers of CC and environmental deterioration is carbon emissions (hereafter, CE) which measure the quantity of carbon dioxide gas released into the atmosphere as a result of human activity. CE contributes to nearly 72% of global GGE8,9,10,11,12. However, a more thorough evaluation has recently employed the ecological footprint (hereafter, EF), based on the notion that focusing solely on CE does not provide a comprehensive assessment of CC and environmental concerns13,14. The EF, a result of all human activities on nature, refers to the biologically productive land area required for resource consumption and waste absorption in a specific location15,16. The EF encompasses the underlying resource demands of cropland, forests, pastures, fishing grounds, urbanized areas, and carbon sequestration17. Sustainable development goals are incompatible with increases in the EF, such as CE. Governments and policymakers are now more inclined to act to lessen the consequences of CC and cut GGE because of how severe the situation is. In this sense, the Paris Climate Agreement of the United Nations aims to cut GGE by 40–70% by 2050 compared to the pre-industrial period and restrict global temperatures to 1.5 °C18,19,20,21. However, the UN’s 17 Sustainable Development Goals (SDGs), also known as “Agenda 2030�, specifically focus on clean energy, responsible production and consumption, and climate and environmental actions that align with climate targets. In this regard, it offers crucial suggestions to all nations for the sustainable use of natural resources up to 2030 in line with SDGs 8 and 1222. This seeks to prevent the negative effects of material consumption and natural resource depletion on the environment while also guaranteeing that nations will have enough resources in the future.
Environmental issues have escalated in both the EU-14 countries and globally. In this case, diversification and an increase in the amount of economic activity are crucial. Even if there isn’t a significant population increase in the EU-14 countries right now, the 344 million people living there might have an adverse effect on the environment. Since the early 1960s, the average annual growth rate of the EU-14 countries has been around 6%. As of 2021, it has a GDP of about $15 trillion, which is 15% of the global GDP aggregate. Emissions of CO2 totaled 2109 metric tons in the same year. From 1970 to 2004, CE rose from 2604 metric tons to 2898 metric tons, but after 2004, they improved23. According to EF measures, the global EF was 100.25 hectares in 2007 and 75.94 hectares in 202124. In addition to CE, the EF has improved. Considering these factors, even if there have been some positive developments recently for EU-14 nations, more work has to be done to lower CE and EF to lessen the effects of CC and environmental degradation. A more thorough analysis of the factors influencing CE and EF is necessary to accomplish this. Finding the factors that assist EU-14 countries in lowering their ecological footprint and CO₂ emissions, as well as offering suitable policy suggestions for these factors, is the study’s main objective. First of all, the research must incorporate several environmental and climatic parameters since CO₂ only offers a limited understanding of the evaluation of environmental damage and climate change. EF’s inclusion in this context fills in the gaps in the literature by offering a different viewpoint.
The literature has extensively studied several factors in relation to their effects on environmental quality, which in turn affects CE and EF. These factors include economic growth and income increase25,26. technological development and innovation27,28, clean energy use29,30, population growth31, and trade32. This study focuses on how involvement in the global value chain (hereafter, GVC), technological eco-innovation, natural resource rents (hereafter, NRR), economic development, and population growth influence CE and EF in EU-14 countries, in contrast to studies in the literature. The literature for EU-14 countries has not previously examined the relationship between GVC participation and CE, the relationship between GVC participation and EF, how NRR affect CE and EF, how population growth affects CE and EF, and the relationship between technological eco-innovation and EF. In light of these issues, we hope that our study will substantially fill in the gaps in the literature. Given these problems, it is anticipated that this study will offer new information on addressing gaps in the literature and on potential solutions for important stakeholders, including governments and policymakers.
The nations that make up the G-7 represent a significant portion of the global GDP. These nations rank highly among the world’s most developed and are major exporters of high-tech goods. However, it is also clear that these highly industrialized nations contribute to global warming. Countries decrease trade barriers and participate in international trade as a result of globalization. Participation in global value chains is crucial for demonstrating the amount that each country participates in international trade. Participation in global value chains may be crucial for economic expansion, but its effects on the environment are controversial. Testing the impact of global value chain participation on environmental quality within the G-7 is of importance since these nations are both industrialized and heavily engaged in international trade. Given that these nations contribute significantly to the global GDP, it is believed that examining the impact of global value chain participation on environmental quality in these nations would significantly advance the body of study.
We anticipate that certain fundamental results about the effects of GVC participation, technological eco-innovation, NRR, economic development, and population growth on CE and EF outside the EU-14 countries will guide this study. The research on the relationship between GVC and CE began with33,34, and several studies have looked at this relationship from a variety of angles21,35,36. The relationship between GVC and EF has not received much attention18. Instead of being in charge of the full manufacturing process, participating countries in the GVC are in charge of one or a few phases35. Nations can reduce their EF and CE by relocating manufacturing operations that may harm the environment in their own country to other countries. The research does, however, also show that GVCs emit far higher emissions than domestic manufacturing37. While industrialized nations reap the benefits of GVC, its adverse environmental effects disproportionately impact emerging nations. For EU-14, the expectation is that the GVC’s participation will improve environmental quality. Nations’ overuse of natural resource, in addition to GVC, negatively impacts environmental quality. Important contributors to environmental deterioration and CC include NRR or changes in NRR17,38. NRR usually make the environment worse, according to studies that looked at CE39,40,41 and EF17,42,43. Thus, it is plausible that NRR might have a significant impact on the environmental quality of EU-14 nations.
The research highlighted that the use of fossil fuels significantly contributes to the rise in GGE. The primary reason for this is the fast population expansion and rising human demands, which necessitate the production of more goods and services. Increased production and actual economic growth lead to a greater demand for energy and natural resource. Consequently, this circumstance has a detrimental impact on EF levels and CE26,31. The EU-14 countries’ present population numbers and the rapid economic growth they have seen over time have had some detrimental effects on environmental quality. However, technological advancements that allow for more effective and less fossil fuel consumption can minimize or limit the negative consequences of population growth and economic expansion on environmental quality27. New technologies that increase energy efficiency can accomplish the same quantity of production with less energy. This method reduces CE44. Eco-friendly technological advancements are also helping to drastically cut GGE45. As is the case for other countries, we anticipate energy efficiency and eco-friendly technological improvements to restrict CE and minimize GGE in the EU-14 countries.
Examining the variables influencing CE and EF, which serve as measures of environmental quality for the EU-14 from 2007 to 2021, is the study’s main objective, taking into account all of these concerns. The study also fills several significant gaps in the literature. First, as was already noted, the ecological footprint was incorporated into the study due to the fact that CO₂ is not a sufficient criterion for evaluating climate change and environmental damage. There isn’t much research that looks at these two factors at the same time. Filling the gaps in the research in this area requires careful consideration of environmental and climatic factors using two distinct models. Second, the EU-14 has not been the subject of any research in the literature. The effect of GVC, natural resource rent, technological innovation, and population increase on CO₂ and EF for EU-14 countries is not well studied. The literature is seen as needing to offer a new and different perspective on the state of environmental degradation in the EU-14 countries, as well as the climatic and environmental consequences of their current economic development. The primary motivation for our study is all of these issues.
We created two distinct models within the study’s parameters, considering independent variables such as GVC participation, technological eco-innovation, NRR, economic development, and population growth, and dependent variables like CE and EF46. novel method, the Method of Moments Quantile Regression (MMQR), which considers estimates of the impacts of independent variables at various percentiles, is one of the significant contributions to the research gaps. We tested the robustness of the model using the KRLS method and the Driscoll-Kraay estimator47. This highlights yet another significant contribution to the study. Furthermore, It is crucial that the contributions made to the literature by the study have innovative value. The precise position of the EU-14 countries in terms of environmental degradation, the fact that there is a new and different perspective on the environmental and climatic effects of their current environmental degradation, the fact that there is a significant gap in research on the impact of GVC, natural resource rent, economic development, and population growth on CO₂ and EF for EU-14 countries, and the fact that all of these contributions are presented with the most innovative methodologies and estimators reveal the innovative value presented by this study that will shed light on future studies.
The study’s content is outlined below: The second section, which follows the introduction, contains the literature review. This section discusses empirical data pertaining to the relationship between environmental quality and all topics. Here, we describe the relationship between these ideas and environmental quality, supported by empirical evidence. This section is a guide for the results of the study. The third section provides comprehensive descriptions of the methodology and dataset. This section also introduces two distinct models that handle the empirical relationships between variables. The fourth section includes empirical results and discussions on these results, while the fifth section presents conclusions and policy recommendations.
Literature review
Nexus between GVC and environmental quality
GVC is a structure that distributes a product’s production processes globally, rather than centralizing them in a single country. Instead of having complete responsibility for all processes, the countries that are part of this structure are in charge of one or a few production phases35. Companies in different countries now separate the production of goods and services into distinct areas within the framework of comparative advantages due to declining costs and trade restrictions37. Countries participating in the GVC also experience certain environmental effects. Research on the relationship between GVC and CE began with33,34 research. In the literature, there are several investigations in this area36. study, particularly noteworthy when considering recently completed studies, examined the relationships between GVC participation and CE in 12 Regional Comprehensive Economic Partnership (RCEP) countries between 2000 and 2017. We separately examined the study’s findings at the country and industry levels, using panel data and spatial econometric analysis methodologies. First, GVC forward participation decreased CE by enhancing production technologies, but backward participation raised CE by expanding trade size, according to the country-level data. In terms of spatial effects, backward participation raised CE in the host country, whereas forward participation decreased CE in both the host and neighboring countries. At the industry level, high- and mid-tech manufacturing and productive service industries have decreased CE more than other industries due to increasing forward participation of GVCs in these industries. Low-tech manufacturing industries have seen a greater growth in CE than other industries due to the increased backward participation of GVCs48. examined the effects of GVC participation on CE in 62 countries between 1995 and 2011. Both the panel random and fixed effects models reveal an inverted U-shaped relationship between GVC participation and CE. This is true for the whole economy or for a group of industries. However, we anticipate a decline in CE in countries with low incomes or low levels of GVC participation in the short to medium term. Based on quarterly data from 1995Q1-2014Q2, the study by Assamoi et al. (2020) examined the effects of participation in GVCs on CE in 11 Asian countries. The study used cointegration and causality tests, particularly FMOLS and DOLS, to analyze this relationship. The findings demonstrate that increased GVC participation lowers CE. Similarly, while increasing growth and energy consumption have also resulted in more CE, trade openness has also driven down CE. In the top ten emitters of CO249, investigated the effects of GVC on the environment from 1995 to 2018. Pooled mean group ARDL (PMG-ARDL) and Granger causality tests form the basis of the empirical investigation. The results showed that, over time, GVC has a detrimental effect on energy consumption, economic growth, and environmental quality. On the other hand, environmental quality improves as economic complexity and financial development rise. There is evidence of short-term causality running from CO2 to economic complexity and from GVC to CO2. Long-term findings demonstrate a bidirectional causality between GDP, energy consumption, financial development, economic complexity, and GVC.
There is research that looks at the relevant mechanism within the context of GVC and EF, in addition to the relationship between GVC and CE. However, the literature provides relatively little information about the relationship between GVC and EF. There are more studies based on carbon footprints than EF. The research by16 is one of the few that focuses on the relationship between GVC and the EF. This study uses panel data from 53 countries to examine the effects of agricultural GVC location on EF for the years 1995–2018. As the agricultural GVC position improved, the EF decreased, according to the results of the comparative panel regression study. Another study, which examined heterogeneity, found that an improvement in the agricultural GVC position had a greater negative impact on the environmental impact of middle- and low-income countries. Another study by50 used hierarchical structural decomposition analysis to look at the factors that affected changes in the carbon footprints of multinational corporations. They used data from 34 industries and 59 countries (36 OECD and 23 non-OECD) from 2005 to 2016 to do this. The study’s conclusions demonstrated that the distribution of GVC production networks and the carbon footprints of multinational firms match. Furthermore, economies closely linked to GVCs have made encouraging progress in lowering domestic CE51. also examined the emissions caused by China-US trade in 189 countries and 26 sectors in the period 1996–2015, based on the GVC perspective. The fundamental technique for analyzing the relationship is the hypothetical extraction method (HEM). According to the findings, Chinese exports to the US have mostly raised CE in China and the US, as well as in Asian, European, and African countries, whereas US exports to China have primarily raised CE in Asian, European, and North American countries.
Nexus between natural resource rent and environmental quality
Environmental deterioration is also significantly influenced by NRR. NRR are the difference between a commodity’s price and its average cost of production. Because natural resources are scarce, intense exploitation of them always yields profits that are far higher than their costs. Total NRR are the sum of oil rents, natural gas rents, coal rents, mining rents, and forest rents23. Abuse of natural resources can lead to negative environmental and climatic effects, as well as the depletion of a country’s current capital reserves. Numerous studies have looked at the relationship between the EF and NRR, as well as the relationship between NRR and CE. There is substantial evidence that the NRR raises CE39,42,52. The study by39 examined the relationship between environmental quality and the volatility of natural resource commodity prices in the G-7 countries between 1990 and 2020. In the study, the indicator of environmental quality is CE. They employed methods of Moment Panel Quantile Regression (MMQR), panel cointegration, and panel causality. Empirical results showed that natural resource commodity prices harm environmental quality by increasing CE levels in all three quantiles (Q0.25, Q0.50, and Q0.75). On the other hand41, used data from the E-7 countries to examine the relationship between CE and the NRR for the years 1990 to 2018. To investigate these relationships, the study employed Driscoll-Kraay fixed effect-OLS estimators and panel quantile regression. The findings showed that coal and natural gas rent positively impact CE. However, oil rent has negatively affected CE52. examined the relationship between globalization and CE from 1996 to 2017, again focusing on G-7 countries and accounting for NRR. They used the CS-ARDL method for both short- and long-term empirical results. Empirical findings indicate that natural resources, in addition to economic globalization, also contributed to an increase in CE. However, the research recommended implementing measures to reduce CE over a longer time frame than a year or so.
After scrutinizing the research on the relationship between NRR and CE43, also explore the relationship between NRR and EF. Based on the time series of the South African economy43, investigated the impact of changes in the price of natural resources on the EF from 1975 to 2019. Mineral resource rent was used as a proxy instead of NRR. The findings indicate that mineral resource rents increase the EF within NRR. Causality testing has also verified this. The study by14 attempted to ascertain the impact of renewable energy, NRR, and foreign direct investment (hereafter, FDI) on the EF level in China between 1990 and 2017. FMOLS, DOLS, CCR, and spectral causality techniques were used to estimate these relationships. The findings indicated that the utilization of renewable energy sources and NRR facilitated long-term EF reduction. Yet, the same findings indicated that FDI increased China’s EF17. conducted another study on the subject. This study, which used data sets from 17 Latin American countries, examined the relationship between environmental deterioration and the EF between 1980 and 2016. A number of factors, including NRR, influence the EF. Natural resource rents’ impact on the EF is heterogeneous across the distribution, according to the panel quantile regression method’s findings. Researchers have noted that the EF in the lower percentiles increases with the degree of inequality in the utilization of the region-specific climatic distribution of natural resources, while it decreases at the same rate in the upper percentiles. For the 15 countries that use the most renewable energy worldwide41, looked at the non-linear relationship between EF, NRR, and renewable energy use from 1996 to 2018. The Panel Smooth Transition Model framework examined non-linear relationships. The findings indicate that EF and NRR have a positive relationship, whereas the use of renewable energy has a negative relationship in both low and high regimes53. attempt to identify the basic relationship between natural resource rent, financial development, global value chain involvement, and their combined effects on environmental footprints in 60 chosen countries between 1996 and 2018. The “Quantile Autoregressive Distributed Lag Model� is a modern and new technique employed in this study. According to the study’s findings, more participation in the global value chain, improved financial development, and larger natural resource rents all contribute to environmental deterioration at various quantiles in the chosen economies.
Nexus between GDP, population and environmental quality
Increases in population and economic growth are significant contributors to CC. In the end, rising demands and population growth call for higher output levels. Increased productivity and actual economic growth lead to a greater demand for energy and natural resources. Therefore, this condition also affects EF levels and CE levels25. looked at how economic growth affected CE in the context of the Turkish economy from 1980 to 2016. As demonstrated by the ARDL method’s results, economic growth raises CE levels over the long and short terms. The Toda-Yamamoto causality test results also revealed that the relationship runs from growth to CE54. used data from 1971 to 2014 to investigate how economic growth affected CE in oil-exporting nations. The study’s conclusions supported the environmental Kuznets curve’s validity for nations that export oil. According to the causality results, there is a bidirectional causality between economic growth and CE. Within the context of EF26, investigated a comparable relationship. The findings for Pakistan from 1974 to 2017 show that the country’s EF grew as a result of economic growth. The linear ARDL method and linear Gaussian model were used to examine the relationships between variables. The shared outcome of two investigations, conducted at different times and in separate countries, was the same for both Pakistan and Turkey55. study highlights the environmental effects of India’s economic and financial growth by investigating the complex relationships between economic growth, financial development, ecological footprint, and carbon emissions. The study employs a Vector Error Correction Model (VECM) to ascertain the short-term and long-term cointegration relationships between these variables, spanning the years 1990 to 2022. The Granger causality test based on VECM demonstrates a substantial long-run relationship between economic growth, financial development, ecological footprint, and carbon emissions. In addition, the findings suggest a positive correlation, indicating that carbon emissions increase in tandem with economic growth, financial development, and ecological footprint.
56 also examined a similar relationship for African countries. The research accounted for the impacts of population expansion even though its primary focus was on the relationship between FDI and CE. The results of two-stage least squares (2SLS), fixed effects, and GMM estimates for the years 1990–2020 demonstrate how complicated the relationship between population increase and CE. Therefore, policymakers should prioritize FDI investments that align with carbon-neutral growth by investing in human capital and maintaining a balance between sustainability and population expansion57. looked at Russia’s EF links and demographic shifts between 2000 and 2021. According to estimation results from FMOLS, DOLS, CCR, and ARDL, economic biodiversity losses would occur from rising urbanization levels and population growth. Based on the utilization of natural resources, it is evident that population and economic growth have a detrimental impact on environmental indicators like CE and EF and consequently contribute to CC. Using static panel estimation techniques and annual data from 2000 to 202258, reexamine how population growth and energy consumption affect emissions and whether this interaction lessens or increases the impact of energy consumption on emission persistence for 24 African countries. The results of a panel data study show that carbon emissions fall as energy usage rises. Population growth, on the other hand, reduces both the permanency and the positive impact of energy use on carbon emissions.
Nexus between technological eco-innovation and environmental quality
Due to increased growth and production levels, technological advancements raise the need for energy. Despite the benefits of growth, countries whose industrial methods rely on the use of fossil fuels also incur costs such as GGE and environmental degradation45,59,60. However, because of technological advances and eco-friendly technologies, manufacturing practices that save energy and resources help lessen negative impacts on the environment and climate by reducing dependency on non-renewable resources and other fossil fuels61,62. Studies in the literature have also provided support for this scenario. In nine countries in West Asia and the Middle East between 1990 and 201728, also investigated the effects of technological innovations on the EF. The study that employed panel cointegration and panel causality methodologies found that the EF decreases as technological eco-innovation increases. Furthermore, research reveals a bidirectional causal relationship between technological eco-innovation and EF. Therefore, in order to increase the degree of technological eco-innovation for both ecological sustainability and sustainable development, more funding should be allocated to research and development. For the top ten manufacturing countries between 1990 and 202045, used the MMQR approach to investigate the effects of technological advancement and renewable energy on energy efficiency and carbon neutrality. The results revealed a positive and significant role of technology in reducing GGE.
63 conducted research that examined the effects of technological innovation on ecological sustainability in the top SDG countries between 1994 and 2018 using the load capacity factor as a framework. The MMQR findings for various quantiles demonstrated that technological eco-innovations significantly lower the load capacity factor64. studied the impacts of air transportation, globalization, environmental taxation, and green innovation on the EF between 1994 and 2020 in the first of two studies based on G-7 countries. The results obtained using the MMQR method showed that the role of green innovation in reducing environmental pollution is quite significant. The combination of green innovation with air transportation has lowered environmental pollution, despite the fact that it increases emissions. This situation shows the importance of making comprehensive investments in eco-friendly technologies. In their second research62, examined the relationship between information and communication technologies, economic complexity, technological innovation, renewable energy, and EF using data from 1990 to 2020. This study focused on G-7 countries.The MMQR findings showed that technological progress prevents EF at all quantile levels.
The state of art of the review and suggestions for future research
This part examines studies conducted after 2020 to address recent advancements in the literature and provide guidance for future research. In the introduction and literature review sections, five factors that impact environmental quality are considered. First, GVC’s effects on CO236,51 and GVC’s effects on EF16 were looked into. More agricultural GVC16 and forward links36 are good for the environment, according to a number of studies from different times and groups. However, trade between the US and China had a different outcome. China’s exports to the US raise CO2 emissions not just in China but also in Asian, European, and African countries. On the other hand, US exports to China increase CO2 emissions in Asian, European, and North American countries51. Second, following 1990, the majority of research on the impacts of NRR on CO2 and EF examined the topic14,41,42. Research has concentrated increasingly on the relationship between EF and NRR. In the quantile regression framework for Latin American countries and the oil rent framework for E-7 countries41, NRR raises environmental deterioration in the lower percentiles. Long-term ecological footprint reduction in China has been facilitated by the utilization of renewable energy sources and the rental income from natural resources14. Incorporating non-linear relationships in addition to linear interactions yielded different results. The Panel Smooth Transition Model framework demonstrated a positive relationship between ecological footprint and natural resource rent at both low and high levels42.
GDP growth and population growth also negatively affect environmental quality. This condition is further supported by the results explicitly obtained for Russia57, Pakistan26, and Turkey2754. study, which examined the group of oil-exporting countries, found a two-way relationship between GDP growth and CO2. In the group of African countries, positive developments in human capital levels were highlighted as the basic condition for population growth to positively affect environmental quality56. Recent years have also emphasized the impact of technological innovation on environmental quality. New technologies and inventions have a positive effect on both CO2 and EF levels, according to research done across a variety of time periods and nations28,45,62,64. Technology advancements also improve environmental quality across all quantiles, according to the results of the current MMQR approach. The main reasons for this are the rise of manufacturing methods that use less energy and resources, thanks to new technology and inventions that are better for the environment, and the fall in dependence on fossil fuels and nonrenewable resources.
The main question of this research is how and in what direction GVC and NRR will impact environmental quality in the EU-14, based on trends in the literature. The effectiveness of the MMQR method, one of the most recent and innovative approaches, in describing environmental quality is another research question. There are a few significant research gaps in the examined literature. The first research gap is the lack of consideration for the opinions of EU-14 countries. Second, the literature has only examined environmental quality metrics in terms of CO2 or EF. No research has combined the two factors. This study fills these gaps in the literature. However, we recommend that future studies address more research gaps. Among the study gaps, future studies should also include environmental quality metrics as material and water footprints. In terms of environmental quality, it is thought that country-specific legal and institutional regulations, the impact of bilateral trade between countries on regional and global environmental quality, and taking into account environmental quality within the framework of non-linear relationships are all crucial in addressing the research gaps.
Data and methodology
The goal of this research is to look at how the EU-14 countries’ CE and EF are affected by participation in the GVC, technological eco-innovation, natural resource rents, economic development, and population expansion. Data from 2007 to 2021 are utilized for the EU-14 nations (Denmark, France, Greece, Italy, Netherlands, Spain, Austria, Finland, Germany, Republic of Ireland, Luxembourg, Luxembourg, Portugal, Sweden, and Belgium). The study’s dependent variables are the CE (Appendix A has a map showing the average carbon emission values for each EU-14 nations from 2007 to 2021) and EF (Appendix B has a map showing the average ecological footprint values for each EU-14 nations from 2007 to 2021). The study’s independent variables—participation in the GVC, technological eco-innovation, natural resource rents, economic development, and PG—are represented by two distinct models. Table 1 shows the study’s variables along with their description and source65,66.
The Model I and Model II created for the research are as follows:
Model I:
CO2it = αi + β1 GVCPit + β2 TEIit + β3 NRRit + β4 GDPit + β5 POPGit + εit.
Model II:
EFit = αi + β1 GVCPit + β2 TEIit + β3 NRRit + β4 GDPit + β5 POPGit + εit.
Two models were developed in the research because carbon emissions and ecological footprint are two distinct environmental degradation indicators. The acronyms for carbon emissions, ecological footprint, GVC participation, technological eco-innovation, natural resource rents, economic development, population growth, and error term are CO2it, EFit, GVCPit, TEIit, NRRit, GDPit, POPGit, and εit, in that order.
Bar charts are shown in Fig. 1 to illustrate how variables have changed over time within the data range and across the nations that were part of the study.
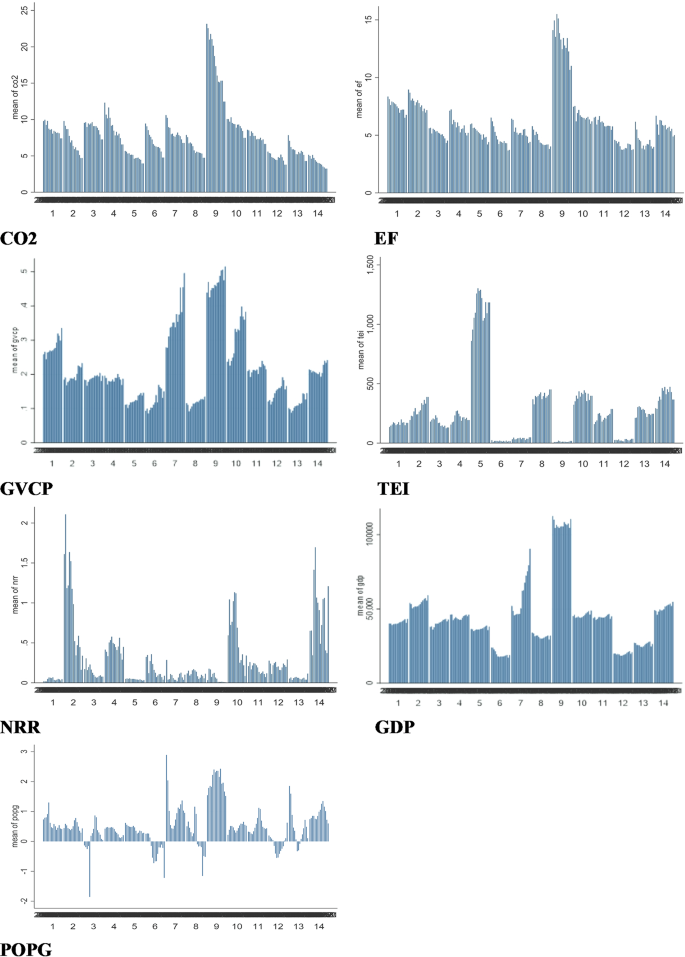
Bar Charts of the Variables. Note: 1 represents Belgium, 2 represents Denmark, 3 represents Germany, 4 represents Finland, 5 represents France, 6 represents Greece, 7 represents Ireland, 8 represents Italy, 9 represents Luxembourg, 10 represents Netherlands, 11 represents Austria, 12 represents Portugal, 13 represents Spain, 14 represents Sweden.
A novel approach of Moments Quantile Regression (MMQR) has been used in this work46. created the MMQR method. The use of this econometrics analytical technique highlights the need for empirical modeling and estimate to account for the possibility of causal effects occurring across different quantiles or not67. The MMQR estimation technique is particularly helpful when the panel data model comprises endogenous explanatory factors and is combined with individual effects40. When compared to the ordinary least squares (OLS) approach, which only estimates the mean effect of the independent variables on the dependent variable, this methodology yields findings with even higher precision68. Several of the disadvantages of conventional regression models, including FMOLS and AMG, are addressed by the MMQR model46,69,70,71. With non-normal data, outliers, weak correlations, and non-parametric distributions, it produces reliable findings71. The MMQR model provides reliable estimates in nonlinear circumstances when compared to other nonlinear models72. This approach allows one to estimate the conditional quantiles based on conditional means by combining predictions of the location and scale functions73. It links explanatory factors to quantiles of dependent variables to produce findings, and it is resilient to heterogeneity, normality, outliers, and endogeneity74.
The conditional quantile model may be described as follows using estimations of the scale and location parameters:
Regarding the conditional quartile (:Q_tau(tau | textA_it))
The parameters that need to be estimated are ß, µ, (:acuteomega), and (:phi:). Also included is the probability that (:left(acuteomega_i+text`P’_it phi:right)) and equals 1. As the individual fixed effect, the discrete “iâ€� is used. The converted element “P,â€� denoted by the letter f, displays the selected elements of A’s k-vector as follows:
Since (:ddotrm A_it) shows an independent and consistent distribution for every “f,� time (t) has no effect on it. To satisfy the moment requirements of MMQR, (:mathcalE_it) must be appropriately orthogonally normalized to (:textA_it) and re-distributed across the individual’s “f� at time (t). Once the equation is modified, the following equation is produced:
The vector parameters of the independent variables, GVCP, TEI, NRR, GDP, and POPG, are shown as (:ddotrm A_it), and the quantile distribution of the dependent variables, (:CO2_it) and (::EF_it), are defined as (:Q_tau:left(tau:|textA_itright)). The sample quantile, such as (τ − th), represents the function of q(τ). The optimization issue may be derived using the following:
The function of verification is shown as follows in the equation:
In order to provide more confidence to the empirical findings derived from the research, the robustness of the MMQR outcomes has been investigated using the methods of Kernel-Based Regularized Least Squares (KRLS) and Driscoll-Kraay estimator in the present work75. presented the KRLS, a machine-learning approach to regression analysis. Regression analysis without predetermined assumptions and requirements is made possible by this approach76. Because the parameters of the KRLS model are provided as the average derivatives of the better fitted model, it is more robust against misspecification77. We also use the Driscoll-Kraay estimator, which has the benefit of accounting for heteroscedasticity and cross sectional dependence.
Figure 2 shows the study flow that we used for the investigation in phases.
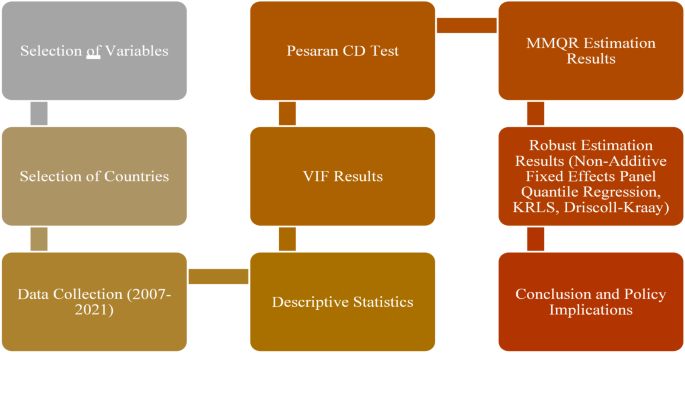
Flow of study. Source: Author’s drawings.
Results and discussion
The results of the analysis are presented in this section of the research. We will begin by giving some background information on the variables included in the research. The descriptive statistics for the variables in the study are shown in Table 1. For each variable, 210 observations are available. It has been determined what the mean values are for each of these variables: the CO2 variable is 7.727361, the EF is 6.149381, the GVCP is 0.2179609, the TEI is 266.76, NRR is 0.2821424, GDP is 44339.61, and the POPG variable is 0.5101758. The standard errors for each variable are as follows: 3.514983 for CO2, 2.328527 for EF, 0.1051557 for GVCP, 281.1528 for TI, 0.368733 for NRR, 21289.59 for GDP, and 0.6697201 for POPG. Table 1 also displays each variable’s minimum and maximum values. At a significance level of 0.01 the data for CO2, EF, GVCP, TEI, NRR, GDP, and POPG significantly deviate from a normal distribution, according to the Jarque-Bera (J-B) normality test.
Once the descriptive statistics of the variables in Table 2 have been examined, the multicollinearity issue is investigated using the VIF test. Table 3 displays the outcomes of the VIF test. If the VIF is more than 10, there is cause for concern78,79. Tolerance below 0.1 indicates a serious problem80. Analysis of the data reveals that the variables’ VIF values are less than 10 and the tolerance values surpass 0.10. Thus, it is easy to draw the conclusion that multicollinearity is not a problem.
We evaluate the cross-sectional dependence among several cross-sections using the Pesaran (2004) CD test. Results from the Pesaran CD (2004) test, which are shown in Table 4, show that all of the data—aside from POPG—have cross-sectional dependency.
The next stage is to conduct the analysis using the MMQR technique after the presentation of the descriptive statistics, VIF test results and Pesaran CD (2004) test findings. The MMQR results for Model I and Model II are shown in Table 5.
The results for Model I will be interpreted first, as shown in Table 5. Examining the results demonstrating the relationship between GVCP and CO2 for Model I, it is evident that a negative relationship is found between the variables. At the 1% significance level, the results for every quantile are statistically significant. With greater participation in GVC, CE are declining in the EU-14. It is discovered that technological eco-innovation decreases CE when the results demonstrating its impact on CE in the EU-14 nations are examined. Results were found to be statistically significant at all medium and high quantile levels (0.40, 0.50, 0.60, 0.70, 0.80, 0.90). The results of the study examining the link between CE and natural resource rents imply that in the EU-14, natural resource rents raise CE. Results were found to be statistically significant at every quantile level. Analysis of the data demonstrating the relationship between the GDP and CO2 variables reveals that, in the majority of quantiles (0.20, 0.30, 0.40, 0.50, 0.60, 0.70, 0.80, 0.90), the variables have a positive relationship. Nevertheless, only specific quantiles (0.80, 0.90) show statistical significance in the results. POPG boosts CE, according to an analysis of data showing how emissions are affected by POPG in the EU-14. For the low quantiles (0.10, 0.20, 0.30) and part of the medium quantiles (0.40), the results are statistically significant.
In Table 5, the MMQR results for Model II are also included. Considering the outcomes of the effects of GVCP on the EF of the EU-14 countries, it is shown that GVCP decreases the EF. All quantile levels have results that are statistically significant. Analysis of the results demonstrating the relationship between the TI and EF variables reveals a negative relationship for all quantile levels. The results exhibit statistical significance for most of the quantiles (0.30, 0.40, 0.50, 0.60, 0.70, 0.80, and 0.90). It is discovered that NRR raises EF when the results demonstrating the influence of the NRR on EF for the EU-14 nations are examined. All quantile levels show statistical significance in the results. Assessing the results, it can be shown that there is a positive relationship at all quantile levels between EF and economic development. However, only at high quantile values (0.70, 0.80, 0.90) were statistically significant results achieved. POPG increases the EF at all quantile levels in EU-14 countries, according to the results demonstrating the link between POPG and EF variables. Except for the result for the 90th quantile level, all of the quantile level results are statistically significant.
Robustness tests are the next step after analyzing the results of the MMQR technique. Analyses were conducted for this objective utilizing the Non-Additive Fixed Effects Panel Quantile Regression, Driscoll-Kraay and KRLS techniques. First, the Non-Additive Fixed Effects Panel Quantile Regression approach was used for robustness. This method was developed by81. Even in the small T situation, this method’s ability to provide consistent estimates is an important advantage81. Table 6 displays the results achieved using this technique.
First, it is significant to notice that the results obtained from the analysis of the model in which CO2 is the dependent variable are in agreement with the MMQR findings. The results are statistically significant and show a negative relationship between GVCP and CO2 variables for low, medium, and high quantile values. For all quantile levels, it was discovered that TEI had a negative impact on CO2. For all quantile levels, it was discovered that TEI had a negative impact on CO2. For every quantile level, the findings are also statistically significant. The outcomes produced for the low and medium quantile levels are statistically insignificant when discussing the findings demonstrating the association between carbon emissions and natural resource rents. Natural resource rents are shown to increase carbon emissions, and only the results derived at the high quantile level are statistically significant. In the EU-14, CO2 rises in tandem with GDP, according to another finding. For each quantile level, the results are statistically significant. For low and medium quantiles, the results demonstrating a relationship between population growth and carbon emissions are statistically significant. In the EU-14, environmental pollution increases in line with population growth.
Analysis of the results for Model II, in which EF is the dependent variable, reveals that they are in consistency with the MMQR results. In EU-14 nations, it is discovered that carbon emissions fall when global value chain participation rises across all quantile levels. These results are statistically significant at quantile levels that are low, medium, and high. Assessing the results, it was discovered that all quantile levels had a negative relationship with the TEI and EF variables. All quantile levels show statistically significant results. Analysis of the data demonstrating how natural resource rents, GDP, and population expansion affect ecological footprint in EU-14 nations reveals that ecological footprint is increased by these variables. Additionally, at the low, medium, and high quantile levels, these results are statistically significant.
Table 7 presents the average pointwise marginal effect findings obtained from the KRLS. Firstly, the results for Model I will be presented. Table 7 shows that the calculated R2 is 0.9135, meaning that 91.35% of the variance in CE can be explained by participation in GVC, technological eco-innovation, natural resource rents, GDP, and POPG.
Furthermore, it is evident that GVCP and technological eco-innovation have a statistically significant negative marginal impact on CE in the EU-14. Also, in EU-14 nations, NRR and GDP have a statistically significant positive marginal impact on CE. It was also discovered that the POPG variable had a negative marginal influence on the CO2 variable, although this result was deemed statistically insignificant. The results show that the MMQR and KRLS findings for Model I are consistent with one another.
Table 7 also contains the results obtained for Model II. Table 7 demonstrates that the R2 is 0.9396, indicating that GVCP, technological eco-innovation, NRR, GDP, and POPG can account for 93.96% of the variation in EF. Additionally, it is clear that GVCP has a statistically significant negative marginal effect on EF within the EU-14. Moreover, NRR, GDP, and POPG have a statistically significant positive marginal impact on EF in the EU-14 nations. While the result is statistically insignificant, TEI has a negative marginal impact on EF. It can be seen from the evidence that the KRLS and MMQR results for Model II are very similar.
Following the robustness analyses using the KRLS approach, a second robustness test was conducted using the Driscoll-Kraay method. Table 8 displays the results of the Driscoll-Kraay approach for Model I and Model II.
It is evident from a review of Table 8 that the results obtained using the Driscoll-Kraay estimator are essentially in line with the results obtained using the MMQR approach. It is discovered that the GVCP has a negative impact on both EF and CO2. It is also noted that the result is statistically significant. A positive relationship may be seen when examining the link between the NRR and CO2 variables. Looking at the findings for Model II, it was determined that NRR positively affected EF, similar to Model I. Analyzing Model II’s results, it was found that, like Model I, NRR had a positive effect on EF. Examining the data demonstrating how POPG affects CO2 and EF, it is evident that population expansion increases EF and CE. Only for Model II, however, is the result obtained statistically significant. Results demonstrating how economic expansion affects EF and CE reveal that these two variables increase with economic expansion. The results for Model II and Model I, however, are not statistically significant. It has been shown that technological eco-innovations lessen CE and the EF when their impacts on EF and CO2 are considered. Nevertheless, neither Model I nor Model II’s results are statistically significant.
Conclusion and policy implications
Conclusion
As the impacts of CC become more apparent, there is a global push to enhance environmental quality. A major reason for optimism about the global sustainability of the environment is the signature of the Paris Climate Agreement. In addition to this, studies on the factors that contribute to environmental deterioration have become more significant. Therefore, the goal of this research is to look at how the EU-14 countries’ CE and EF are affected by GVCP, technological eco-innovation, natural resource rents, economic development, and population expansion. Annual data for EU-14 nations for the period 2007–2021 are utilized in the research in order to meet the stated goal. MMQR analysis was also done in the research in addition to all of these. Furthermore, Driscoll-Kraay estimators and the KRLS technique were used as robustness tests. Examining the study’s results reveals that participation in the GVCP decreases EF and CE in the EU-14 countries. Natural resource rents increase the CE and EF in the EU-14. It was discovered that technological eco-innovation decreases EF and CO2. CE and the EF have been observed to rise with economic development. EF and CO2 have also been reported to rise with population expansion.
It is evident that some of the results from related research in the literature are consistent with the findings demonstrating the impact of participation in the GVC on CE in the EU-14 countries35,36,82,83. The literature also contains opinions that GVC participation has different impacts on developed and developing economies, with developed nations seeing a considerable reduction in CO2 emissions from GVC participation, while developing economies experience a significant rise in CO2 emission intensity84. Taking into account that the EU-14 member states are developed nations as well, it can be concluded that the results of this research agree with84. Participation in GVCs has a good impact on the environment since it reduces CO2 emissions by bringing greener technology and inputs to the EU-14 nations where the manufacturing takes place. Because there are so few studies on the topic in the literature, the conclusions of how GVCP affects the EF in the EU-14 countries are not comparable. Participation in the GVC may encourage the EU-14 member states to embrace new industrial techniques, which can result in higher energy efficiency and lower waste. As a result of these nations’ greater participation in the GVC, their EF may decrease. It was concluded from the research that technological eco-innovation slows down environmental deterioration, and these conclusions are in line with those of other studies that have looked at the same topic in the literature19,85,86,87,88. The preference for environmentally friendly technology is leading to an improvement in the quality of the environment in the EU-14 nations. Assessing the results of the study to how NRR affects environmental quality, it seems that some of the findings from the research reported in the literature are consistent with the findings89,90,91,92. It might be said that the EU-14 nations’ excessive and unsustainable resource consumption would exacerbate environmental deterioration.
Participation in the global value chain is one of the components that determines a nation’s economic growth. As a result, it follows that EU-14 nations should likewise participate in global value chains. Furthermore, EU-14 nations play a significant role in international trade. However, the nations of the EU-14 must keep their promises regarding environmental sustainability. This study has a significant impact in lowering worries that global value chain participation will have a detrimental effect on environmental quality in EU-14 countries since it examines for the first time how global value chain participation affects environmental degradation indicators for EU-14 countries. To reiterate the study’s conclusions, EU-14 nations’ environmental quality is improved by global value chain participation.
Policy implications
The EU-14 nations should prioritize environmentally friendly value chain management methods in order to ensure environmental quality, according to the study’s conclusions. Firms should make sure that they monitor and disclose the carbon footprint in the value chain in order to support legislation that promote environmental sustainability. It is important to prioritise investments in eco-friendly technology and to provide incentives for innovative green solutions. To harmonize sustainability requirements in the global value chain, there should be a greater degree of international collaboration. Carbon emission guidelines may be implemented for value chain organizations as a means of encouraging environmental quality. There should be more options for green finance for eco-friendly initiatives. It is critical that raw material and component procurement be done with environmental sustainability in mind when a company participates in the GVC. Once again, when it comes to manufacturing and assembly phases of participation in the GVC, environmental quality should not be disregarded. The EU-14 should promote the use of renewable energy sources and place a strong focus on sustainable resource management.
The data restriction is the main drawback of this research. The long-term relationship among the variables could not be examined due to the limited data. The limitations on the data also affected the study’s methodology choices. The removal of data constraints related to global value chain participation or the development of new indicators related to global value chain participation may make it possible for future studies to look at the long-term relationship between variables. It is possible to perform this analysis for other or comparable nations.
Data availability
The data that support the findings of this study are openly available in World Development Indicators, The World Bank at https://databank.worldbank.org/source/world-development-indicators and in OECD at https://data.oecd.org/ and in UIBE GVC Laboratory, at http://gvcdb.uibe.edu.cn/ and in Global Footprint Network at https://data.footprintnetwork.org/.
References
-
United Nations. World Population Prospects, (2022). https://www.un.org/development/desa/pd/content/World-Population-Prospects-2022. Accessed 20 Dec 2023.
-
Samour, A. et al. Assessing the effect of real estate market and renewable energy on environmental quality in Belgium. OPEC Energy Rev. 47 (2), 148–159. https://doi.org/10.1111/opec.12276 (2023).
-
Jahanger, A., Hossain, M. R., Usman, M. & Onwe, J. C. Recent scenario and nexus between natural resource dependence, energy use and pollution cycles in BRICS region: does the mediating role of human capital exist? Resour. Policy. 81, 103382. https://doi.org/10.1016/j.resourpol.2023.103382 (2023b).
-
Onwe, J. C., Uche, E., Dhayal, K. S., Uwazie, I. U. & Ashibogwu, K. N. Advocating green economy in India: the tug of war among income inequality, export diversification, and environmental quality. Sustain. Dev. https://doi.org/10.1002/sd.2927 (2024a).
-
Onat, N. C. & Kucukvar, M. Carbon footprint of construction industry: A global review and supply chain analysis. Renew. Sustain. Energy Rev. 124, 1–16. https://doi.org/10.1016/j.rser.2020.109783 (2020).
-
Samour, A., Onwe, J. C., Inuwa, N. & Imran, M. Insurance market development, renewable energy, and environmental quality in the UAE: novel findings from a bootstrap ARDL test. Energy Environ. 35 (2), 610–627. https://doi.org/10.1177/0958305X221122928 (2024).
-
Onwe, J. C., Bandyopadhyay, A., Hamid, I., Rej, S. & Hossain, M. E. Environment sustainability through energy transition and globalization in G7 countries: what role does environmental tax play? Renew. Energy. 218, 119302. https://doi.org/10.1016/j.renene.2023.119302 (2023).
-
Tol, R. The marginal damage costs of carbon dioxide emissions: an assessment of the uncertainties. Energy Policy. 33 (16), 2064–2074. https://doi.org/10.1016/j.enpol.2004.04.002 (2005).
-
Oliver, J., Janseens Maenhout, G., Muntean, M. & Peters, J. Trends in Global CO2 Emissions; 2016 Report, the Hague: PBL Netherlands Environmental Assessment Agency (European Commission, Joint Research Centre, 2016).
-
Chen, J., Xu, C., Cui, L., Huang, S. & Song, M. Driving factors of CO2 emissions and inequality characteristics in China: a combined decomposition approach. Energy Econ. 78 (1), 589–597. https://doi.org/10.1016/j.eneco.2018.12.011 (2019).
-
Adams, S. & Acheampong, A. O. Reducing carbon emissions: the role of renewable energy and democracy. J. Clean. Prod. 240, 118245. https://doi.org/10.1016/j.jclepro.2019.118245 (2019).
-
Kastratovic, R. Impact of foreign direct investment on greenhouse gas emissions in agriculture of developing countries. Aust J. Agric. Resour. Econ. 63 (3), 620–642. https://doi.org/10.1111/1467-8489.12309 (2019).
-
Sharif, A., Baris-Tuzemen, O., Uzuner, G., Ozturk, I. & Sinha, A. Revisiting the role of renewable and non-renewable energy consumption on Turkey’s ecological footprint: Evidence from quantile ARDL approach. Sustain. Cities Soc. 102138. https://doi.org/10.1016/j.scs.2020.102138 (2020).
-
Xu, L., Wang, X., Wang, L. & Zhang, D. Does technological advancement impede ecological footprint level? The role of natural resources prices volatility, foreign direct investment and renewable energy in China. Resour. Policy. 76, 102559. https://doi.org/10.1016/j.resourpol.2022.102559 (2022).
-
Bartelmus, P. Quantitative Economics: How Sustainable Are Our Economies? (Springer, 2008).
-
Xu, Y., Li, C. & Wang, J. How does agricultural global value chain affect ecological footprint? The moderating role of environmental regulation. Sustain. Dev. 31 (4), 2416–2427. https://doi.org/10.1002/sd.2518 (2023).
-
Alvarado, R. et al. Ecological footprint, economic complexity and natural resources rents in Latin America: empirical evidence using quantile regressions. J. Clean. Prod. 318, 128585. https://doi.org/10.1016/j.jclepro.2021.128585 (2021).
-
IPCC (Intergovernmental Panel on Climate Change). Global Warming of 1.5°C. (IPPC Climate Report 2018, 2018).
-
Adebayo, T. S. et al. Modeling the dynamic linkage between renewable energy consumption, globalization, and environmental degradation in South Korea: does technological innovation matter? Energies 14 (14), 4265 (2021).
-
Onifade, S. T., Gyamfi, B. A., Bekun, F. V. & Altuntaş, M. Significance of air transport to tourism-induced growth hypothesis in e7 economies: exploring the implications for environmental quality. Tour Intl Interdisc J. 70 (3), 339–353. https://doi.org/10.37741/t.70.3.1 (2022).
-
Espinosa-Gracia, A., Almazán-Gómez, M. A. & Jiménez, S. CO2 emissions and global value chains indicators: new evidence for 1995–2018. J. Environ. Manage. 343, 118239. https://doi.org/10.1016/j.jenvman.2023.118239 (2023).
-
Razzaq, A., Ajaz, T., Li, J. C., Irfan, M. & Suksatan, W. Investigating the asymmetric linkages between infrastructure development, green innovation, and consumption-based material footprint: novel empirical estimations from highly resource-consuming economies. Resour. Policy. 74, 102302. https://doi.org/10.1016/j. resourpol.2021.102302 (2021).
-
World Bank. World Development Indicators. (2024). https://databank.worldbank.org/source/world-development-indicators. Accessed 30 Apr 2024.
-
Global Footprint Network. Global Footprint Network (2024). https://data.footprintnetwork.org/. Accessed 30 Apr 2024.
-
Karaaslan, A. & Çamkaya, S. The relationship between CO2 emissions, economic growth, health expenditure, and renewable and non-renewable energy consumption: empirical evidence from Turkey. Renew. Energy. 190, 457–466. https://doi.org/10.1016/j.renene.2022.03.139 (2022).
-
Rehman, A. et al. The impact of globalization, energy use, and trade on ecological footprint in Pakistan: does environmental sustainability exist? Energies 14, 5234 (2021). https://doi.org/10.3390/en14175234
-
Zhang, Y. J., Peng, Y. L., Ma, C. Q. & Shen, B. Can environmental innovation facilitate carbon emissions reduction? Evidence from China. Energy Policy. 100, 18–28. https://doi.org/10.1016/j.enpol.2016.10.005 (2017).
-
Kihombo, S., Ahmed, Z., Chen, S., Adebayo, T. S. & Kirikkaleli, D. Linking financial development, economic growth, and ecological footprint: what is the role of technological innovation? Environ. Sci. Pollut. Res. 28 (43), 61235–61245. https://doi.org/10.1007/s11356-021-14993-1 (2021).
-
Bilgili, F., Koçak, E. & Bulut, Ü. The dynamic impact of renewable energy consumption on CO2 emissions: a revisited environmental Kuznets curve approach. Renew. Sustain. Energy Rev. 54, 838–845. https://doi.org/10.1016/j.rser.2015.10.080 (2016).
-
Miao, Y., Razzaq, A., Adebayo, T. S. & Awosusi, A. A. Do renewable energy consumption and financial globalisation contribute to ecological sustainability in newly industrialized countries? Renew. Energy. 187, 688–697. https://doi.org/10.1016/j.renene.2022.01.073 (2022).
-
Dong, K. et al. CO2 emissions, economic and population growth, and renewable energy: empirical evidence across regions. Energy Econ. 75, 180–192. https://doi.org/10.1016/j.eneco.2018.08.017 (2018).
-
Essandoh, O. K., Islam, M. & Kakinaka, M. Linking international trade and foreign direct investment to CO2 emissions: any differences between developed and developing countries? Sci. Total Environ. 712, 136437. https://doi.org/10.1016/j.scitotenv.2019.136437 (2020).
-
Grossman, G. M. & Krueger, A. B. Environmental impacts of a North American free trade agreement. Nat. Bureau Economic Res. https://doi.org/10.3386/w3914 (1991).
-
Grossman, G. M. & Krueger, A. B. Economic growth and the environment. Q. J. Econ. 110, 353–377. https://doi.org/10.2307/2118443 (1995).
-
Wang, J., Rickman, D. S. & Yu, Y. Dynamics between global value chain participation, CO2 emissions, and economic growth: Evidence from a panel vector autoregression model. Energy Econ. 109 . 105965. https://doi.org/10.1016/j.eneco.2022.105965 (2022).
-
Qian, Z. et al. Global value chains participation and CO2 emissions in RCEP countries. J. Clean. Prod. 332, 130070. https://doi.org/10.1016/j.jclepro.2021.130070 (2022).
-
Zhang, D., Wang, H., Löschel, A. & Zhou, P. The changing role of global value chains in CO2 emission intensity in 2000–2014. Energy Econ. 93, 105053. https://doi.org/10.1016/j.eneco.2020.105053 (2021).
-
Murakami, S., Takasu, T., Islam, K., Yamasue, E. & Adachi, T. Ecological footprint and total material requirement as environmental indicators of mining activities: case studies of copper mines. Environ. Sustain. Indic. 8, 100082. https://doi.org/10.1016/j.indic.2020.100082 (2020).
-
Liu, Q., Zhao, Z., Liu, Y. & He, Y. Natural resources commodity prices volatility, economic performance and environment: evaluating the role of oil rents. Resour. Policy. 76, 102548. https://doi.org/10.1016/j.resourpol.2022.102548 (2022).
-
Adebayo, T. S., Akadiri, S. S., Adedapo, A. T. & Usman, N. Does interaction between technological innovation and natural resource rent impact environmental degradation in newly industrialized countries? New evidence from method of moments quantile regression. Environ. Sci. Pollut. Res. 29 (2), 3162–3169 (2022).
-
Gyamfi, B. A. & Adebayo, T. S. Do natural resource volatilities and renewable energy contribute to the environment and economic performance? Empirical evidence from E7 economies. Environ. Sci. Pollut Res. 30, 19380–19392. https://doi.org/10.1007/s11356-022-23457-z (2023).
-
Ullah, S., Ozturk, I., Majeed, M. T. & Ahmad, W. Do technological innovations have symmetric or asymmetric effects on environmental quality? Evidence from Pakistan. J. Clean. Prod. 316, 128239. https://doi.org/10.1007/s11356-018-1530-4 (2021).
-
Yang, X. et al. Volatility in mineral resource pricing causes ecological footprints: A cloud on the horizon. Resour. Policy. 77, 102673. https://doi.org/10.1016/j.resourpol.2022.102673 (2022).
-
Ekesiobi, C. et al. Energy efficiency investment in a developing economy: financial development and debt status implication. Int. J. Energy Sect. Manage. https://doi.org/10.1108/IJESM-12-2023-0002 (2024).
-
Jahanger, A., Ozturk, I., Onwe, J. C., Joseph, T. E. & Hossain, M. R. Do technology and renewable energy contribute to energy efficiency and carbon neutrality? Evidence from top ten manufacturing countries. Sustain. Energy Technol. Assess. 56, 103084. https://doi.org/10.1016/j.seta.2023.103084 (2023a).
-
Machado, J. A. & Silva, J. S. Quantiles via moments. J. Econ. 213 (1), 145–173 (2019).
-
Driscoll, J. C. & Kraay, A. C. Consistent covariance matrix Estimation with spatially dependent panel data. Rev. Econ. Stat. 80 (4), 549–560 (1998).
-
Wang, J., Wan, G. & Wang, C. Participation in GVCs and CO2 emissions. Energy Econ. 84, 104561. https://doi.org/10.1016/j.eneco.2019.104561 (2019).
-
Ouerghi, I. & Hasni, R. Examining the influence of global value chains and economic complexity on carbon emissions: insights from top ten emitters. Dev. Sustain. Econ. Finance. 5, 100039. https://doi.org/10.1016/j.dsef.2024.100039 (2025).
-
Yan, Y., Li, X., Wang, R., Zhao, Z. & Jiao, A. Decomposing the carbon footprints of multinational enterprises along global value chains. Struct. Change Econ. Dyn. 66, 13–28. https://doi.org/10.1016/j.strueco.2023.03.011 (2023).
-
Dai, F., Yang, J., Guo, H. & Sun, H. Tracing CO2 emissions in China-US trade: a global value chain perspective. Sci. Total Environ. 775, 145701. https://doi.org/10.1016/j.scitotenv.2021.145701 (2021).
-
Wang, L., Vo, X. V., Shahbaz, M. & Ak, A. Globalization and carbon emissions: is there any role of agriculture value-added, financial development, and natural resource rent in the aftermath of COP21? J. Environ. Manag. 268, 110712. https://doi.org/10.1016/j.jenvman.2020.110712 (2020).
-
Guan, X., Wang, Q., Mansoor, H. & Nadeem, M. The impact of natural resource rent, global value chain participation, and financial development on environmental footprints: A global analysis with fresh evidence. Nat. Resour. Forum. 49 (1), 748–775. https://doi.org/10.1111/1477-8947.12413 (2025).
-
Ghazouani, T. & Maktouf, S. Impact of natural resources, trade openness, and economic growth on CO2 emissions in oil-exporting countries: A panel autoregressive distributed lag analysis. Nat. Resour. Forum. 48 (1), 211–231. https://doi.org/10.1111/1477-8947.12318 (2024).
-
Keswani, S., Mariayala, N., Kumar, M. & Dhingra, V. Association among financial development, economic growth, ecological footprint, and carbon emissions in India: a VECM analysis. Cogent Social Sci. 11 (1), 2448769. https://doi.org/10.1080/23311886.2024.2448769 (2025).
-
Sarpong, F. A. et al. Exploring the optimal threshold of FDI inflows for carbon-neutral growth in Africa. Environ. Sci. Pollut. Res. 31 (2), 2813–2835. https://doi.org/10.1007/s11356-023-31169-1 (2024).
-
Udemba, E. N., Khan, N. U. & Shah, S. A. R. Demographic change effect on ecological footprint: A tripartite study of urbanization, aging population, and environmental mitigation technology. J. Clean. Prod. 437, 140406. https://doi.org/10.1016/j.jclepro.2023.140406 (2024).
-
Gershon, O., Asafo, J. K., Sowah, J. N. & Tanko, F. Persistence of emissions in selected African countries: energy consumption and population growth dynamics. Energy Strategy Reviews. 57, 101628. https://doi.org/10.1016/j.esr.2024.101628 (2025).
-
Cai, A., Zheng, S., Cai, L., Yang, H. & Comite, U. How does green technology innovation affect carbon emissions? A Spatial econometric analysis of China’s provincial panel data. Front. Environ. Sci. 9, 813811. https://doi.org/10.3389/fenvs.2021.813811 (2021).
-
Shi, T., Si, S., Chan, J. & Zhou, L. The carbon emission reduction effect of technological innovation on the transportation industry and its Spatial heterogeneity: evidence from China. Atmosphere 12 (9), 1169. https://doi.org/10.3390/atmos12091169 (2021).
-
Magazzino, C., Alola, A. A. & Schneider, N. The trilemma of innovation, logistics performance, and environmental quality in 25 topmost logistics countries: A quantile regression evidence. J. Clean. Prod. 322, 129050. https://doi.org/10.1016/j.jclepro.2021.129050 (2021).
-
Onwe, J. C., Nathaniel, S. P. & Ansari, M. A. Toward sustainable climate action in advanced economies: Linking information communication technology, technological innovation, economic complexity, and ecological footprint. Nat. Resour. Forum 1–21. https://doi.org/10.1111/1477-8947.12468 (2024).
-
Jahanger, A., Ogwu, S. O., Onwe, J. C. & Awan, A. The prominence of technological innovation and renewable energy for the ecological sustainability in top SDGs nations: insights from the load capacity factor. Gondwana Res. 129, 381–397. https://doi.org/10.1016/j.gr.2023.05.021 (2024a).
-
Jahanger, A. et al. Do pro-environmental interventions matter in restoring environmental sustainability? Unveiling the role of environmental tax, green innovation and air transport in G-7 nations. Gondwana Res. 127, 165–181. https://doi.org/10.1016/j.gr.2023.07.010 (2024b).
-
UIBE. UIBE GVC Laboratory. (2024). http://gvcdb.uibe.edu.cn/. Accessed 30 Apr 2024.
-
OECD & Stat, O. E. C. D. https://data.oecd.org/ (2024). Accessed 30 Apr 2024.
-
Adebayo, T. S., Rjoub, H., Akinsola, G. D. & Oladipupo, S. D. The asymmetric effects of renewable energy consumption and trade openness on carbon emissions in Sweden: new evidence from quantile-on-quantile regression approach. Environ. Sci. Pollut Res. 29 (2), 1875–1886. https://doi.org/10.1007/s11356-021-15706-4 (2022).
-
Ali, I. M. A., Attiaoui, I., Khalfaoui, R. & Tiwari, A. K. The effect of urbanization and industrialization on income inequality: an analysis based on the method of moments quantile regression. Soc. Indic. Res. 161 (1), 29–50 (2022).
-
Amegavi, G. B. The heterogeneous effects of government size and press freedom on corruption in sub-Saharan Africa: method of moment quantile regression approach. Int. J. Press/Politics. 27 (2), 439–459. https://doi.org/10.1177/19401612211007048 (2022).
-
Wolde-Rufael, Y. & Mulat-Weldemeskel, E. The moderating role of environmental tax and renewable energy in CO2 emissions in Latin America and Caribbean countries: evidence from method of moments quantile regression. Environ. Challenges. 6, 100412. https://doi.org/10.1016/j.envc.2021 (2022).
-
Kamil, R., Appiah, K. O., Agana, J. A. & Saeed, U. F. Advancing carbon neutrality agenda: Does governance quality and environmental tax matter? Evidence from novel MMQR and heterogeneous analysis. Environ. Dev. Sustain. 1–30. https://doi.org/10.1007/s10668-025-06099-2 (2025).
-
Hossain, M. R., Dash, D. P., Das, N., Ullah, E. & Hossain, M. E. Green energy transition in OECD region through the lens of economic complexity and environmental technology: A method of moments quantile regression perspective. Appl. Energy. 365, 123235 (2024).
-
Elbatanony, M., Attiaoui, I., Ali, I. M. A., Nasser, N. & Tarchoun, M. The environmental impact of remittance inflows in developing countries: evidence from method of moments quantile regression. Environ. Sci. Pollut. Res. 28 (35), 48222–48235 (2021).
-
Leng, C. et al. An empirical assessment of the effect of natural resources and financial technologies on sustainable development in resource abundant developing countries: evidence using MMQR Estimation. Resour. Policy. 89, 104555 (2024).
-
Hainmueller, J. & Hazlett, C. Kernel regularized least squares: reducing misspecification bias with a flexible and interpretable machine learning approach. Political Anal. 22 (2), 143–168 (2014).
-
Adebayo, T. S., Meo, M. S., Eweade, B. S. & Özkan, O. Examining the effects of solar energy innovations, information and communication technology and financial globalization on environmental quality in the united States via Quantile-On-Quantile KRLS analysis. Sol. Energy. 272, 112450 (2024).
-
Lin, B. & Ullah, S. Modeling the impacts of changes in nuclear energy, natural gas, and coal in the environment through the novel DARDL approach. Energy 287, 129572 (2024).
-
Myers, J. Variance Inflation Factor Analysis: Interpretation and Understanding (Lawrence Erlbaum, 1990).
-
Bowerman, B. L. & O’connell, R. T. Linear Statistical Models: An Applied Approach (Pws Pub. Co., 1990).
-
Niresh, A. & Thirunavukkarasu, V. Firm size and profitability: A study of listed manufacturing firms in Sri Lanka. Int. J. Bus. Manag. 9(4). (2014).
-
Powell, D. Quantile regression with nonadditive fixed effects. Empir. Econ. 63 (5), 2675–2691 (2022).
-
Assamoi, G. R. et al. Dynamics between participation in global value chains and carbon dioxide emissions: empirical evidence for selected Asian countries. Environ. Sci. Pollut Res. 27, 16496–16506. https://doi.org/10.1007/s11356-020-08166-9 (2020).
-
Liu, C. & Zhao, G. Can global value chain participation affect embodied carbon emission intensity? J. Clean. Prod. 287, 125069 (2021).
-
Jin, Z., Wang, J., Yang, M. & Tang, Z. The effects of participation in global value chains on energy intensity: evidence from international industry-level decomposition. Energy Strategy Reviews. 39, 100780 (2022).
-
Ahmad, N., Youjin, L., Žiković, S. & Belyaeva, Z. The effects of technological innovation on sustainable development and environmental degradation: evidence from China. Technol. Soc. 72, 102184 (2023).
-
Suki, N. M., Suki, N. M., Sharif, A., Afshan, S. & Jermsittiparsert, K. The role of technology innovation and renewable energy in reducing environmental degradation in Malaysia: A step towards sustainable environment. Renew. Energy. 182, 245–253 (2022).
-
Chien, F. et al. The role of technology innovation, renewable energy and globalization in reducing environmental degradation in Pakistan: a step towards sustainable environment. Renew. Energy. 177, 308–317 (2021).
-
Chu, L. K. The role of technological innovation and population aging in environmental degradation in the organization for economic Co-operation and development countries. Environ. Dev. Sustain. 26 (1), 735–773 (2024).
-
Aladejare, S. A. Natural resource rents, globalisation and environmental degradation: new insight from 5 richest African economies. Resour. Policy. 78, 102909 (2022).
-
Sibanda, K., Garidzirai, R., Mushonga, F. & Gonese, D. Natural resource rents, institutional quality, and environmental degradation in resource-rich Sub-Saharan African countries. Sustainability 15 (2), 1141 (2023).
-
Huang, S. Z., Sadiq, M. & Chien, F. The impact of natural resource rent, financial development, and urbanization on carbon emission. Environ. Sci. Pollut. Res. 1–13 (2021).
-
Safdar, S., Khan, A. & Andlib, Z. Impact of good governance and natural resource rent on economic and environmental sustainability: an empirical analysis for South Asian economies. Environ. Sci. Pollut. Res. 29 (55), 82948–82965 (2022).
Acknowledgments
Researchers Supporting Project Number (RSP2025R87), King Saud University, Riyadh, Saudi Arabia.
Author information
Authors and Affiliations
Contributions
Conceptualization, M.N.Ç. and Ö.F.B,; Methodology, M.N.Ç.; Writing—Original Draf Preparation, M.N.Ç. and Ö.F.B; Writing—Review and Editing, M.N.Ç., Ö.F.B, A.A.N. and M.K.A; Visualization, A.A.N. and M.K.A; Sofware, M.N.Ç.; Supervision, M.N.Ç.; Project Administration, M.N.Ç.; Formal analysis M.N.Ç. and Ö.F.B,. All authors have read and agreed to the published version of the manuscript.
Corresponding author
Ethics declarations
Competing interests
The authors declare no competing interests.
Additional information
Publisher’s note
Springer Nature remains neutral with regard to jurisdictional claims in published maps and institutional affiliations.
Electronic supplementary material
Below is the link to the electronic supplementary material.
Rights and permissions
Open Access This article is licensed under a Creative Commons Attribution-NonCommercial-NoDerivatives 4.0 International License, which permits any non-commercial use, sharing, distribution and reproduction in any medium or format, as long as you give appropriate credit to the original author(s) and the source, provide a link to the Creative Commons licence, and indicate if you modified the licensed material. You do not have permission under this licence to share adapted material derived from this article or parts of it. The images or other third party material in this article are included in the article’s Creative Commons licence, unless indicated otherwise in a credit line to the material. If material is not included in the article’s Creative Commons licence and your intended use is not permitted by statutory regulation or exceeds the permitted use, you will need to obtain permission directly from the copyright holder. To view a copy of this licence, visit http://creativecommons.org/licenses/by-nc-nd/4.0/.
About this article
Cite this article
Çoban, M.N., Biçen, Ö.F., Nassani, A.A. et al. Exploring the effects of global value chain participation, technological eco-innovation and natural resource rents on environmental quality in the EU-14.
Sci Rep 15, 17572 (2025). https://doi.org/10.1038/s41598-025-01569-z
-
Received: 19 September 2024
-
Accepted: 07 May 2025
-
Published: 21 May 2025
-
DOI: https://doi.org/10.1038/s41598-025-01569-z
Keywords
Search
RECENT PRESS RELEASES
Related Post


