Exploring the role of energy transition in shaping the CO2 emissions pattern in China’s po
May 28, 2025
Abstract
In this study, an improved gravity model and social network analysis (SNA) are applied to analysis CO2 emissions in China’s power sector, uniquely incorporating electricity and fossil fuel trade flows. It further explores the dynamic effect of energy transition on networks using a panel model, and clarifies the provincial roles in emission abatement and resource allocation. According to the findings, significant regional heterogeneities in CO2 emissions from 2007 to 2022 can be observed. Coal-dependent provinces, such as Inner Mongolia and Shanxi, face high emissions and challenging transitions, while developed areas such as Beijing and Shanghai have decreased emissions through clean energy integration and enhanced power efficiency. Network analysis identifies Beijing and Jiangsu as central to resource management, empowered by robust policy and information-sharing capabilities, while most provinces demonstrate weaker coordination owing to constrained intermediary functions. In addition, the study observes that energy transitions increase network density (0.3512) and contacts (0.3545) yet decrease efficiency (− 0.1464), suggesting technical and coordinative obstacles. An increasing degree of transition strengthens interprovincial CO2 connections, establishing provinces experiencing more rapid transitions as critical nodes. Greater closeness centrality (0.0186) signifies shorter collaborative pathways, accelerating the transition. These findings derive practical guidance for regional power collaborations and sustainable growth, offering novel perspectives for a green transition toward carbon neutrality.
Introduction
As the world’s leading source of carbon emissions, China confronts significant challenges in curbing emissions in the face of global climate change1. The power sector, a primary driver of CO2 emissions, is outstanding both for its high emission levels and its complex network2. This sector’s proportion of overall CO2 emissions, demonstrated by its crucial function in national abatement strategies, has significantly grown through economic expansion3. Moreover, national energy strategies that advance clean energy and optimize the energy mix are transforming its emission signature4,5. These strategies affect not only aggregate emissions but also the functions and relationships of provinces in the emissions network6. Therefore, analyzing the power sector’s emissions network and evaluating the effects of energy transition are fundamental to attaining sustainable development objectives.
Recent analyses into CO2 emissions from the power sector have progressed from single-region analyses to explore interregional spatial networks, and explained how environmental and economic factors affect regional emissions through complex spatial relationships7. For instance, regions with high energy demand frequently represent critical points in networks, where their emission control approaches influence adjacent regions through ripple effects8. Identifying these critical points is crucial for formulating collaborative regional emission reduction strategies9. Studies also demonstrate that economic exchanges and policy alignment between regions are indispensable for emissions management, particularly in energy-intensive regions, as localized strategies can affect neighboring regions through technological diffusion and economic bonds10. Accordingly, SNA and econometric methods are extensively employed to measure CO2 emission trends, thereby exposing interregional carbon interdependencies and spillover channels11.
In spatial econometrics, studies on CO2 emissions often concentrate on explaining the diffusion and dependencies between regions. The Spatial Lag Model (SLM) and Spatial Error Model (SEM) are frequently employed to model these regional emission relationships. Zhang et al.12, for instance, utilized the SLM to demonstrate a significant spatial spillover effect of renewable energy on air pollution reduction. Employing the SEM, Vagnini et al.13 determined that policy differences in the European Union significantly affect carbon emissions across regions. The Spatial Durbin Model (SDM), an extension of the SLM, incorporates lagged variables to study complex inter-regional effects; utilizing this method, Weng et al.14 demonstrated that clean energy investments in neighboring countries lead to higher domestic carbon emissions across 72 countries. Liu et al.15 determined that new energy use considerably decreases emissions through spatial spillover effects across Chinese provinces. While spatial econometric models utilize spatial weight matrices to connect regions, the selection of these matrices can affect the robustness of the results. In addition, these models typically prioritize attribute data over relational data, which may restrict their capacity to fully represent the spatial relationships in carbon emissions16. Therefore, certain researchers have adopted SNA with its multi-level network structures to study the spatial dynamics of CO2.
SNA has found extensive application in emissions research, particularly for explaining emission relationships and diffusion pathways across geographic regions, national borders, and economic sectors. For instance, Liu et al.17 employed SNA to identify the influential roles of primary emitters in international air pollution control networks. Similarly, Pan et al.18 demonstrated SNA’s capacity to track policy effects across sectors in China’s energy transition, thereby informing policy development and industrial optimization. In the power sector, SNA indicates complex inter-regional carbon dependencies. Yang and Su19 have demonstrated that inter-regional collaboration significantly improves emission abatement. Geng et al.20 further described the evolving patterns of regional collaboration in clean energy development and carbon mitigation. The integration of SNA with other quantitative approaches has amplified its contribution to carbon emission studies. Xia et al.21, for instance, coupled SNA with the environmentally extended input–output (EEIO) model to chart carbon movements across economic sectors, and argued for the critical role of the power sector. Li et al.22 employed SNA and bibliometric analysis to connect electricity market volatility with carbon trading behaviors, demonstrating SNA’s ability to monitor inter-market connections. These analyses emphasize the utility of SNA in exposing inter-regional emission patterns and locating critical junctures, thus facilitating cooperative emission reduction efforts and policy improvements23.
The debate surrounding the environmental advantages of energy transition often focuses on energy substitution and its consequences for CO2 emissions. A majority of studies indicate that substituting non-fossil energy sources for fossil fuels lowers CO2 emissions24. Nevertheless, certain research highlights potential disadvantages: Kinyar and Bothongo25 observed that the fluctuating nature of non-fossil energy sources presents challenges to grid stability, potentially increasing dependence on fossil fuels. Increasing prices for non-fossil energy may also curb consumption, resulting in a “rebound effect� that elevates emissions26. Geographic and regional considerations introduce further complexity to this matter. Nan et al.27 indicated that, owing to the pollution haven effect and spatial spillover effects driven by regional competition and imitation, policies implemented in isolation often fail to significantly decrease local emissions. In China, interprovincial power transfers totaled 1.85 trillion kWh in 2023, illustrating a significant regional interdependence in power production and consumption. While power generation is generally geographically independent, changes in one region’s energy mix can significantly affect emissions in adjacent regions28. Wang and Liu29 proposed that a spatial CO2 emission network would more effectively represent cross-regional synergistic relationships and transmission effects in energy transitions.
Existing studies display certain limitations. Firstly, while spatial econometric models are frequently employed to appraise the spillover effects of CO2 emissions, their capacity to detect cross-regional spatial relationships is limited. Secondly, network analysis is primarily utilized in country-specific or global studies, with a narrow concentration on industries such as the power sector. Thirdly, notwithstanding the identification of numerous factors affecting CO2 emissions, research exploring the effect of energy transition remains limited, especially regarding how it restructures CO2 networks. To further contextualize the novelty of our study, we compare it with prior research in Table 1, which summarizes key contributions and research gaps in the field.
As Table 1 illustrates, prior research has explored diverse aspects of energy transition, biofuel logistics, AI-driven energy efficiency, and trade globalization. However, none have fully integrated SNA with an improved gravity model to assess the impact of energy transition on CO2 emissions across China’s power sector. Our study provides a novel contribution by mapping regional CO2 interdependencies, identifying key provinces in the transition, and evaluating the policy-driven impact of trade flows on emission reduction efforts. The comprehensive approach offers policymakers a new perspective on how to enhance regional cooperation and accelerate the transition toward carbon neutrality. This study addresses key gaps by focusing on two questions: What are the defining features of China’s power sector CO2 emission network? How does the energy transition affect the network structure and the function of individual provinces? These findings are intended to improve the geographic targeting of emissions control and inform interprovincial CO2 reduction policies by assessing the relationship between emissions and energy transition.
Contributions
As CO2 emissions in the power sector grow increasingly complex, traditional single-region studies are no longer sufficient for understanding interprovincial relationships. This study develops an integrated framework to examine China’ power sector emissions from a network perspective, emphasizing interregional CO2 linkages. The main contributions are as follows:
(1) Establishing an interprovincial CO2 emission network framework
Existing research often focuses on individual provinces, overlooking interregional carbon linkages and prioritizing “attribute data� over “relational data�. This study combines an improved gravity model with SNA to construct a nationwide emission network. This approach quantifies interregional CO2 interactions, offering a comprehensive view of the spatial structure and dynamic evolution of emission flows. It addresses the limitations of traditional methods in analyzing nonlinear and cross-regional emission relationships.
(2) Incorporating energy trade data to refine CO2 flow calculations
Traditional methods assess emissions based on production locations, ignoring the impact of energy trade. This study integrates interprovincial fossil energy and electricity trade data into the gravity model, improving the accuracy of CO2 linkage calculations. This refinement better captures interregional carbon exchange mechanisms and clarifies the role of key provinces in resource allocation.
(3) Examining the impact of energy transition on the emission network
Unlike previous studies that focus on the overall impact of energy transition on total emissions or explore multiple factors affecting the emission network, this study systematically evaluates the independent effect of energy transition on the network’s structural characteristics. Using a panel model, it reveals how changes in the energy mix directly influence network density and connectivity. The findings highlight the role of energy transition in fostering interregional collaboration while identifying potential efficiency challenges.
(4) Providing a policy tool for regional CO2 reduction coordination
By identifying the structural roles of provinces in the emission network, this study offers a scientific basis for understanding regional disparities and optimizing CO2 reduction strategies. The results can inform interprovincial policy coordination, improve energy cooperation mechanisms, and guide carbon trading system design, supporting policymakers in enhancing cross-regional synergies for emission reduction. Figure 1 illustrates the framework of the paper.
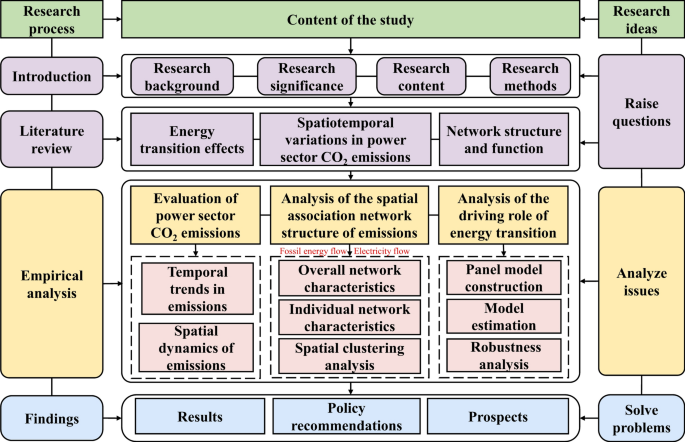
Research framework.
Methods and data
CO2 emission estimation model
The first step of this study is to calculate CO2 emissions from the power sector in each province, providing fundamental data for subsequent network construction. Given that thermal power is the primary source of CO2 emissions, its quantification follows the methodology outlined by the IPCC (2006), with the calculation formula as follows40:
In Eq. (1), CO2 refers to carbon dioxide emissions, while I indicates the energy type. EI represents energy consumption, EFI denotes the emission factor, and NCVI corresponds to the average low heat value, CEFI signifies the carbon content per unit of heating value, and COFI denotes the carbon oxidation rate. We utilize provincial fuel consumption data from the China Energy Statistical Yearbook and match corresponding emission factors based on fuel types to ensure data accuracy and consistency. The computed results serve as the core input for subsequent network analysis.
Social network analysis model
After obtaining provincial CO2 emission data, an interprovincial carbon emission network needs to be built to assess how energy transition affects regional emission relationships. This process involves two key steps.
First, the gravity model is used to quantify interprovincial CO2 emission linkages and construct the emission network. In this study, dynamic CO2 emissions in the power sector form a network where provinces are nodes, and interprovincial emissions linkages are connections. Given the limitations of the Vector Autoregressive Model (VAR) in capturing network dynamics due to its sensitivity to lag order, the gravity model is adopted, as it facilitates analysis across both temporal and spatial dimensions41. The gravity model, derived from the physical law of gravitation, was integrated into economics to analyze trade flows and regional economic interactions. Its central principle posits that the interaction intensity between two economies is proportional to their economic scale and inversely proportional to their distance. Extensively applied in areas such as international trade, population migration, logistics, and environmental economics, the model has also been instrumental in studying the transmission of CO2 emissions. Leveraging this framework, the study utilizes the gravity model to quantify interprovincial emission linkages, seeking to reveal the spatial flow patterns of CO2 emissions in the context of energy transition.
In CO2 emission analysis, the gravity model assumes that the strength of emission linkages between two regions depends on their emission levels, economic size, and geographical or economic distance. Regions with higher emissions often have stronger energy and industrial ties, resulting in more intense emission interactions. Similarly, provinces with larger economies typically exhibit greater energy demand and more developed industries, strengthening their emission connections. Geographical distance also plays a key role: emission linkages are stronger between nearby provinces and weaken with increasing distance. Additionally, economic ties, energy trade, and electricity flows further shape interregional emission linkages.
This study refines the traditional gravity model to improve its applicability in analyzing CO2 emissions within the power sector. First, based on relevant research, population and GDP are incorporated as “mass� factors to more accurately assess the determinants of interprovincial emission linkages42,43. Compared to the conventional approach, which solely considers CO2 emissions as the mass variable, this enhancement provides a more comprehensive reflection of the role of regional economic scale in emission flows. Second, variables for electricity trade and fossil energy trade are introduced to better characterize the interregional mobility of CO2 emissions. Electricity trade reflects the imbalance in power supply and demand across provinces and, to some extent, determines the inter-provincial transfer of CO2 emissions. Fossil energy trade captures the geographical distribution of energy production and consumption, directly influencing the spatial characteristics of emission linkages. These refinements are theoretically grounded in the acknowledgment of the impact of interprovincial energy flows on CO2 emission associations, thereby enhancing the model’s explanatory power44,45,46. Furthermore, to accurately capture the spatial structure of the gravity model, the denominator component is optimized by refining the calculation of interprovincial distance. Specifically, the traditional Euclidean distance is replaced with a “geographical distance/economic disparity� measure, which better captures the economic drivers of interprovincial energy dependence47. The modified gravity model is as follows:
(x_ij) represents the connection between carbon emissions of provinces i and j in the power sector. P denotes population, GDP represents regional gross domestic product, and C signifies total CO2 emissions, TC and TE denote fossil energy and electricity trade volumes, respectively. Net trade values distinguish imports and exports, using absolute values in calculations. Ds measures the distance between i and j, and Ge is per capita GDP. Using Eq. (2), we obtain a 30 × 30 interprovincial gravity matrix and calculate the average for each row. The enhanced gravity model incorporates not only traditional factors like economic scale and geographical distance but also integrates energy flow characteristics specific to the power sector, better reflecting the actual structure of the CO2 emission network. During model estimation, logarithmic linearization is applied to reduce the impact of variable magnitude differences and improve model robustness. Furthermore, the emission linkage matrix is standardized to ensure data comparability. This approach allows for the quantification of CO2 emission linkage intensity between provinces and the construction of a comprehensive emission network, offering critical data support for subsequent network analysis.
Then, this study utilizes the SNA method, transforming the interprovincial association matrix into a network adjacency matrix to construct a CO2 emission network. SNA effectively quantifies relational data through network structures and has been extensively applied in industrial structure, energy, and economic management48,49,50. In the field of CO2 emission studies, SNA serves as a powerful tool for revealing spatial flow patterns of emissions and regional interactions from a network perspective. Unlike traditional statistical methods, SNA focuses on the relationships between nodes (i.e., research subjects) and edges (i.e., connections between nodes) within a network. By examining network structures and individual node attributes, it enables the identification of CO2 emission transmission mechanisms across regions and highlights the critical nodes that play pivotal roles in these processes.
In the CO2 emission network, provinces are represented as nodes, and interprovincial CO2 emission linkages, calculated using the gravity model, form the edges connecting these nodes. SNA is applied to construct the emission network, quantifying the characteristics of emission flows across regions. It utilizes network structural metrics and individual centrality measures to assess the role of each province within the network.
At the network level, SNA examines features such as connectivity, density, efficiency, and hierarchy. Connectivity reflects the overall stability and vulnerability of the carbon emission network, while density measures the intensity of interprovincial emission linkages. Efficiency evaluates the presence of redundant connections, providing insights into the flow efficiency of carbon emissions. Hierarchy identifies dominant nodes, emphasizing core regions that play a critical role in carbon emission flows. At the individual level, SNA employs centrality measures to evaluate the position of each province within the network. Degree centrality counts the number of direct connections a province has, with higher values indicating a more central role in emission flows. Closeness centrality measures the average shortest path length from a province to all others; higher values suggest a central position, enhancing overall network connectivity. Betweenness centrality assesses the extent to which a province acts as a bridge between others, with higher values indicating a strategic role in carbon emission transmission. Such provinces are crucial for emission governance and regional policy coordination.
The strength of SNA lies in its ability to systematically and intuitively reveal the structural characteristics of the CO2 emission network and identify the relative importance of provinces in emission flows. Additionally, SNA can be combined with econometric methods, such as regression analysis, to explore the factors driving changes in the network structure. Based on the CO2 emission network, this study uses SNA to analyze both the overall network structure and individual node characteristics, with key indicators calculated as follows51:
Overall network
Network connectivity reflects the stability and vulnerability of the network. Its calculation is given by Eq. (3):
Where Co denotes connectivity, V is the count of unreachable node pairs, and N denotes the total nodes.
Network density measures the strength of spatial connections. The formula is:
where D is the network density, L is the number of links, and N × (N − 1) represents the maximum potential connections.
Network efficiency evaluates redundant links, showing inter-provincial link effectiveness. Lower efficiency suggests more inter-provincial connections, leading to denser CO2 emission distribution. The formula is:
where E represents network efficiency, M is the count of redundant path.
Network hierarchy reflects the dominance levels within the network members:
where H denotes network hierarchy, K denotes the number of symmetrically reachable node pairs.
Individual network
Centrality reflects a node’s status and influence within a network, encompassing degree, closeness, and betweenness centrality. Degree centrality highlights a node’s core position. The formula is:
De represents the degree, n represents the number of provinces directly connected to the target province, and N indicates the total number of nodes.
Closeness centrality measures the total distance from a node to all others.
(textC_textAPi) represents the closeness centrality of node, and (dij) denotes the shortest distance between i and j.
Betweenness centrality quantifies a node’s influence on interactions between other nodes. The formula is:
where j ≠ i ≠ k and j < k, (CBi) represents the betweenness centrality, and (bjk(i)) denotes the ability of node i to mediate the connection between nodes j and k.
The gravity model offers a robust quantitative framework for analyzing spatiotemporal correlations, while SNA translates these relationships into measurable network indicators, facilitating the identification of key provinces and their respective roles. This combined methodology serves as an effective analytical tool for examining the CO2 emission network within China’s power sector. It not only ensures the accuracy and reliability of correlation assessments but also uncovers the underlying network structure and the impact of individual nodes. This dual approach enhances the understanding of the mechanisms driving interprovincial collaboration in emission reduction efforts.
Panel data model
Model specification
In the power sector, CO2 reduction focuses on optimizing generation mix and enhancing efficiency. Efficiency gains depend on advances in technologies like boiler combustion and carbon capture, which require substantial early investment. Simplifying energy use at the consumer level, especially through energy transitions, offers a more practical approach.
Building on the constructed CO2 emission network, this study uses a panel data model to quantify the impact of energy transition on the carbon emission network52. The panel data model is an econometric tool designed to analyze data with both time and individual dimensions, making it widely applicable in economic, social, and environmental research. Unlike cross-sectional data (single time point) or time series data (single entity over time), the panel data model tracks the same subjects across multiple time points. This approach better controls for individual heterogeneity, improves estimation accuracy, and enhances the robustness of findings. In this study, the model quantifies the influence of energy transition on the structural characteristics of the CO2 emission network and identifies factors driving the spatial evolution of emissions.
A major strength of the panel data model is its ability to account for unobservable individual effects, such as a province’s resource endowment, industrial structure, policy environment, and economic development level, which significantly shape carbon emission networks. Traditional regression methods often assume these factors are randomly distributed, but interprovincial differences are typically fixed and influential, leading to biased estimates. By incorporating fixed effects (FE) or random effects (RE), the panel data model reduces bias and provides a more accurate assessment of energy transition’s impact.
In the model, the dependent variable is defined using structural indicators of the CO2 emission network to capture its dynamic features. The core explanatory variable is energy transition level, measured by the share of non-hydro renewable energy (e.g., wind and solar) in total electricity generation. To improve model reliability and explanatory power, control variables are included to address potential confounding factors, ensuring the net effect of energy transition is accurately identified. The relationship between energy transition and the emissions network is expressed in the following:
(SAN_it) denotes the CO2 emission network features for province i in year t; (ETD_it) indicates denotes the proportion of non-fossil energy for i in year t; (mu_it) and (sigma_it) denote the fixed effects corresponding to provinces and years, respectively, while (varepsilon_it) signifies the random error term; (Control_it) refers to the set of control variables.
The factors affecting CO2 emissions in the power sector also contribute to spatial spillover effects. Based on previous research53,54,55,56,57,58, the selected control variables are:
(Control_it = left APCR_it ,;PIR_it ,;FI_it ,;CTP_it ,;PC_it ,;ECI_it right\), where:
(1) (APCR_it): APCR reflects internal power use within the power sector; higher rates indicate lower energy efficiency and higher emissions. Controlling APCR aids in evaluating the net impact of energy transitions on emissions.
(2) (PIR_it): Measures power system dependency on energy inputs. Regional energy differences may affect emissions, so controlling PIR reduces these disruptions.
(3) (FI_it): New technology investments may enhance energy efficiency or renewable energy use, reducing emissions. As a control variable, FI identifies the impact of capital accumulation in the energy sector on emissions.
(4) (CTP_it): Thermal power generation links directly to fossil fuel use, a major emission source. Controlling CTP isolates emission changes from energy transitions.
(5) (PC_it): Reflects the dependence of economic activity and living standards on electricity. Including PC in the model helps eliminate the impact of electricity demand fluctuations on emission levels.
(6) (ECI_it): Total energy consumption/GDP shows energy use per economic output unit and is a core efficiency indicator. Controlling ECI reduces emission differences stemming from economic growth or efficiency changes.
This set of control variables is crucial for clarifying factors affecting CO2 emissions in power generation, allowing an accurate assessment of the environmental impact of clean energy initiatives.
Estimation
This study employs multiple regression techniques to ensure robust and reliable analysis of panel data. Ordinary least squares (OLS) regression is first used as a baseline to assess the impact of energy transition on the CO2 emission network. Since OLS cannot control for individual fixed effects, it may introduce bias due to omitted variables. To address this, FE and RE models are applied. The Hausman test59 determines the choice between them: if individual effects correlate with explanatory variables, FE is selected; otherwise, RE is used. FE improves accuracy by accounting for unobservable provincial-level heterogeneity, while RE enhances efficiency under the assumption of randomly distributed individual effects.
Additionally, quantile regression (QR) is used to analyze the heterogeneous effects of energy transition across different network levels60. Unlike traditional methods focusing on mean effects, QR estimates coefficients across conditional distributions, revealing how energy transition impacts vary with network characteristics61. Specifically, it identifies differential effects on provinces with high centrality (core nodes) versus low centrality (peripheral nodes), offering insights into the spatial heterogeneity of energy policies. This approach also strengthens robustness against outliers, ensuring broader generalizability, which is crucial given the uneven distribution of CO2 emission networks. A fixed-effects panel quantile regression model was designed as follows:
(Q_y (tau |X_t )) represents the (tau)th conditional quantile of (y). The variable (X_t) signifies the influencing factors, and (vartheta_tau ) and (theta_tau ) respectively denote the impact parameters and unobserved influences in the (tau)th quantile. Although panel quantile regression is widely acknowledged, conventional methods typically assume individual effects represent only a “location shift�, leaving the entire distribution unaddressed. Such models are insufficient in dealing with endogeneity issues62. To overcome these shortcomings, Machado and Silva63 proposed an enhanced Method of Moments Quantile Regression (MMQR) approach. This method integrates individual effects into the QR framework, allowing these effects to influence the entire conditional distribution rather than just the mean or specific quantiles. MMQR captures greater individual heterogeneity, making it particularly effective for analyzing the diverse impacts of energy transition on networks. In practice, emission networks are shaped by factors such as economic development levels, energy consumption patterns, and policy environments, which vary across regions and over time. While traditional QR methods struggle to model such complexity, MMQR offers a more robust framework for examining the dynamic impacts of energy transition on CO2 emission network structures by incorporating individual effects.
A key strength of MMQR is its ability to address endogeneity, enhancing estimation robustness. In panel data analyses, explanatory variables often correlate with the error term, causing biased results. Traditional methods like OLS or QR typically assume exogeneity, an assumption frequently violated in energy economics. For instance, energy transition progress may be influenced by emission levels, or unobserved factors like policy changes and technological advancements may simultaneously impact energy structures and emission networks. By using Generalized Method of Moments (GMM) to estimate the conditional distribution, MMQR effectively reduces endogeneity and strengthens causal inference, making it ideal for handling the complex data structures in energy economics.
In this study, the MMQR method is applied to construct an extended econometric model, enabling the analysis of energy transition impacts on CO2 emission networks across different quantile conditions:
where ((theta ,;vartheta ,;delta ,;rho )) are coefficients to be estimated, and (P(delta_i + rho acuteZ_it > 0) = 1) represents the probability. The terms ((theta_i ,;delta_i ), ;i = 1,2,3, ldots ,n), indicate the fixed effects for individual (i), and (acuteZ) is a k-vector of known elements of (X) that are differentiable with respect to component (xi), specified as:
(X_it) is identically and independently distributed across both cross-sections (i) and time series (t). (phi_it) is orthogonal to (X_it), stabilizing the model and accounting for extreme exogenous behavior. Therefore, the model could be shaped as:
where (X_it) represents the vector of regressors, and (Q_y left( tau right)) indicates the quantile distribution of (Y_it). To address optimization, the following equation is proposed:
Such as, (gamma_tau left( B right) = left( tau – 1 right)BIleft B le 0 right + TBIleft B > O right\) indicates check function.
The study follows a structured approach: First, provincial CO2 emissions from the power sector are calculated to form the dataset. Second, an improved gravity model measures interprovincial carbon emission linkages, generating a standardized association matrix. Third, a CO2 emission network is built using SNA, with network and node indicators extracted to identify spatial patterns and key provinces. Finally, energy transition variables are incorporated into a panel data model for regression analysis, assessing their impact on the network and exploring provincial roles in CO2 reduction. This framework ensures logical consistency across data measurement, network construction, and causal analysis, strengthening the scientific validity of the findings.
Data source
This study examines CO2 emissions in the power sector across 30 provinces in China (excluding Tibet). Data on energy types used in thermal power are derived from the “China Energy Statistical Yearbook�64. The average net calorific value is also obtained from the same source. Information on the carbon content of unit heat and the carbon oxygenation rate is sourced from the “Guidelines for Provincial Greenhouse Gas Inventories (Trial)�65 and “2006 IPCC Guidelines for National Greenhouse Gas Inventories�66. SNA parameters are drawn from the “China Statistical Yearbook�67 and “China Energy Statistical Yearbook�68. Table 2 summarizes the parameters and data sources utilized in the panel model. The notation and abbreviations are provided in the Appendix A.
Results
Spatial distribution analysis of emissions
Figure 2 reveals significant interprovincial disparities in CO2 emissions from China’s power sector from 2007 to 2022. Inner Mongolia, Shandong, and Jiangsu emerged as the highest-emitting provinces, driven by their coal-dominated energy systems and roles as major electricity exporters. Inner Mongolia and Shanxi consistently exhibited high CO2 emissions intensity due to their reliance on coal, with coal-fired power generation still accounting for over 70% of their electricity output in 2022, despite national renewable energy policies. Analysis indicates divergent trends: while some developed regions reduced emissions, Inner Mongolia and Shanxi experienced emissions rebounds between 2017 and 2022, reflecting persistent coal dependency. In contrast, Hainan and Qinghai maintained minimal emissions through early adoption of renewable energy, particularly wind and solar power. Beijing achieved a 12.30% cumulative emission reduction through stringent energy policies, industrial restructuring, and the complete phase-out of local coal-fired power by 2017. The city now relies mainly on clean energy imports from neighboring provinces. Advanced initiatives, including ultra-low energy buildings, smart grids, and demand-side management, have optimized electricity use and reduced peak demand. Additionally, Beijing’s leadership in China’s carbon trading market has driven reductions through stricter carbon quotas and market incentives for cleaner technologies, positioning it as a model for urban decarbonization. These disparities highlight the uneven progress of China’s energy transition, with some regions advancing decarbonization while others remain heavily reliant on fossil fuels.
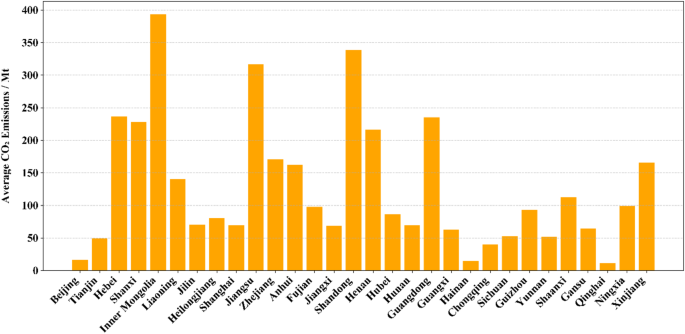
Average CO2 emissions in the power sector, 2007–2022.
The kernel density analysis in Fig. 3 reveals a widening divergence in provincial CO2 emissions over the study period. The declining peak height of the density curve and the elongation of its right tail signify intensifying polarization. Energy-producing provinces such as Inner Mongolia, Xinjiang, and Shanxi contributed to upper-tail expansion through persistent coal reliance, while post-2017 emission declines in eastern coastal provinces like Jiangsu, Zhejiang, and Guangdong created an emergent bimodal distribution. This bifurcation reflects asymmetric energy transition outcomes: economically developed regions leveraged stringent environmental policies and technological upgrades to reduce emissions, whereas resource-dependent provinces faced structural inertia from fossil fuel lock-in and industrial path dependency, hindering decarbonization efforts.
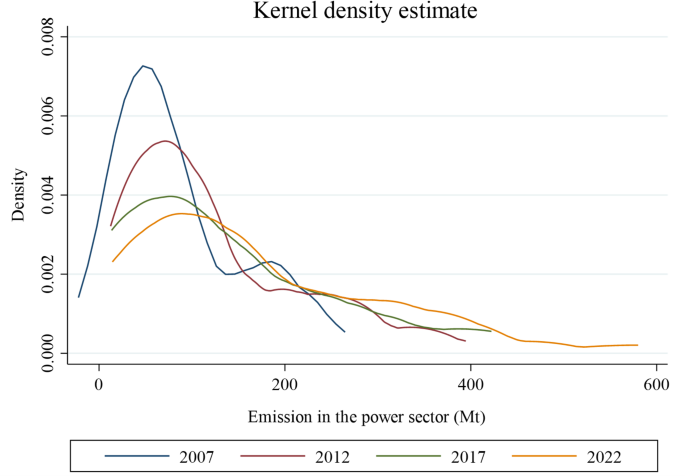
Kernel density estimate of CO2 emissions in power sector (2007, 2012, 2017, 2022).
Figure 4 delineates three distinct phases of emission evolution. From 2007 to 2012, rapid industrialization and urbanization drove nationwide emission surges, with coal-dependent provinces like Inner Mongolia (+ 96.87%) and Anhui (+ 98.69%) doubling emissions as they expanded coal-fired power capacity to meet soaring domestic and interprovincial electricity demand. Subsequently, the 2012–2017 phase marked a transitional period, as national policies such as the air pollution prevention and control action plan and coal consumption caps curbed coal use and improved energy efficiency. Beijing and Tianjin emerged as decarbonization leaders, achieving reductions of 21.53% and 13.51%, respectively, through coal-to-gas conversion, industrial relocation, and stringent energy conservation mandates. However, progress remained uneven, with many provinces prioritizing economic growth over emission controls. Post-2017, regional trajectories diverged sharply: eastern provinces like Jiangsu and Guangdong accelerated decarbonization via renewable energy integration and industrial upgrades, while resource-rich regions such as Inner Mongolia and Shanxi regressed due to renewed coal investments and delayed transitions, exemplifying the dual challenges of fossil fuel lock-in and institutional inertia. This widening gap underscores the necessity for spatially targeted policies to reconcile regional disparities in China’s energy transition.
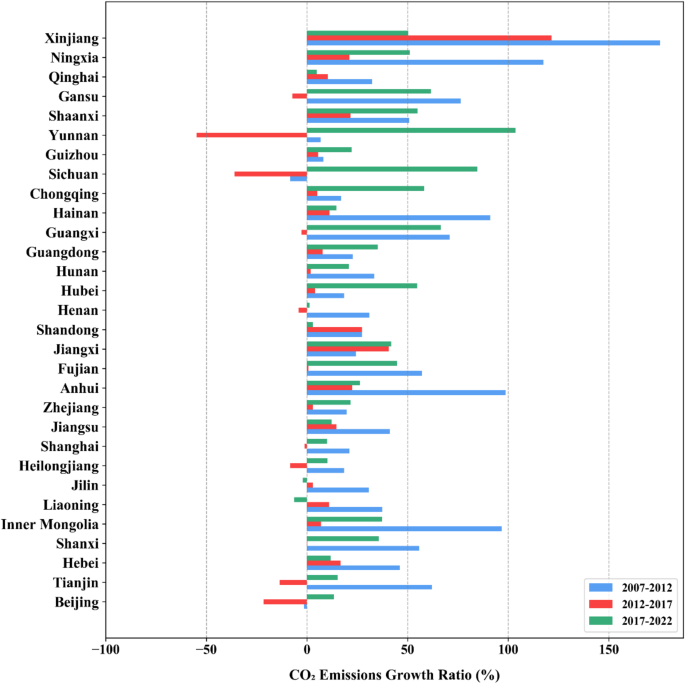
CO2 emissions growth rates in power sector (2007–2012, 2012–2017, 2017–2022).
Figure 5 reveals a stark divergence in emission trends: northern energy hubs maintained high pre-2017 emission levels, while eastern provinces achieved significant post-2017 reductions through renewable energy adoption and industrial restructuring. Eastern regions, particularly Shanghai and Zhejiang, drove decarbonization by integrating offshore wind and distributed solar power, optimizing smart grid infrastructure, and implementing stricter energy efficiency standards. Shanghai capitalized on its coastal location to expand photovoltaic generation and enhance grid flexibility, while Zhejiang promoted distributed renewables through subsidies, green financing, and stringent regulations. In contrast, central and western provinces sustained elevated emissions due to entrenched fossil fuel reliance and slow clean energy deployment. These spatial disparities underscore structural challenges in China’s energy transition, including uneven technological capacity, resource distribution, and economic priorities. Addressing these imbalances necessitates region-specific policies tailored to local barriers, such as coal dependency in resource-rich areas and grid constraints in less developed regions.
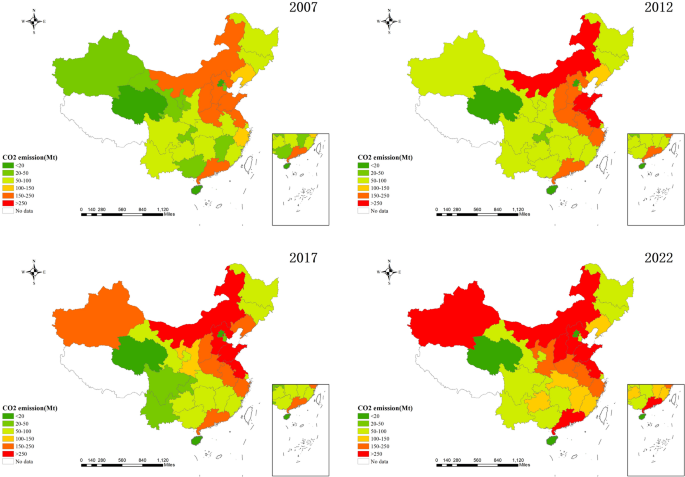
Provincial power sector CO2 emission distribution.
Analysis of the spatial correlation network structure of emission
Overall network analysis
Produced with NetDraw in UCINET, Fig. 6 depicts the spatial relationships of CO2 emissions in China’s power sector. Between 2007 and 2022, the sector’s emission network transitioned from an East-centered configuration to a more distributed, multipolar structure. Provinces with high GDP and large populations, such as Shanghai, Beijing, and Jiangsu, remain major emission contributors due to their reliance on fossil fuels and electricity imported from energy-abundant provinces like Shanxi and Inner Mongolia. Inner Mongolia and Shanxi function as “carbon hubs� within the national network, exporting both electricity and associated CO2 emissions to multiple regions. Network analysis reveals that these provinces exhibit high correlation, underscoring their critical intermediary roles in CO2 transmission. Despite growing investments in renewable energy, emissions in these provinces have not declined significantly, as coal power continues to dominate their energy systems. This highlights the structural challenges in decoupling economic growth from carbon-intensive energy use. With the advancement of the “West–East Power Transmission� policy, central and western regions, particularly Sichuan and Gansu, have become more prominent in the emission network through renewable energy sources. By 2022, interregional power connections had become more robust, indicating a national pattern in electricity consumption and production. This development highlights the importance of expanding renewable energy capacity, improving power market structures, and strengthening regional partnerships to lower emissions.
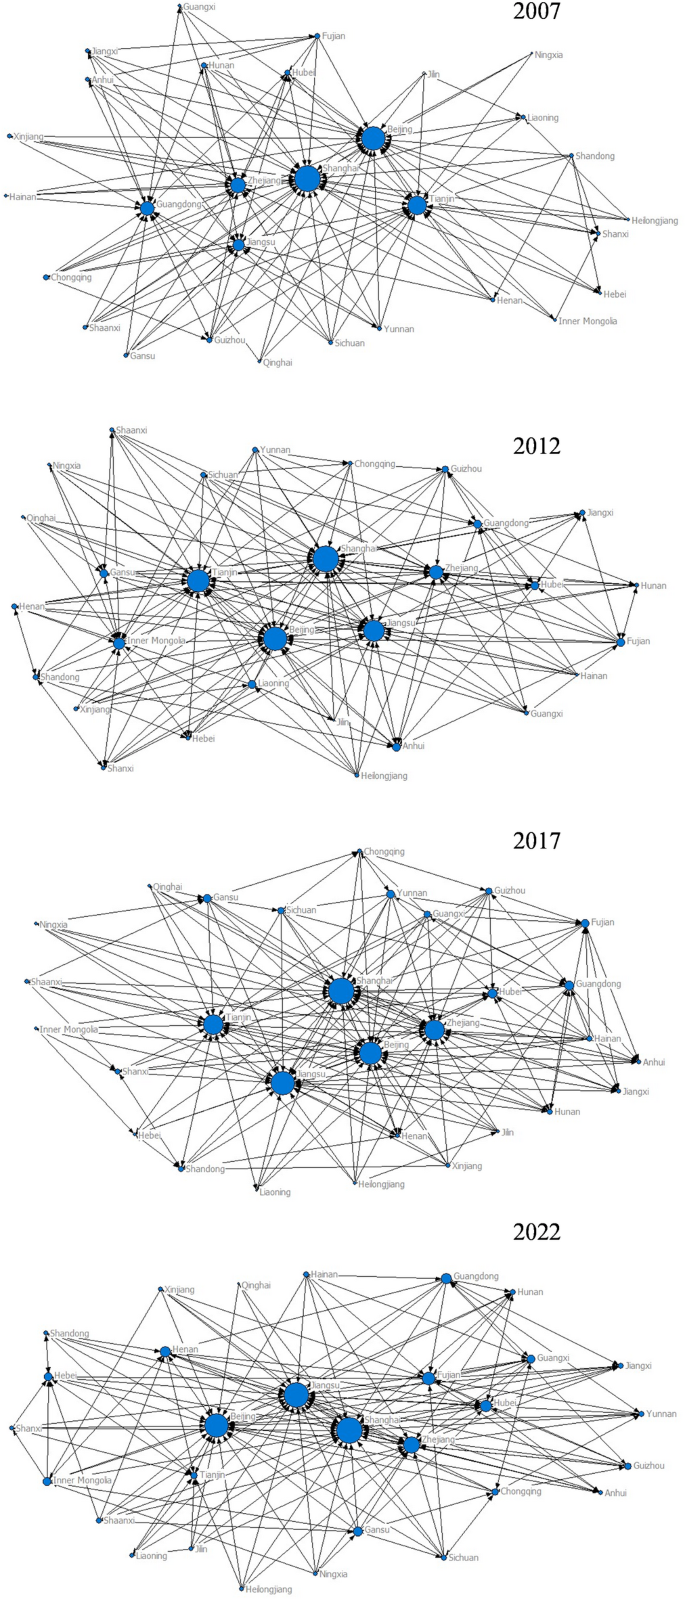
Spatial correlation network of CO2 in power sector (2007, 2012, 2017, 2022).
Connectedness, contacts and density analysis
From 2007 to 2022, the Connectedness value for CO2 emissions in the power sector stayed constant at 1, demonstrating significant spatial diffusion across adjacent provinces. Network Contacts and Density measure the extent of inter-provincial collaboration, reaching their highest point in 2014 with 211 contacts and a density of 0.24, as illustrated in Fig. 7. This peak signifies the apex of joint efforts. A decline afterward suggests the effects of policy enactment and weakened network strength69. Minor increases in 2017–2018 align with nationwide backing for renewable energy and environmental policies70. Post-2020 fluctuations are likely associated with post-COVID-19 economic resurgence and increasing energy consumption71.
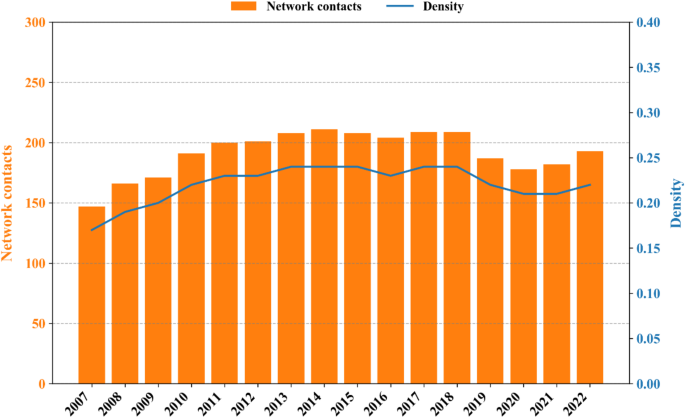
Network contacts and density of CO2 emission in power sector (2007–2022).
Hierarchy and efficiency analysis
Figure 8 illustrates a consistent decrease in Hierarchy, from 0.55 to 0.35, between 2007 and 2014, suggesting a lessening of hierarchical distinctions among provincial power authorities and a movement towards more equitable partnerships. This pattern corresponds with China’s power market reforms and growth in electricity trading between provinces, intended to improve resource use and support the increases of renewable energy sources72. The sharp increase in 2015 reflects greater centralized authority over CO2 emissions, possibly strengthening hierarchical arrangements in policy execution across provinces. The variability, particularly the downward trend from 2016 to 2018, implies that the sector is adjusting to new market and policy requirements, improving both information exchange and resource coordination.
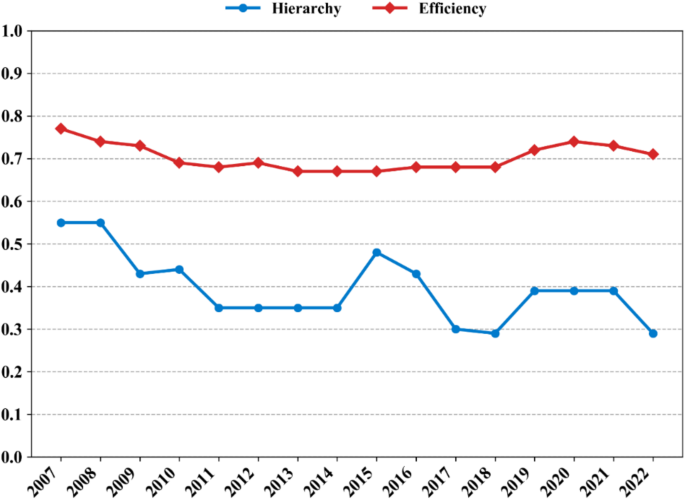
Hierarchy and efficiency of CO2 emission in power sector (2007–2022).
Efficiency stayed relatively constant, with a marginal increase from 2018 to 2020, indicating better resource distribution and information dissemination in response to CO2 reduction and renewable energy targets73. This consistent performance highlights the effects of innovation and enhanced management practices, demonstrating the power sector’s capacity for and adjustment to green energy transitions.
Centrality analysis
This study offers an in-depth analysis of centrality measures in the spatial network of CO2 emissions in power sector, focusing on Degree, Closeness, and Betweenness centralities. These measures shed light on the strategic function of each province in the network. From 2007 to 2022, leading provinces such as Beijing, Shanghai, Jiangsu, and Zhejiang maintained sustained influence in China’s energy and emissions landscape, holding key positions due to their advanced policy frameworks and resource management capabilities. Network analysis highlights Beijing and Jiangsu as central nodes, empowered by their robust policy implementation and information-sharing infrastructures. Beijing, as a pilot region for the national carbon trading market, has established stringent emission reduction regulations and advanced monitoring systems, enabling effective interprovincial collaboration. Similarly, Jiangsu leverages its developed industrial base and power market reforms to actively engage in cross-regional electricity trading and clean energy integration, enhancing its role in coordinating energy and CO2 flows across the network. These capabilities stand in stark contrast to coal-dependent provinces, where underdeveloped policy execution and limited information-sharing mechanisms hinder progress. Our analysis centers on the 2022 findings, which are presented in Fig. 9.
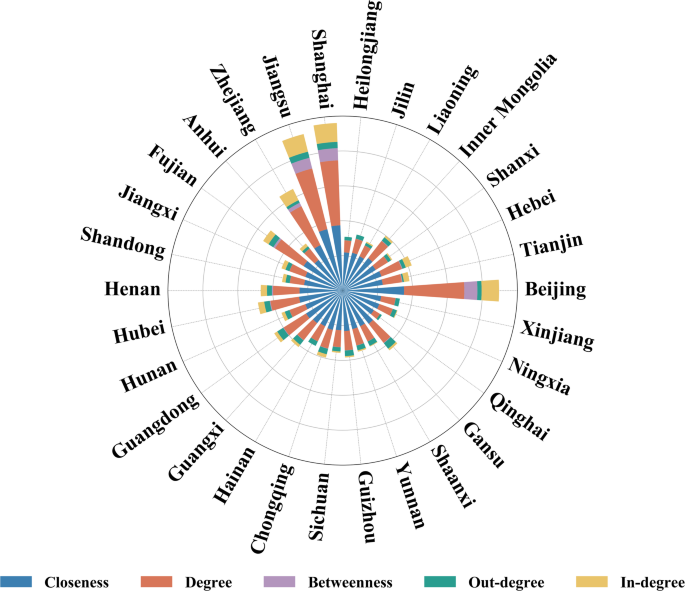
Centrality analysis of the CO2 emission (2022).
Point centrality
China’s provinces have an average in-degree and out-degree of 6.43. Provinces exceeding this average in out-degree, such as Guangdong, Gansu, Shanghai, and Jiangsu, exhibit significant capacity for resource dissemination and information exchange. Guangdong and Jiangsu, for instance, as economically developed areas, actively champion clean energy policies, facilitate technical collaborations, and advance market-based reforms. Provinces with above-average in-degree, including Shanghai, Jiangsu, and Beijing, hold influential positions in power sector decision-making and technological advancement.
The average degree centrality is 34.02. Provinces exceeding this average, including Shanghai, Jiangsu, and Beijing, are not only highly connected but also occupy central positions in the power network. Their extensive connectivity suggests significant potential to propel the energy transition and the integration of renewable energy sources; whereas, provinces with lower degree centrality scores, such as Qinghai, Liaoning, and Heilongjiang, occupy more peripheral network positions, presenting obstacles to their respective energy transitions.
Closeness centrality
The average closeness centrality across the provinces is 61.56, ranging from 52.73 to 93.55. Closeness centrality measures a node’s total distance to others in a network, with higher values indicating shorter, more direct connections that enable faster and more efficient coordination in energy transitions. Provinces like Shanghai, Jiangsu, and Beijing, which exhibit high centrality, benefit from privileged access to resources and information. This advantageous positioning allows them to rapidly implement emissions reduction policies, promote renewable energy adoption, and act as hubs for energy transition. For example, Jiangsu leverages its central role to trade renewable energy with Anhui, helping to stabilize grid fluctuations, while Beijing collaborates with Tianjin and Hebei to develop regional emission reduction strategies, fostering a low-carbon ecosystem. These efforts highlight how high closeness centrality facilitates clean energy adoption and cross-regional cooperation in emissions management, enabling these provinces to lead national sustainability goals. On the other hand, provinces with lower centrality, such as Qinghai and Heilongjiang, may face information deficits and logistical challenges, potentially limiting their ability to contribute effectively to broader network-wide sustainability initiatives.
Betweenness centrality
A betweenness centrality analysis across 30 provinces produced an average of 2.36, for a total of 70.69. Beijing, Shanghai, Jiangsu, Zhejiang, and Fujian surpassed this average, constituting 85.44% of the total. These regions function as crucial intermediaries in CO2 emission transmission, exerting significant effect over other provinces. Economically prosperous areas such as Shanghai, Tianjin, Beijing, Jiangsu, and Zhejiang, reflected by significant economic effect and extensive carbon trading markets, hold central positions in the network.
In contrast, Qinghai, Ningxia, Liaoning, Anhui, and Hainan exhibit significantly lower betweenness centrality values, representing only 0.40 (0.57% of the total). This points to a network imbalance, where their geographic isolation limits their effect on other provinces’ CO2 emissions, relegating them to peripheral network positions.
Block model analysis
The CO2 emissions spatial network is divided into four plates (Fig. 10) using the CONCOR tool in UCINET, with a maximum cutting degree of 2 and a convergence index of 0.2. The first plate comprises four provinces, representing economically developed areas. The second plate comprises three provinces experiencing comparatively rapid economic expansion. The third plate contains ten provinces, largely represented by energy-intensive industries located in central and northern regions. Finally, the fourth plate consists of thirteen provinces, primarily resource-rich yet economically less developed areas situated in western and southern China.
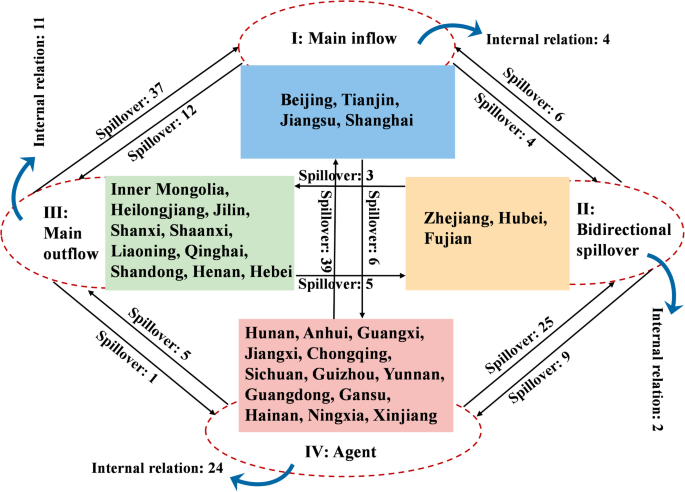
Four plates classification.
Block modeling reduces the complexity of networks by aggregating them into blocks and matrices. This method, utilizing spatial clustering, segments the network to appraise the roles and functions of each block74.
Table 3 outlines the functions of the sectors within the CO2 network. In Plate 1, provinces display strong internal emission connections (actual internal relation ratio at 15.38%, exceeding the expected 10.34%), suggesting close CO2 ties attributable to similar economic structures and regional collaborations. The significantly greater number of external inflows (82) compared to outflows (22) indicates that these economically advanced regions rely on external energy sources to sustain high levels of economic activity. Therefore, these regions function as “Main Inflow� regions, supporting economic growth through energy imports while lowering local CO2 emissions by utilizing external sources of clean energy. Provinces in Plate 2 demonstrate a slightly higher internal relationship ratio (10.00%) than expected (6.90%), indicating a certain level of emission connection. External inflows (34) and outflows (18) are relatively balanced, suggesting that these provinces both receive and transmit energy and its associated CO2 emission effects in the network. Crucial provinces such as Zhejiang, Hubei, and Fujian, essential to the economies of East and Central China, are categorized as “Bidirectional Spillover� regions given their dual function in power generation and distribution. Resource-abundant provinces in Plate 3 exhibit an internal relationship ratio of 20.37%, lower than the expected 31.03%, indicating weak emission connections in this group. Their effect is primarily external, supplying energy to other regions. With 43 outgoing and only 20 incoming connections, they constitute the key energy providers, functioning as “Main Outflow� roles in the CO2 network. The internal connection ratio of provinces in Plate 4 (25.81%) is below the expected (41.38%), suggesting weak internal emission relationships. However, with 69 outgoing connections, these provinces are integrated into the national CO2 emission network, acting as an “Agent� for power transmission.
To clarify the spatial relationships of CO2 emissions among plates, a density matrix was computed. The power sector’s emission density threshold was established at 0.22 in 2022. Plates surpassing this threshold suggest clustering and are designated as 1, while those below are coded as 0. As presented in Table 4, this approach effectively demonstrates CO2 emission diffusion and portrays the dynamics of emission transfer among provinces.
Table 3 indicates that plate I depends considerably on energy offered by plate III, with a correlation coefficient of 0.93. This suggests that emissions in central economic zones are greatly influenced by resource-producing provinces. This dependency exposes the susceptibility of advanced regions reflected by limited energy independence and reliance on outside sources (particularly plate III). Therefore, any changes in the energy mix, policies, or external markets in supplying regions could destabilize these areas. The decarbonization of plate I hinges not only on domestic technological advancements but also on the consistent supply and decarbonization efforts of energy-producing regions.
Resource-producing provinces shoulder CO2 abatement obligations, as the “export-carbon, import-benefit� structure can generate imbalanced advantages. In particular, plate III faces high emissions coupled with restrained economic expansion. To cultivate equitable regional progress, these provinces must reduce emissions and obtain economic or technical assistance from plate I to enable a sustainable transition. The bidirectional spillover plate II connects and governs the network through reciprocal exchanges with plates I and IV (0.50 and 0.23). Meanwhile, the agent plate IV functions as a conduit for CO2 and energy streams, sustaining robust connections with plates I and II (0.75 and 0.64). This intermediary function is essential for preserving the stability of the national energy supply network as both an energy transition pathway and a CO2 emission control point.
Energy transition effect on CO2 emission network
Results of the panel data model
Table 5 illustrates the impact of energy transition on the network. The overall network characteristics are time-series averages of individual network data. Models (1) to (3) estimate ETD effects on network density, contacts, and efficiency. ETD positively affects density and contacts (0.3512 and 0.3545), indicating that greater clean energy use strengthens network density and interregional connections. This suggests that promoting renewable energy during energy transition has strengthened regional coordination in power dispatch, creating stronger connections in emission management across regions. Conversely, ETD negatively affects efficiency (− 0.1464), suggesting that a higher clean energy share reduces overall network efficiency, potentially due to renewable energy’s variability and the resulting challenges in dispatch and storage.
Regarding control variables, PC has a significant negative impact on density and contacts, indicating that as household power consumption rises, network density and connectivity decrease. This may be attributed to the increased difficulty in scheduling. However, its effect on efficiency is significantly positive, implying that higher power consumption enhances power allocation efficiency. Other variables (APCR, PIR, FI, CTP, and ECI) exhibit insignificant effects on network characteristics, suggesting their limited influence on the network.
Overall, while increasing the proportion of non-fossil energy, consideration should be given to improving the stability and scheduling efficiency of new energy technologies. This can reconcile the tension between increased network density and decreased efficiency, thus optimizing the overall performance of the power network during the energy transition.
Considering the small sample size, the OLS method may produce biased estimates. To appraise how the energy transition affects individual characteristics in the CO2 emissions network, we employ a panel data model, presented in Table 5. Hausman test results, with p-values of 0.000 for Models (4) to (6), support the application of a fixed effects (FE) model.
Table 6 illustrates the relationship between the energy transition and the centrality of provincial power sectors in the CO2 emission network. As an independent variable, ETD significantly positively impacts degree, betweenness and closeness centrality. A 1% increase in ETD corresponds to a 0.4046% increase in betweenness centrality, a 0.0186% increase in closeness centrality, and a 0.1233% rise in degree centrality. These results indicate that as non-fossil fuel power generation expands, provincial power sectors occupy increasingly important positions in the network. Degree centrality represents a province’s direct connections, suggesting that the energy transition facilitates greater inter-provincial CO2 interaction. The observed increase in betweenness centrality indicates that certain provinces function as crucial intermediaries in CO2 coordination, bridging and influencing interprovincial carbon flows. This intermediary function is vital as the transfer of CO2 across regions is a fundamental component of the energy transition. Geographic location, economic development, and energy structure are factors that drive certain provinces to become key nodes in the emission network. This observation is consistent with the “Emission Transfer� theory, which hypothesizes that CO2 moves from regions with more stringent regulations to those with less stringent regulations75. Meanwhile, the growth of closeness centrality suggests that the network paths for certain provinces are now shorter, enabling faster and more efficient cooperation in CO2 management. This may be a consequence of accelerated energy transitions, where increased reliance on non-fossil fuels improves energy efficiency, thereby strengthening the overall coherence of the emission network.
Higher levels of APCR correlate positively with all three centrality measures, indicating that provinces generating more electricity for their own use hold greater influence in the emissions network; whereas, PIR demonstrates a negative correlation, suggesting reduced centrality for provinces reliant on external power. Increased FI corresponds to higher betweenness and degree centrality, implying that greater investment strengthens connectivity and a province’s overall network role. ECI negatively correlates with all centrality measures, indicating that provinces with lower energy efficiency are less central, potentially due to lagging energy transitions.
These findings imply that China’s transition to renewable energy will restructure provincial CO2 emission networks, potentially generating a “beggar-thy-neighbor� effect. Provinces leading in clean energy adoption may shift emissions to those transitioning more slowly through industrial relocation, thereby redistributing, rather than decreasing, total emissions. Meanwhile, leading provinces may decrease their reliance on external energy by increasing self-sufficiency or by strengthening partnerships with other provinces through technology and knowledge sharing, solidifying their central positions in the emissions network. Overall, energy transition requires balancing emission reductions in developed provinces with preventing emission increases in those transitioning more slowly. The evolution of network depends on how to manage inter-provincial dependencies and cooperation.
Lag effect
To account for the delayed influence of ETD on the CO2 emissions network, a one-period lag of ETD is included as a predictor variable. This reflects the near-term consequences of prior transitions and helps control for autocorrelation, thereby increasing model stability. Table 7 demonstrates that lagged ETD significantly increases network density (0.2809), contacts (0.2828), betweenness centrality (0.2552), closeness centrality, and degree centrality. This finding indicates that growth in non-fossil energy sources strengthens network connectivity and enhances the central positions of certain nodes, cultivating a more effective CO2 control network.
The lagged negative effect of ETD on efficiency (− 0.1238) deserves consideration. While the growth of non-fossil energy improves network structure, it may temporarily decrease efficiency due to lags in technological adaptation and infrastructure adjustments during the transition process. In the initial phases of non-fossil energy integration, the power sector may experience transient efficiency reductions resulting from constraints in equipment modernization and technical optimizations.
This lagged effect of non-fossil power generation on the CO2 emissions network indicates that the energy transition strengthens network structure, particularly concerning regional collaboration and information exchange. Simultaneously, it highlights short-term variability in efficiency. Therefore, policymakers should prioritize a balance between network connectivity and operational efficiency to ensure incremental advancements in near-term energy utilization while pursuing long-term decarbonization objectives.
Robustness check
To assess the reliability of the regression results, this study employs several tests analyzing the effect of energy transition on the CO2 emission network. We first appraise both overall and individual network indicators to confirm the stability of the results. In line with Wang et al.76, robustness evaluations, incorporating control variables sequentially (models 13–19 in Table 8), indicate that ETD maintains its significance. To account for possible endogeneity, the primary model is re-evaluated utilizing Two-Stage Least Squares (2SLS) with the instrumental variable (DCF)77. Results from models 20 and 21 demonstrate that ETD retains a high level of significance. The Kleibergen–Paap rk LM and Cragg–Donald Wald F statistics support the validity of the chosen instruments. Overall, the robustness tests validate the stability about the energy transition’s effect on CO2 emissions in the power sector across various model specifications and estimation methods.
Results from quantile regressions
Employing quantile regression analysis, we further explore the heterogeneous effects of energy transition on the structure of emission networks at different points in the distribution. Due to sample size considerations and estimator performance, this method focuses solely on analyzing its influence on individual network properties. Table 9 indicates that the effect of ETD on three network metrics (betweenness, closeness, and degree) varies significantly across quantiles. In the Betweenness model, ETD coefficients at the 25th, 50th, and 75th quantiles are 0.3863, 0.4045, and 0.4211, respectively. This suggests a consistently positive association between energy transition and node importance, an association which becomes more significant at higher quantiles.
The effect of ETD on closeness is significant at the 50th and 75th percentiles, suggesting that energy transition primarily drives increased closeness in medium- and high-emission nodes, with less significant effects on low-emission networks. In the degree model, ETD’s effect remains significant across all percentiles, particularly at the 75th percentile, where it exhibits a coefficient of 0.1404. This observation strengthens the positive association between energy transition and emission network connectivity across various distributional levels. Other control variables, including APCR and ECI, also demonstrate significance across different percentiles. Specifically, ECI consistently produces a significant negative effect on both betweenness and degree, suggesting that provinces represented by lower energy consumption efficiency tend to exhibit reduced nodal importance and connection strength.
In summary, the quantile regression results further confirm the heterogeneous effect of energy transition on emission network structure across the distribution. The role of energy transition appears particularly important in enhancing the importance and connectivity of network nodes in high-emission provinces.
Discussion
Impacts of energy transition on CO2 network structure
China’s energy transition in the power sector has brought notable changes to the structure of interprovincial CO2 emission networks. While it has strengthened connectivity across regions, it has also introduced new challenges that require careful policy attention. Key metrics such as Density, Contacts, and Efficiency illustrate these dynamics. Rising network density (0.3512) and contacts (0.3545) indicate stronger interprovincial linkages, but a slight decline in efficiency (− 0.1464) highlights persistent technical and coordination barriers. This duality reflects the complexity of renewable energy integration: while it enhances connectivity, it also introduces inefficiencies due to renewable variability and uneven policy implementation.
The evolution of interprovincial cooperation underscores the critical role of policy in shaping collaboration. During the early 12th Five-Year Plan, strict policy enforcement strengthened cooperation, but the subsequent decline in Contacts and Density suggests weakening ties as policy incentives diminished. This highlights the need for institutionalized, long-term mechanisms to sustain collaboration and reduce reliance on short-term interventions78. Fluctuations in Efficiency reveal that many interprovincial linkages involve redundant or inefficient CO2 flows, emphasizing the need for optimized energy dispatch, improved grid infrastructure, and a stronger national carbon trading system to enhance cost-effective emission reduction79. Additionally, the decline in Density, likely linked to greater reliance on local energy sources, calls for enhanced interprovincial clean energy exchange to balance local autonomy with national decarbonization goals80.
Drivers and constraints of interprovincial CO2 connectivity
Energy transition has been driven by several key forces that strengthened interprovincial CO2 connectivity, though notable constraints still remain. First, the uneven distribution of renewable resources has driven cross-provincial electricity trade81, with resource-rich provinces such as Inner Mongolia and Xinjiang supplying clean power to developed regions like Jiangsu and Zhejiang. Second, policies such as renewable consumption mandates and carbon trading have reinforced coordination, strengthening CO2 linkages82. Third, rapidly transitioning provinces such as Jiangsu and Sichuan have emerged as central nodes, facilitating the redistribution of electricity and fostering a more interconnected CO2 network83. These shifts have contributed to a more integrated framework for emission reduction and policy coordination.
However, technical and coordination challenges persist. The intermittency of wind and solar power, combined with insufficient storage and transmission capacity84, has led to renewable curtailment in Inner Mongolia and Xinjiang. Policy discrepancies across provinces further complicate coordination85, as Beijing and Shanghai prioritize renewables, while Shanxi and Inner Mongolia remain coal-dependent. Moreover, fragmented transmission systems and market structures hinder efficient electricity exchange86, as evidenced by Beijing’s struggles to secure external renewable power. These barriers highlight the need for a more coordinated national strategy to address both technical and policy-related inefficiencies.
Policy implications for a coordinated energy transition
Addressing the technical and institutional barriers identified above requires a series of coordinated policy measures. First, a unified national electricity market would facilitate renewable integration and improve dispatch efficiency87. Second, strengthening regional carbon compensation mechanisms would ensure that energy-exporting provinces receive adequate financial support for their low-carbon transition, promoting equitable investment in green technologies88. Third, leading provinces such as Beijing and Jiangsu should share policy frameworks and technological expertise to accelerate renewable adoption in less-developed regions. Additionally, expanding energy storage capacity89, incentivizing coal-dependent provinces to transition90, and fostering stronger interprovincial cooperation will be critical to building a more efficient and resilient CO2 emission network.
In conclusion, while energy transition has reinforced interprovincial CO2 linkages, achieving long-term carbon neutrality requires balancing regional energy independence with national policy coordination. Establishing stable cross-provincial collaboration, optimizing resource allocation, and ensuring sustained policy enforcement will be essential to maintaining momentum in the low-carbon transition. These findings underscore the importance of aligning local and national strategies to ensure an efficient and equitable energy transition in China’s power sector.
Conclusions and policy implications
This study applies SNA to outline the evolution of the CO2 emissions network in China’s power sector and explore the position of each province and clustering patterns. Moreover, it analyzes the effect of energy transition on the emissions network with a panel model.
Conclusions
According to the results of the model, we have drawn the following conclusions:
-
1.
Between 2007 and 2022, China’s provincial CO2 emissions from the power sector exhibited regional heterogeneities. Provinces reliant on fossil fuels, such as Inner Mongolia and Shanxi, encounter challenges in transitioning, whereas Beijing and Shanghai have decreased emissions through the integration of clean energy, indicating asymmetries in reduction strategies.
-
2.
Provinces differ in resource connections and information exchange in the CO2 emissions network. Central regions exhibit high centrality and can effectively direct reduction efforts, while the peripheral positions of most provinces constrain network effectiveness.
-
3.
Provinces such as Beijing, Shanghai, and Jiangsu depend on energy from other regions, causing an unequal allocation of CO2 reduction responsibilities, which emphasizes the necessity for greater interregional energy collaboration.
-
4.
Panel model analysis shows that a strengthened energy transition increases network density and connections but reduces efficiency. Provinces rapidly experiencing transition assume central roles in CO2 emission networks through interprovincial collaborations. Greater degree and betweenness centrality suggest more direct connections and critical intermediary roles. The decline in efficiency, however, reflects challenges in coordinating clean energy infrastructure and cross-regional partnerships. The lag analysis indicates that non-fossil power generation favorably affects the CO2 network, particularly strengthening the significance and connectivity of high-emission provinces.
Policy recommendations
According to these findings, we offer the following policy recommendations:
-
1.
To achieve carbon neutrality, prioritize support for high-emission areas to upgrade clean energy technologies. Encourage eastern regions to improve energy efficiency and renewable energy use, concentrating on reducing emissions and balancing supply–demand in western energy-exporting areas.
-
2.
Policies should enhance CO2 network efficiency by fostering stronger linkages between peripheral and developed provinces, facilitating resource and expertise exchange. For coal-dependent regions like Inner Mongolia and Shanxi, targeted financial mechanisms and industrial transition strategies are essential to reduce coal reliance. Key measures include upgrading grid infrastructure to improve renewable energy integration, reforming power market mechanisms to ensure equitable compensation for clean energy exports, and promoting industrial diversification to lessen economic dependence on coal. Furthermore, expanding interprovincial electricity trading systems could enable these regions to curtail coal-fired generation while maintaining energy security, supporting a more balanced and sustainable energy transition. Besides, the network function of less-connected provinces should be enhanced through funding and technology dissemination.
-
3.
“Main inflow� regions should reduce reliance on high-carbon energy, support sustainable energy transitions in resource-producing areas, and amplify the mediating function of “bidirectional spillover� and “agent� regions to facilitate inter-regional emission reduction cooperation. Strengthening carbon trading mechanisms and incentives in the power sector will further propel the energy transition.
-
4.
To advance energy transition and improve network efficiency, policymakers should incentivize provincial investments in technology and energy infrastructure, particularly clean energy distribution systems and interprovincial partnerships. Measures are necessary to avert the “beggar-thy-neighbor� effect, wherein developed regions transfer their carbon burdens to slower-transitioning provinces. A coordinated regional policy is advised to ensure fair CO2 responsibility. High-centrality provinces (e.g., Shanghai, Beijing, Jiangsu, Zhejiang) should spearhead technological advancement and low-carbon development in the power sector. Constructing a shared platform for technology exchange will further support clean energy integration and efficient CO2 abatement through enhanced interprovincial collaboration.
This study provides valuable insights into the dynamics of CO2 emissions reduction in China’s power sector, but several limitations should be acknowledged. First, the use of provincial-level data may obscure intra-provincial heterogeneity in energy structures and decarbonization efforts. Variations in energy transition progress across cities and industrial sectors within provinces could significantly influence emission patterns and network dynamics. Second, the analysis does not fully account for policy and institutional differences across provinces, which are critical in shaping energy transition outcomes. Disparities in the implementation of renewable energy policies, carbon trading mechanisms, and subsidy programs may lead to uneven emission reduction trajectories. Third, the findings are specific to China’s energy system, which differs from other countries in terms of market structure, regulatory frameworks, and domestic energy coordination. This limits the generalizability of the results to other regions without further validation. Finally, reliance on historical data may affect the accuracy of long-term emission projections, as future technological advancements and policy shifts could alter the pace and scale of decarbonization.
Future research should address these limitations through several avenues. First, integrating more granular data at the city or sectoral level could better capture regional disparities in energy transition. Second, incorporating policy heterogeneity into analytical frameworks would help assess how different regulatory environments influence emission reduction pathways. Third, cross-country comparative studies could validate the applicability of these findings in diverse institutional and economic contexts. Additionally, employing scenario-based modeling or advanced machine learning techniques could enhance the robustness of long-term emission forecasts, providing a stronger foundation for policy formulation and strategic planning in the power sector.
Data availability
Data used in this study are available from the corresponding authors upon reasonable request.
References
-
Wang, Y. & Qian, Y. Driving factors to agriculture total factor productivity and its contribution to just energy transition. Environ. Impact Assess. Rev. 105, 107369 (2024).
-
Fan, J. et al. A net-zero emissions strategy for China’s power sector using carbon-capture utilization and storage. Nat. Commun. 14, 5972 (2023).
-
Luo, S. et al. Transition pathways towards a deep decarbonization energy system—A case study in Sichuan, China. Appl. Energy 302, 117507 (2021).
-
Zhang, S. & Chen, W. Assessing the energy transition in China towards carbon neutrality with a probabilistic framework. Nat. Commun. 13, 87 (2022).
-
Zou, Y. & Wang, M. Does environmental regulation improve energy transition performance in China?. Environ. Impact Assess. Rev. 104, 107335 (2024).
-
Xiao, J., Li, G., Xie, L., Wang, S. & Yu, L. Decarbonizing China’s power sector by 2030 with consideration of technological progress and cross-regional power transmission. Energy Policy 150, 112150 (2021).
-
Luo, H. et al. Deciphering the point source carbon footprint puzzle: Land use dynamics and socio-economic drivers. Sci. Total Environ. 957, 176500 (2024).
-
Zhu, Y., Xu, Y. & Yin, S. How does digital technology innovation drive synergies for reducing pollution and carbon emissions?. Sustain. Cities Soc. 116, 105932 (2024).
-
Karamanis, D. et al. Transitioning to building integration of photovoltaics and greenery (BIPVGREEN): Case studies up-scaling from cities informal settlements. Environ. Res. Infrastruct. Sustain. 4 (2024).
-
Yang, Y., Yuan, Z. & Gao, H. Allocating quotas for industrial carbon emissions fairly and efficiently to achieve “peak carbon�: A case of the yellow river basin in China. Energy 311, 133472 (2024).
-
Kawabata, T. Network analysis on energy transition cooperation between countries. Energy Sustain. Dev. 81, 101503 (2024).
-
Zhang, G., Yang, Y., Su, B., Nie, Y. & Duan, H. Electricity production, power generation structure, and air pollution: A monthly data analysis for 279 cities in China (2015–2019). Energy Econ. 120, 106597 (2023).
-
Vagnini, C., Canal Vieira, L., Longo, M. & Mura, M. J. R. S. Regional drivers of industrial decarbonisation: A spatial econometric analysis of 238 EU regions between 2008 and 2020. Reg. Stud., 1–13 (2024).
-
Weng, C., Huang, J. & Greenwood-Nimmo, M. The effect of clean energy investment on CO2 emissions: Insights from a Spatial Durbin Model. Energy Econ. 126, 107000 (2023).
-
Liu, X., Niu, Q., Dong, S. & Zhong, S. How does renewable energy consumption affect carbon emission intensity? Temporal-spatial impact analysis in China. Energy 284, 128690 (2023).
-
Sun, X., Lian, W., Gao, T., Chen, Z. & Duan, H. Spatial-temporal characteristics of carbon emission intensity in electricity generation and spatial spillover effects of driving factors across China’s provinces. J. Clean. Prod. 405, 136908 (2023).
-
Liu, S., Chevallier, J. & Xiao, Q. Identifying influential countries in air pollution control technologies: A social network analysis approach. J. Clean. Prod. 389, 136018 (2023).
-
Pan, J. et al. Analysis of the impact of China’s energy industry on social development from the perspective of low-carbon policy. Energy Rep. 8, 14–27 (2022).
-
Yang, Y. & Su, X. Spatial correlation network structure of carbon emission reduction capacity on urban agglomerations and its driving factors: A perspective of Sustainable Development Goals. Sustain. Cities Soc. 113, 105646 (2024).
-
Geng, Y., Xiang, Q., Gao, J., Yan, Y. & Li, J. Progress and framework of clean energy production: Bibliometric analysis from 2002 to 2022. Energy Strategy Rev. 52, 101270 (2024).
-
Xia, Q., Tian, G. & Wu, Z. Examining embodied carbon emission flow relationships among different industrial sectors in China. Sustain. Prod. Consum. 29, 100–114 (2022).
-
Li, Y., Feng, T., Liu, L. & Zhang, M. How do the electricity market and carbon market interact and achieve integrated development? A bibliometric-based review. Energy 265, 126308 (2023).
-
Xu, H., Li, Y., Zheng, Y. & Xu, X. Analysis of spatial associations in the energy–carbon emission efficiency of the transportation industry and its influencing factors: Evidence from China. Environ. Impact Assess. Rev. 97, 106905 (2022).
-
Huang, S. The effect of natural resources and economic factors on energy transition: New evidence from China. Resour. Policy 76, 102620 (2022).
-
Kinyar, A. & Bothongo, K. The impact of renewable energy, eco-innovation, and GDP growth on CO2 emissions: Pathways to the UK’s net zero target. J. Environ. Manag. 368, 122226 (2024).
-
Qi, Y., Lu, J. & Liu, T. Measuring energy transition away from fossil fuels: A new index. Renew. Sustain. Energy Rev. 200, 114546 (2024).
-
Nan, S., Huo, Y., You, W. & Guo, Y. Globalization spatial spillover effects and carbon emissions: What is the role of economic complexity?. Energy Econ. 112, 106184 (2022).
-
Kartal, M. T., Pata, U. K., Kılıç Depren, S. & Erdoğan, S. Time, frequency, and quantile-based impacts of disaggregated electricity generation on carbon neutrality: Evidence from leading European Union countries. Int. J. Sustain. Dev. World 31, 89–107 (2024).
-
Wang, H. & Liu, P. Spatial correlation network of renewable energy consumption and its influencing factors: Evidence from 31 Chinese provinces. Renew. Energy 217, 119173 (2023).
-
Guchhait, R. et al. Extended material requirement planning (MRP) within a hybrid energy-enabled smart production system. J. Ind. Inf. Integr. 42, 100717 (2024).
-
Amankou, K. A. C., Guchhait, R., Sarkar, B. & Dem, H. Product-specified dual-channel retail management with significant consumer service. J. Retail. Consum. Serv. 79, 103788 (2024).
-
Habib, M. S. et al. A robust possibilistic programming approach toward animal fat-based biodiesel supply chain network design under uncertain environment. J. Clean. Prod. 278, 122403 (2021).
-
Garai, A. & Sarkar, B. Economically independent reverse logistics of customer-centric closed-loop supply chain for herbal medicines and biofuel. J. Clean. Prod. 334, 129977 (2022).
-
Sarkar, B., Mridha, B. & Pareek, S. A sustainable smart multi-type biofuel manufacturing with the optimum energy utilization under flexible production. J. Clean. Prod. 332, 129869 (2022).
-
Zhang, X., Xu, W., Rauf, A. & Ozturk, I. Transitioning from conventional energy to clean renewable energy in G7 countries: A signed network approach. Energy 307, 132655 (2024).
-
Yang, S. et al. Is artificial intelligence technology innovation a recipe for low-carbon energy transition? A global perspective. Energy 300, 131539 (2024).
-
Wang, H. et al. Sustainable energy transition in cities: A deep statistical prediction model for renewable energy sources management for low-carbon urban development. Sustain. Cities Soc. 107, 105434 (2024).
-
Yang, F., Yang, X. & Li, X. China’s diverse energy transition pathways toward carbon neutrality by 2060. Sustain. Prod. Consum. 47, 236–250 (2024).
-
Xie, H. & Bui, W. K. T. Impact of globalization and energy consumption on CO2 emissions in China: Implications for energy transition. Financ. Res. Lett. 67, 105939 (2024).
-
Chen, W. & Yan, S. The decoupling relationship between CO2 emissions and economic growth in the Chinese mining industry under the context of carbon neutrality. J. Clean. Prod. 379, 134692 (2022).
-
Liu, S. & Xiao, Q. An empirical analysis on spatial correlation investigation of industrial carbon emissions using SNA-ICE model. Energy 224, 120183 (2021).
-
Su, Y. & Yu, Y. Spatial association effect of regional pollution control. J. Clean. Prod. 213, 540–552 (2019).
-
Wu, X., Wang, L. & Zheng, H. A network effect on the decoupling of industrial waste gas emissions and industrial added value: A case study of China. J. Clean. Prod. 234, 1338–1350 (2019).
-
Bai, C., Zhou, L., Xia, M. & Feng, C. Analysis of the spatial association network structure of China’s transportation carbon emissions and its driving factors. J. Environ. Manag. 253, 109765 (2020).
-
Tang, Y. et al. Estimation of emission factors from purchased electricity for European countries: Impacts on emission reduction of electricity storage. Environ. Sci. Technol. 56, 5111–5122 (2022).
-
Zheng, Y., Tang, J. & Huang, F. The impact of industrial structure adjustment on the spatial industrial linkage of carbon emission: From the perspective of climate change mitigation. J. Environ. Manag. 345, 118620 (2023).
-
Cheng, H., Wu, B. & Jiang, X. Study on the spatial network structure of energy carbon emission efficiency and its driving factors in Chinese cities. Appl. Energy 371, 123689 (2024).
-
Fang, G., Huang, M. & Sun, C. Revealing the hidden carbon flows in global industrial sectors-based on the perspective of linkage network structure. J. Environ. Manag. 356, 120531 (2024).
-
Gao, Y. & Gao, M. Spatial correlation network of municipal solid waste carbon emissions and its influencing factors in China. Environ. Impact Assess. Rev. 106, 107490 (2024).
-
Zhang, L., Jiang, X., Li, Y., Xu, F. & Huang, X. Analysis of coupling coordination structural characteristics of water-energy-food-ecosystems based on SNA model: A case study in the nine provinces along the Yellow River, China. Phys. Chem. Earth Parts A/B/C 135, 103654 (2024).
-
Freeman, L. C. Centrality in social networks conceptual clarification. Soc. Netw. 1, 215–239 (1978).
-
Hsiao, C. Analysis of Panel Data 3rd edn. (Cambridge University Press, 2014).
-
Wang, Y. & Li, J. Spatial spillover effect of non-fossil fuel power generation on carbon dioxide emissions across China’s provinces. Renew. Energy 136, 317–330 (2019).
-
Shao, H. & Wang, Z. Spatial network structure of transportation carbon emission efficiency in China and its influencing factors. Chin. J. Popul. Resour. Environ. 19, 295–303 (2021).
-
Shahnazi, R. & Dehghan Shabani, Z. The effects of renewable energy, spatial spillover of CO2 emissions and economic freedom on CO2 emissions in the EU. Renew. Energy 169, 293–307 (2021).
-
Chen, Y., Shao, S., Fan, M., Tian, Z. & Yang, L. One man’s loss is another’s gain: Does clean energy development reduce CO2 emissions in China? Evidence based on the spatial Durbin model. Energy Econ. 107, 105852 (2022).
-
Zhao, J., Jiang, Q., Dong, X., Dong, K. & Jiang, H. How does industrial structure adjustment reduce CO2 emissions? Spatial and mediation effects analysis for China. Energy Econ. 105, 105704 (2022).
-
Wang, Y., Yan, Q., Yang, J., Komonpipat, S. & Zhang, Q. Can inter-provincial transmission reduce regional carbon emissions? Evidence from China. Energy Policy 184, 113915 (2024).
-
Hausman, J. A. Specification tests in econometrics. Econometrica 46, 1251–1271 (1978).
-
Koenker, R. & Bassett, G. Regression quantiles. Econometrica 46, 33–50 (1978).
-
Wadho, W., Goedhuys, M. & Chaudhry, A. Young innovative companies and employment creation, evidence from the Pakistani textiles sector. World Dev. 117, 139–152 (2019).
-
Lee, C., Yuan, Z. & Lee, C. A nonlinear analysis of the impacts of information and communication technologies on environmental quality: A global perspective. Energy Econ. 128, 107177 (2023).
-
Machado, J. A. F. & Santos Silva, J. M. C. Quantiles via moments. J. Econom. 213, 145–173 (2019).
-
National Bureau of Statistics of China (NBSC). China Energy Statistical Yearbook 2022 (China Statistics Press, 2022).
-
National Development and Reform Commission (NDRC). Guidelines for the preparation of provincial greenhouse gas inventories (trial) (National Development and Reform Commission Climate Division, 2011).
-
IPCC. 2006 IPCC guidelines for national greenhouse gas inventories. Geneva: Intergovernmental Panel on Climate Change. (Institute for Global Environmental Strategies, 2006).
-
National Bureau of Statistics of China (NBSC). China Energy Statistical Yearbook (China Statistics Press, 2007–2022).
-
National Bureau of Statistics of China (NBSC). China Statistics Yearbook (China Statistics Press, 2007–2022).
-
Liu, S. et al. Emission reduction path for coal-based enterprises via carbon capture, geological utilization, and storage: China energy group. Energy 273, 127222 (2023).
-
Wen, W. et al. Critical provincial transmission sectors for carbon dioxide emissions in China. Renew. Sustain. Energy Rev. 149, 111415 (2021).
-
Tian, J., Yu, L., Xue, R., Zhuang, S. & Shan, Y. Global low-carbon energy transition in the post-COVID-19 era. Appl. Energy 307, 118205 (2022).
-
Li, Q., Zhang, P. & Chen, J. Does energy transformation improve green development efficiency? Evidence from Sichuan Province, China. Energy Rep. 12, 861–871 (2024).
-
Dong, F. et al. Measurement and decomposition of environmental efficiency in the power industry based on multi-hierarchy meta-frontier BAM model. J. Clean. Prod. 441, 140818 (2024).
-
Lv, K., Feng, X., Kelly, S., Zhu, L. & Deng, M. A study on embodied carbon transfer at the provincial level of China from a social network perspective. J. Clean. Prod. 225, 1089–1104 (2019).
-
Jakob, M. & Marschinski, R. Interpreting trade-related CO2 emission transfers. Nat. Clim. Change 3, 19–23 (2013).
-
Wang, S., Zhao, D. & Chen, H. Government corruption, resource misallocation, and ecological efficiency. Energy Econ. 85, 104573 (2020).
-
Viglioni, M. T. D. et al. Effects of intellectual property rights on innovation and economic activity: A non-linear perspective from Latin America. Struct. Change Econ. Dyn. 67, 359–371 (2023).
-
Elliott, C., Worker, J., Levin, K. & Ross, K. Good governance for long-term low-emissions development strategies (World Resources Institute, 2019).
-
Sun, Q. et al. Multi-agent energy management optimization for integrated energy systems under the energy and carbon co-trading market. Appl. Energy 324, 119646 (2022).
-
Fu, W. State infrastructural power through scalar practices: On China’s decarbonization endeavors. Environ. Plan. A 56, 784–801 (2024).
-
Yan, S., Wang, W., Li, X. & Zhao, Y. Research on a cross-regional robust trading strategy based on multiple market mechanisms. Energy 261, 125253 (2022).
-
Shen, Q., Pan, Y. & Feng, Y. Identifying and assessing the multiple effects of informal environmental regulation on carbon emissions in China. Environ. Res. 237, 116931 (2023).
-
Pye, S. et al. An equitable redistribution of unburnable carbon. Nat. Commun. 11, 3968 (2020).
-
Liu, Z., Liu, B., Ding, X. & Wang, F. Research on optimization of energy storage regulation model considering wind-solar and multi-energy complementary intermittent energy interconnection. Energy Rep. 8, 490–501 (2022).
-
Guo, C., Lin, W., Jin, S., Zhao, D. & Feng, M. Regional coupling coordination and driving mechanisms of high-quality economic development and carbon emission intensity in Chinese provinces. Ecol. Front. (2024).
-
Skaloumpakas, P., Sarmas, E., Rachmanidis, M. & Marinakis, V. Reshaping the energy landscape of Crete through renewable energy valleys. Sci. Rep. 14, 8038 (2024).
-
Jia, K., Yang, X. & Peng, Z. Design of an integrated network order system for the main distribution network considering power dispatch efficiency. Energy Inform. 7, 69 (2024).
-
Obobisa, E. S. & Ahakwa, I. Stimulating the adoption of green technology innovation, clean energy resources, green finance, and environmental taxes: The way to achieve net zero CO2 emissions in Europe?. Technol. Forecast. Soc. Change 205, 123489 (2024).
-
Levin, T. et al. Energy storage solutions to decarbonize electricity through enhanced capacity expansion modelling. Nat. Energy 8, 1199–1208 (2023).
-
Gong, W. & Lewis, J. I. The politics of China’s just transition and the shift away from coal. Energy Res. Soc. Sci. 115, 103643 (2024).
Acknowledgements
This research was funded by the National Social Science Fund of China (Grant No. 23CJY027).
Author information
Authors and Affiliations
Contributions
Y.W. contributed to the conceptualization and methodology of the study and drafted the main manuscript; T.Z. conceived the research idea and supervised the project; X.Z. conducted the literature review and made substantial contributions to the revision of the paper; Q.T. and F.Z. were responsible for the preliminary investigation and data collection. All authors reviewed and approved the final manuscript.
Corresponding author
Ethics declarations
Competing interests
The authors declare no competing interests.
Additional information
Publisher’s note
Springer Nature remains neutral with regard to jurisdictional claims in published maps and institutional affiliations.
Electronic supplementary material
Below is the link to the electronic supplementary material.
Rights and permissions
Open Access This article is licensed under a Creative Commons Attribution-NonCommercial-NoDerivatives 4.0 International License, which permits any non-commercial use, sharing, distribution and reproduction in any medium or format, as long as you give appropriate credit to the original author(s) and the source, provide a link to the Creative Commons licence, and indicate if you modified the licensed material. You do not have permission under this licence to share adapted material derived from this article or parts of it. The images or other third party material in this article are included in the article’s Creative Commons licence, unless indicated otherwise in a credit line to the material. If material is not included in the article’s Creative Commons licence and your intended use is not permitted by statutory regulation or exceeds the permitted use, you will need to obtain permission directly from the copyright holder. To view a copy of this licence, visit http://creativecommons.org/licenses/by-nc-nd/4.0/.
About this article
Cite this article
Wei, Y., Zhao, T., Zhang, X. et al. Exploring the role of energy transition in shaping the CO2 emissions pattern in China’s power sector.
Sci Rep 15, 18794 (2025). https://doi.org/10.1038/s41598-025-99021-9
-
Received: 15 January 2025
-
Accepted: 16 April 2025
-
Published: 29 May 2025
-
DOI: https://doi.org/10.1038/s41598-025-99021-9
Keywords
Search
RECENT PRESS RELEASES
Related Post


