For stock market investors, focusing on Fed rate cuts is misguided 🔪
January 5, 2025
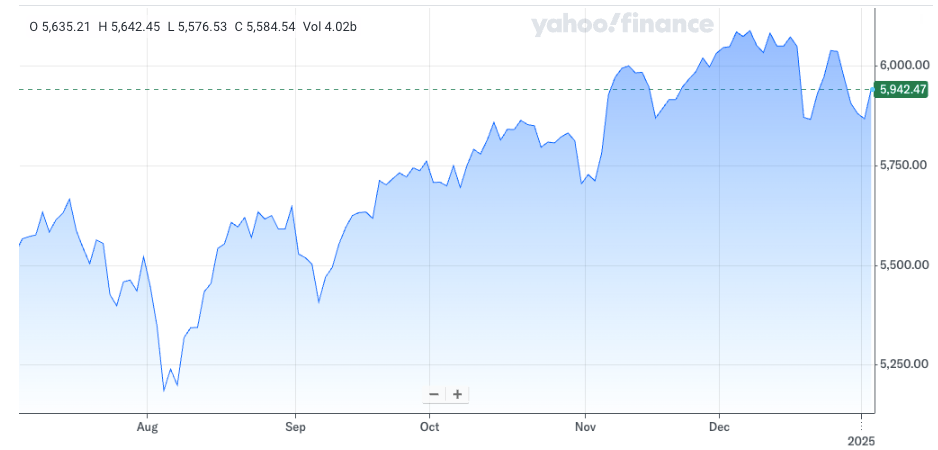
📈The stock market kicked off the year mixed, falling on the first trading day while bouncing back on the second. The S&P 500 is up 1%year to date and up 66.1% from its October 12, 2022 closing low of 3,577.03. For more on recent market moves, read: Investing in the stock market is an unpleasant process 📉
–
One of the biggest questions among market participants is how many times the Federal Reserve will cut rates in 2025. Some have even floated the possibility of a rate hike during the year.
The Fed and its decisions on monetary policy are important. Central bank actions affect the cost and availability of money, which can move the needle on the economy.
But as I’ve been arguing over the past year, the Fed is far less relevant today than it would be during economic crises that demand sudden and significant changes to policy to address problems like surging inflation, plummeting economic activity, and shortages of market liquidity.
The economy, while cooling, continues to grow. And inflation, while slightly above the Fed’s target, is anything but a crisis.
In the wake of arguably hawkish monetary policy news in December, there’s some concern out there that fewer-than-expected rate cuts from the Fed is bearish for stocks.
But for stock market investors, this narrow focus on rate cuts is misguided. How many times the Fed cuts rates is not the right question.
Rather, what matters are the developments in the economy that are causing the Fed to adjust its outlook for monetary policy.
In its most recent Summary of Economic Projections released in December, the central bank raised its estimates for GDP growth in 2024 and 2025 while lowering its estimates for the unemployment rate in each of those years. Those projections also came with an upward revision to inflation forecasts and a downward revision to rate cut forecasts.
Maybe the better-than-expected economy is the reason why inflation is slightly above target and rate cut expectations continue to be rolled back. Is that a terrible combination of factors?
The stock market doesn’t seem to think so.
Despite a little volatility in recent months, the stock market has been holding up well with the S&P 500 mostly trending higher.
This comes despite what’s arguably been an increasingly hawkish outlook for monetary policy.
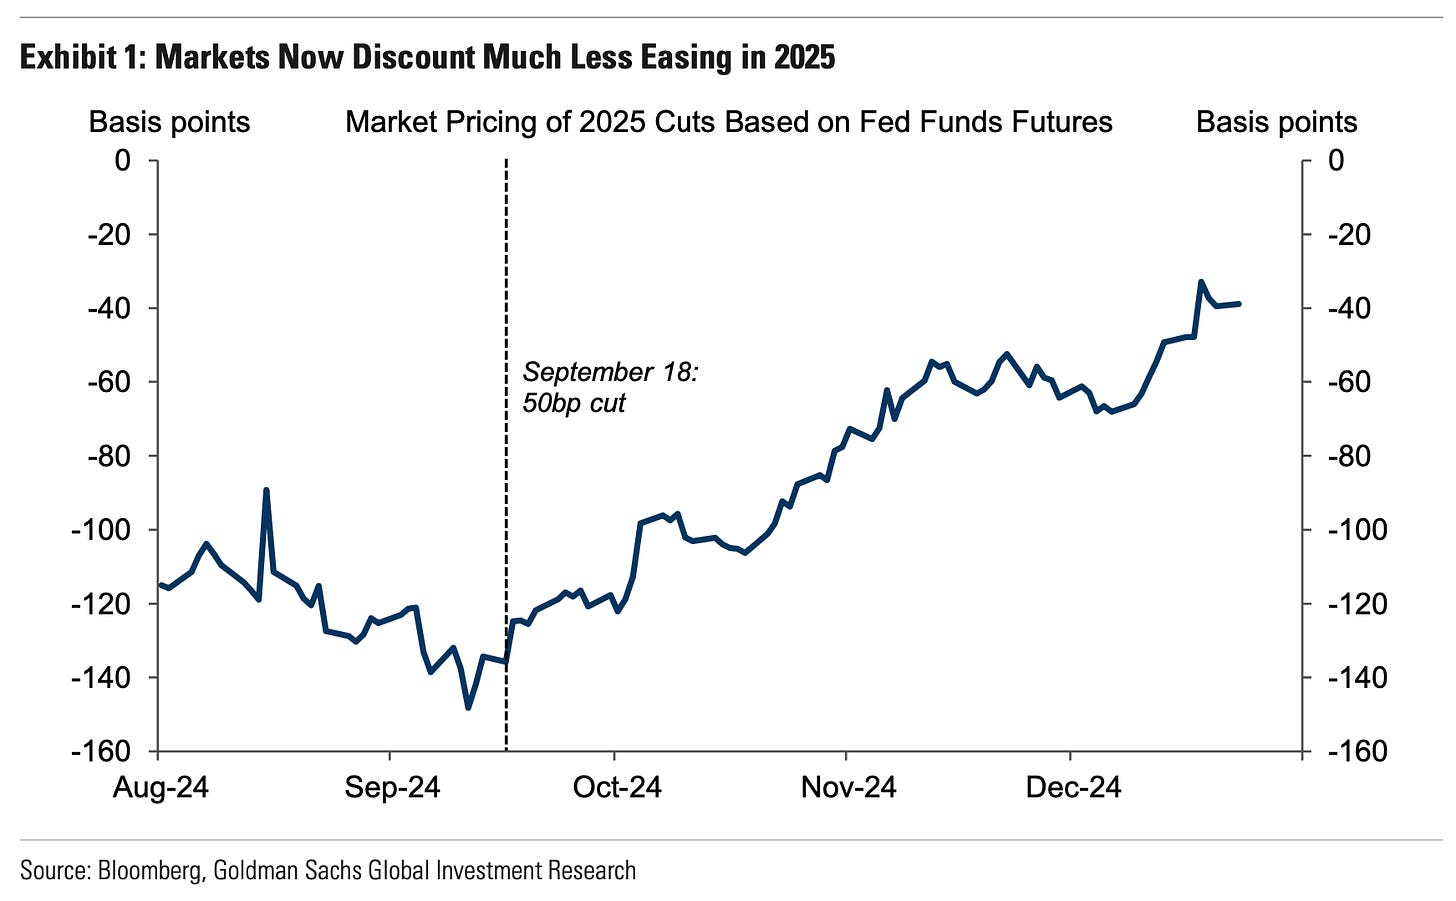
“Financial markets have sharply reduced their expectations for US monetary policy easing,” Goldman Sachs’ Jan Hatzius observed in a Dec. 23 note to clients. “Fed funds futures now imply 2025 rate cuts totaling less than 40bp, down from 125bp right after the 50bp cut in September.”
A popular view is that rate cuts would be bullish for risk assets like stocks. So any developments that lower the odds of a rate cut in the near term would therefore be bearish. All other things being equal, this view makes sense.
But the world is complicated, and all other things are never equal.
The Fed’s decisions on monetary policy — as well as the market’s expectations for those decisions — do not occur in a vacuum. They occur in the context of everything happening in the economy.
The economy has been exceeding expectations. And better-than-expected economic results help explain better-than-expected earnings growth, and earnings are the most important driver of stock prices. These indicators are not bearish.
For more on earnings and the Fed, read:There’s a more important force than the Fed driving the stock market 💪
We had a very similar discussion a year ago in the Jan. 28 TKer: “Whether or not the Fed cuts rates is not the right question 🔪“
At the end of 2023, the markets were convinced the Fed would make its first rate cut of the cycle in March 2024. However, those odds tumbled as the economic data rolling in far exceeded expectations.
Here’s what I said to Investopedia’s Caleb Silver at the time:
… As far as whether or not they actually pivot and begin to cut or hold or whatever, I think that’s really not the right question. The question [should] be, “If they don’t cut, then why are they not cutting as they suggested in their dot plots?” Right? Is it possible that the economy heats up more than they initially modeled? Yeah, maybe that’s a good reason to not cut because they’re concerned that inflation is going to be bubbling up again.
From an investor perspective and from an economic perspective, that’s not exactly the worst thing in the world that the economy isn’t falling apart. Because remember, a lot of these assumptions when it comes to the Fed pivot, in addition to inflation cooling, are also tied to the idea that the economy is also cooling — that growth is slowing and decelerating and that a lot of people have recessions on their mind. So maybe the Fed doesn’t pivot because the economy’s picking up. That’s really not that big a deal.
As we now know, that initial rate cut got pushed back all the way to September.
Importantly, the stock market continued to trend higher during this period.
As much as everyone wants to avoid economic crises, history suggests they’re unavoidable. So there may eventually come a time when Fed policy decisions have a more significant impact on the outlook for markets.
But for now, monetary policy is just one of many things that can move markets.
“For U.S. equity returns, policy moves take a backseat to the scarcity or abundance of corporate profits,” BofA’s Savita Subramanian said in September.
This speaks to TKer Stock Market Truth No. 5: “News about the economy or policy moves markets to the degree they are expected to impact earnings. Earnings (a.k.a. profits) are why you invest in companies.“
And currently, the outlook for earnings growth remains favorable.
–
Related from TKer:
There were several notable data points and macroeconomic developments since our last review:
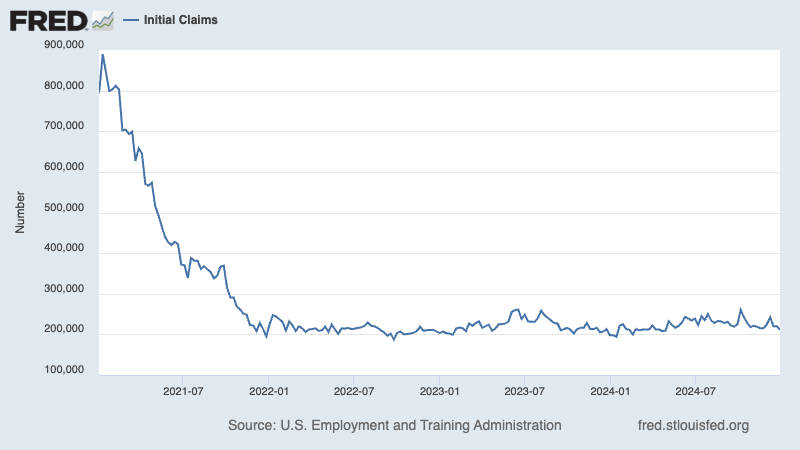
💼 Unemployment claims fall. Initial claims for unemployment benefits fell to 211,000 during the week ending December 28, down from 222,000 the week prior. This metric continues to be at levels historically associated with economic growth.
For more on the labor market, read:The labor market is cooling 💼
👎 Consumer vibes deteriorate. The Conference Board’s Consumer Confidence Index ticked lower in December. From the firm’s Dana Peterson: “While weaker consumer assessments of the present situation and expectations contributed to the decline, the expectations component saw the sharpest drop. Consumer views of current labor market conditions continued to improve, consistent with recent jobs and unemployment data, but their assessment of business conditions weakened. Compared to last month, consumers in December were substantially less optimistic about future business conditions and incomes. Moreover, pessimism about future employment prospects returned after cautious optimism prevailed in October and November.”
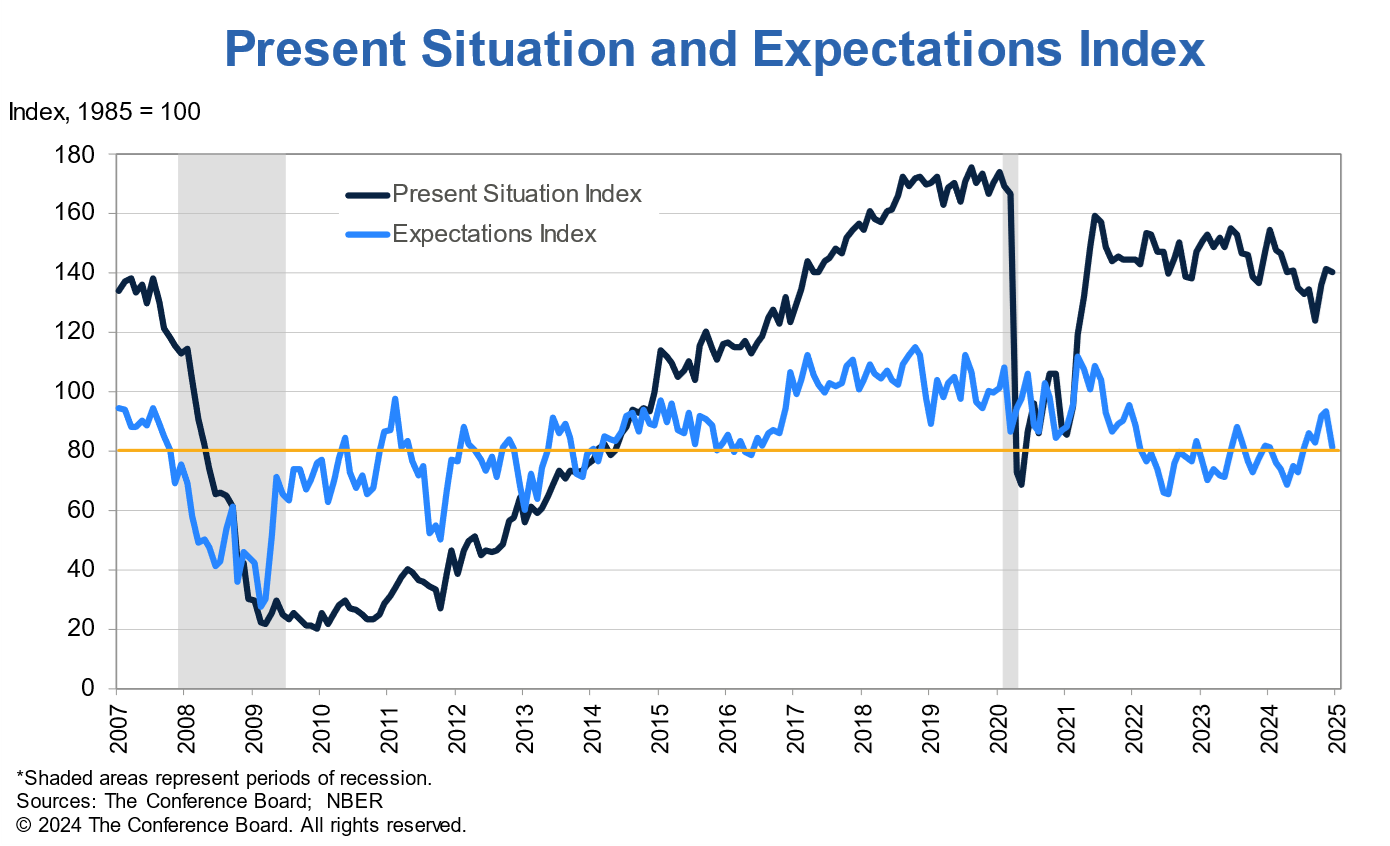
Relatively weak consumer sentiment readings appear to contradict resilient consumer spending data. For more on this contradiction, read:What consumers do > what consumers say 🙊 and We’re taking that vacation whether we like it or not 🛫
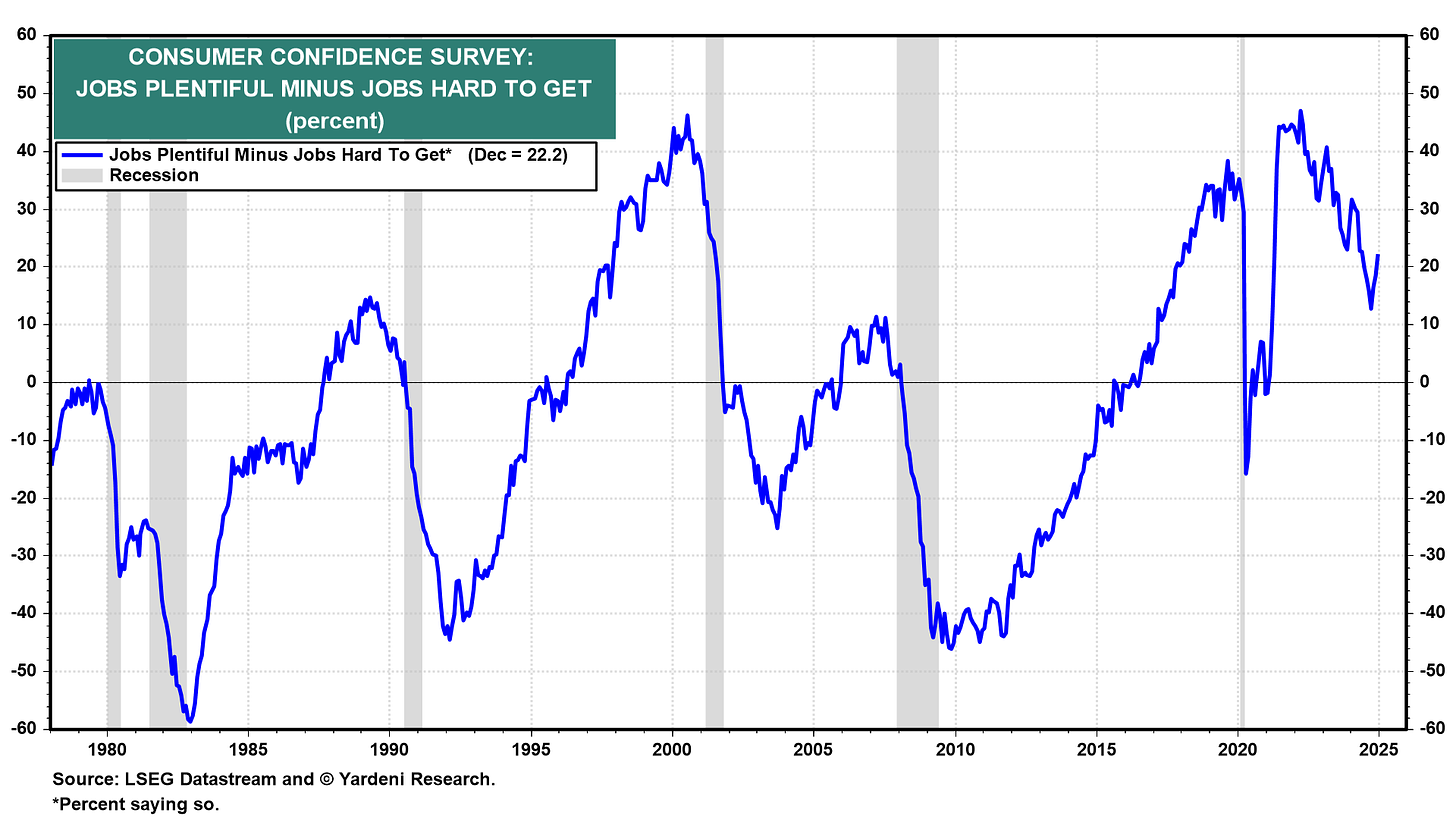
👍 Consumers feel better about the labor market. From The Conference Board’s December Consumer Confidence survey: “Consumers’ appraisals of the labor market improved in December. 37.0% of consumers said jobs were ‘plentiful,’ up from 33.6% in November. 14.8% of consumers said jobs were ‘hard to get,’ down from 15.2%.”
Many economists monitor the spread between these two percentages (a.k.a., the labor market differential), and it’s been reflecting a cooling labor market.
For more on the labor market, read:The labor market is cooling 💼
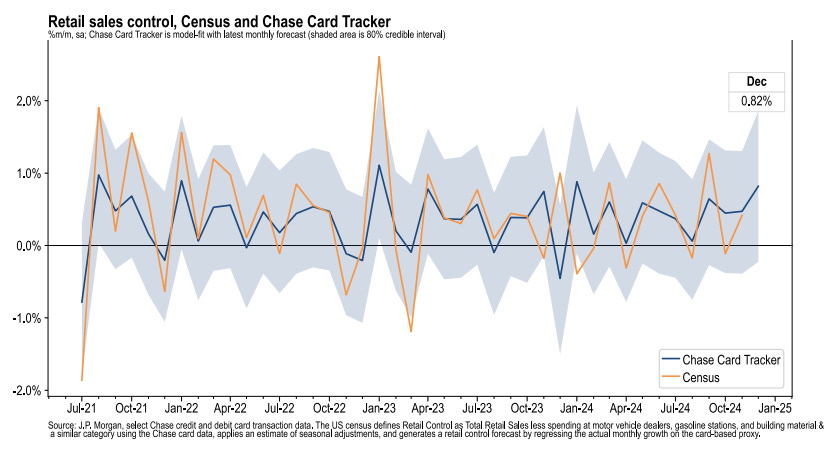
💳 Card spending data is holding up. From JPMorgan: “As of 21 Dec 2024, our Chase Consumer Card spending data (unadjusted) was 2.1% above the same day last year. Based on the Chase Consumer Card data through 21 Dec 2024, our estimate of the US Census December control measure of retail sales m/m is 0.82%.”
For more on the consumer, read: Americans have money, and they plan to spend it during the holidays 🎁
🏠 Mortgage rates tick higher. According to Freddie Mac, the average 30-year fixed-rate mortgage rose to 6.91%, up from 6.85% last week. From Freddie Mac: “Inching up to just shy of seven percent, mortgage rates reached their highest point in nearly six months. Compared to this time last year, rates are elevated and the market’s affordability headwinds persist. However, buyers appear to be more inclined to get off the sidelines as pending home sales rise.”
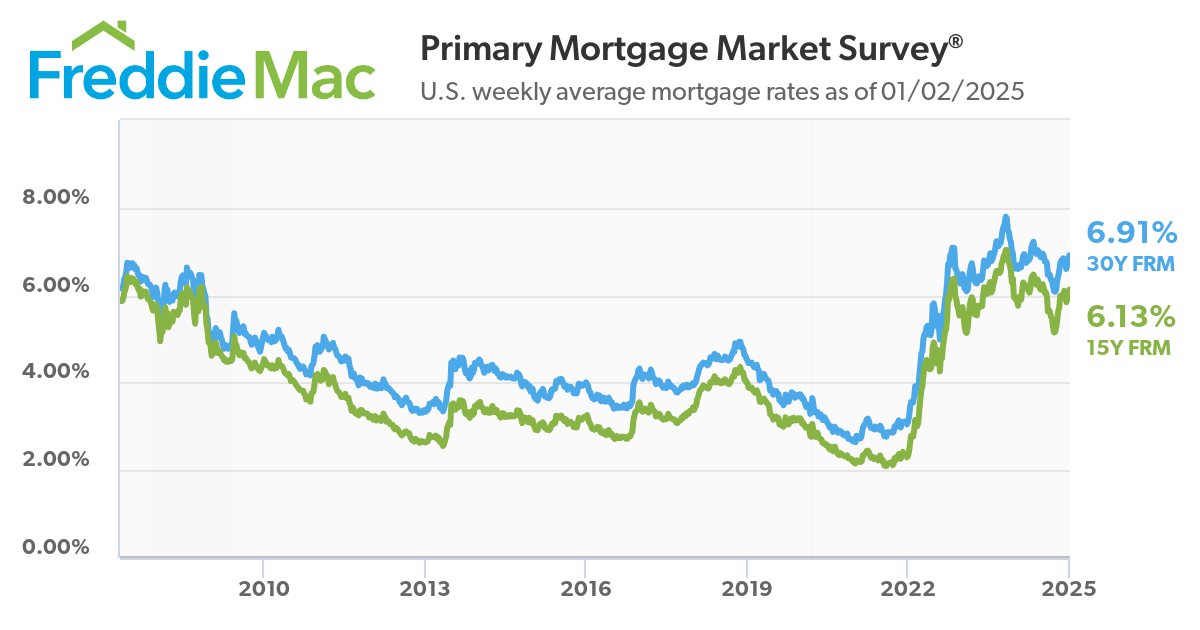
There are 147 million housing units in the U.S., of which 86.6 million are owner-occupied and 34 million (or 40%) of which are mortgage-free. Of those carrying mortgage debt, almost all have fixed-rate mortgages, and most of those mortgages have rates that were locked in before rates surged from 2021 lows. All of this is to say: Most homeowners are not particularly sensitive to movements in home prices or mortgage rates.
For more on mortgages and home prices, read:Why home prices and rents are creating all sorts of confusion about inflation 😖
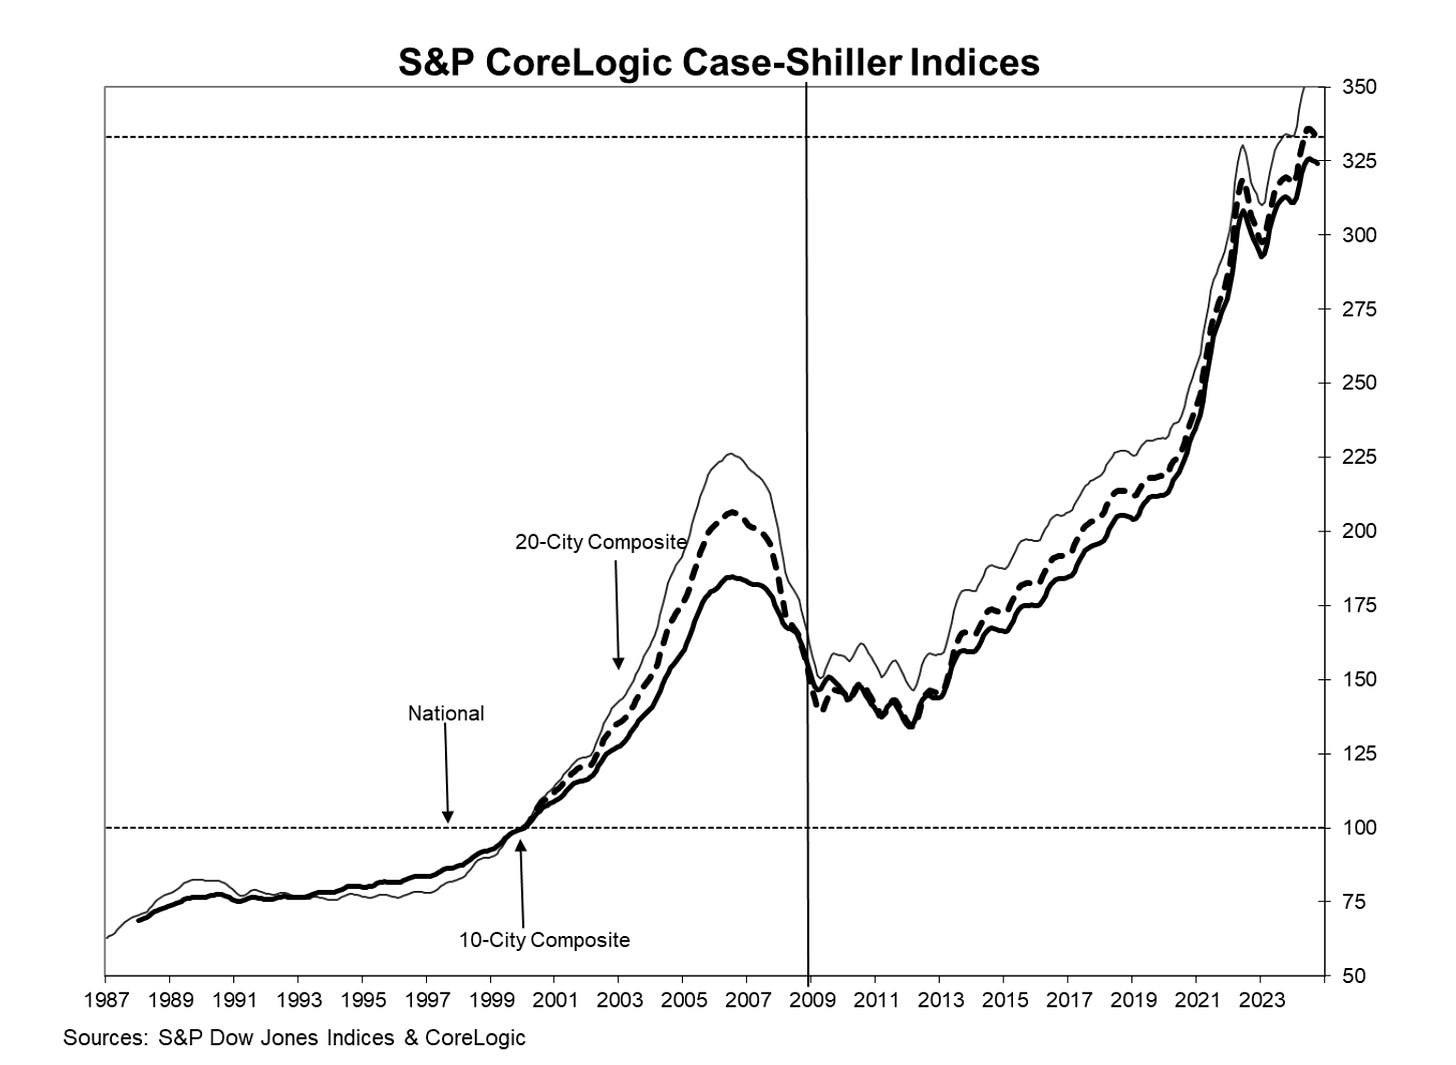
🏠 Home prices rise. According to the S&P CoreLogic Case-Shiller index, home prices rose 0.3% month-over-month in October. From S&P Dow Jones Indices’ Brian Luke: “Our National Index hit its 17th consecutive all-time high, and only two markets – Tampa and Cleveland – fell during the past month. The annual returns continue to post positive inflation-adjusted returns but are falling well short of the annualized gains experienced this decade. Markets in Florida and Arizona are rising, but not keeping up with inflation, and are well off the over 10% gains annually from 2020 to present. This has allowed other markets to catch up.”
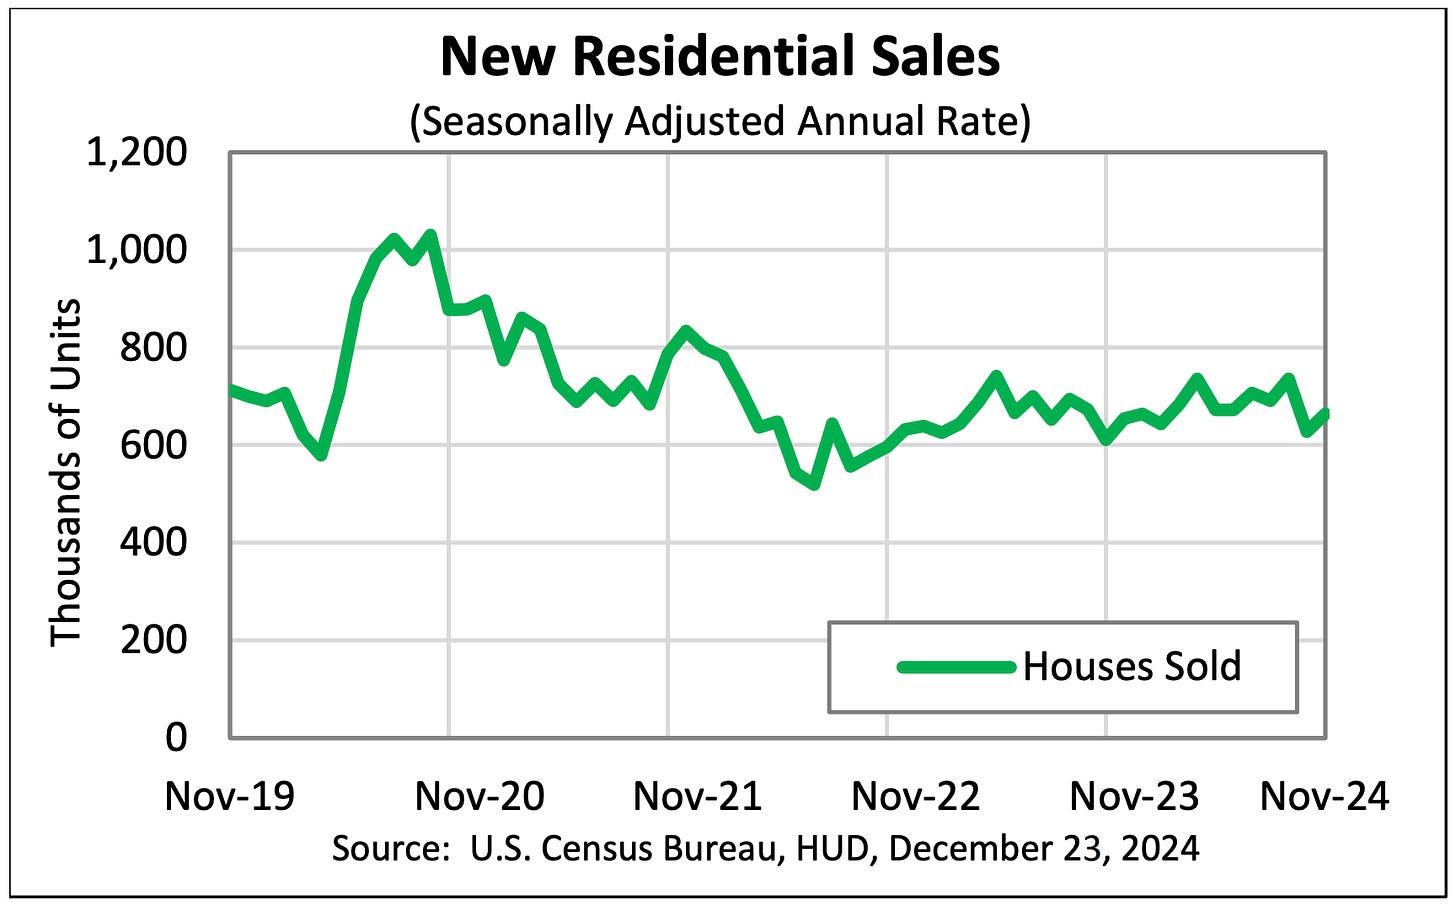
🏘️ New home sales rise. Sales of newly built homes jumped 5.9% in November to an annualized rate of 664,000 units.
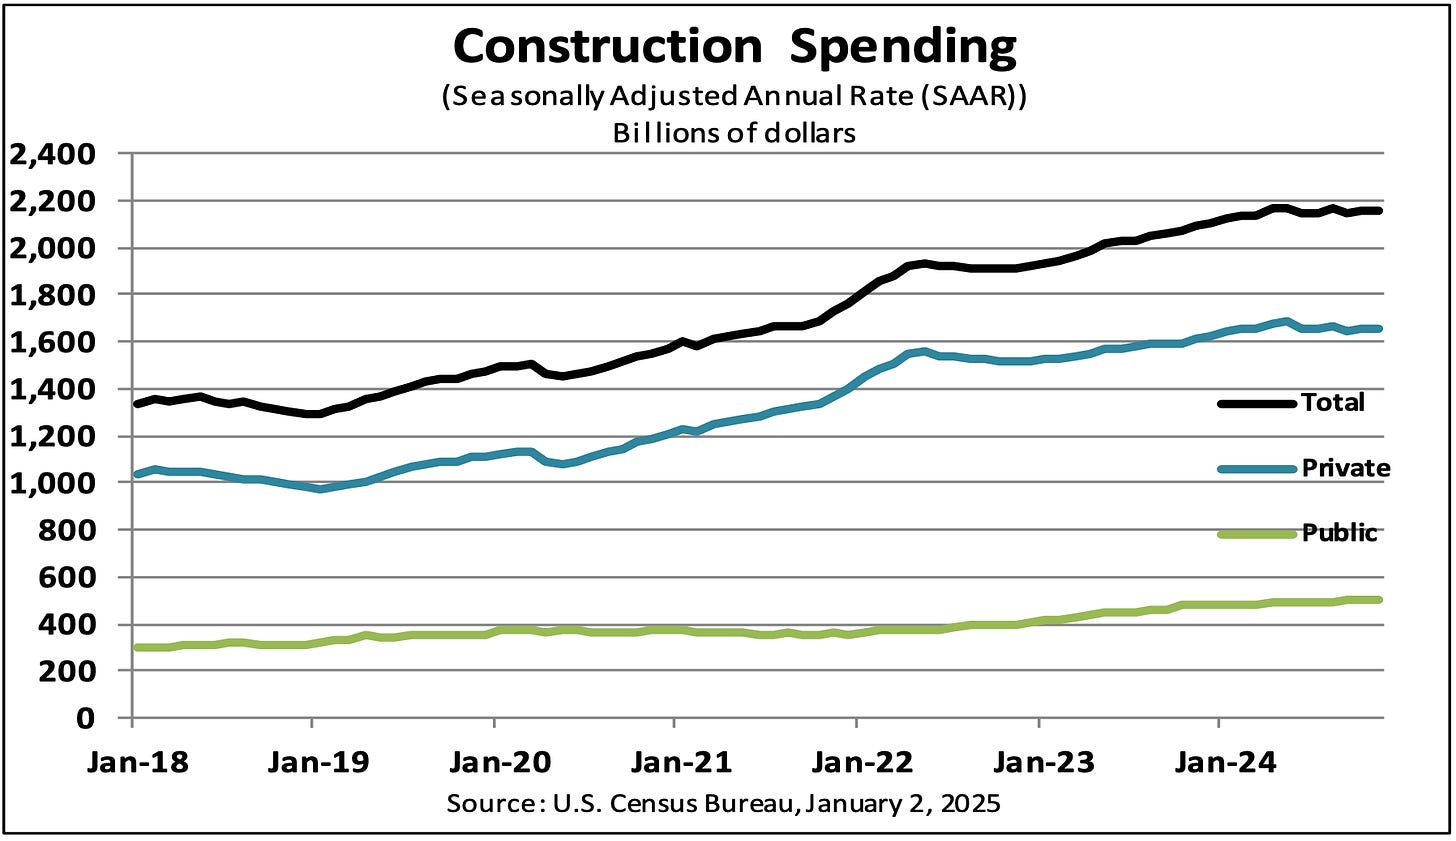
🔨 Construction spending ticks higher. Construction spending increased modestly to an annual rate of $2.15 trillion in November.
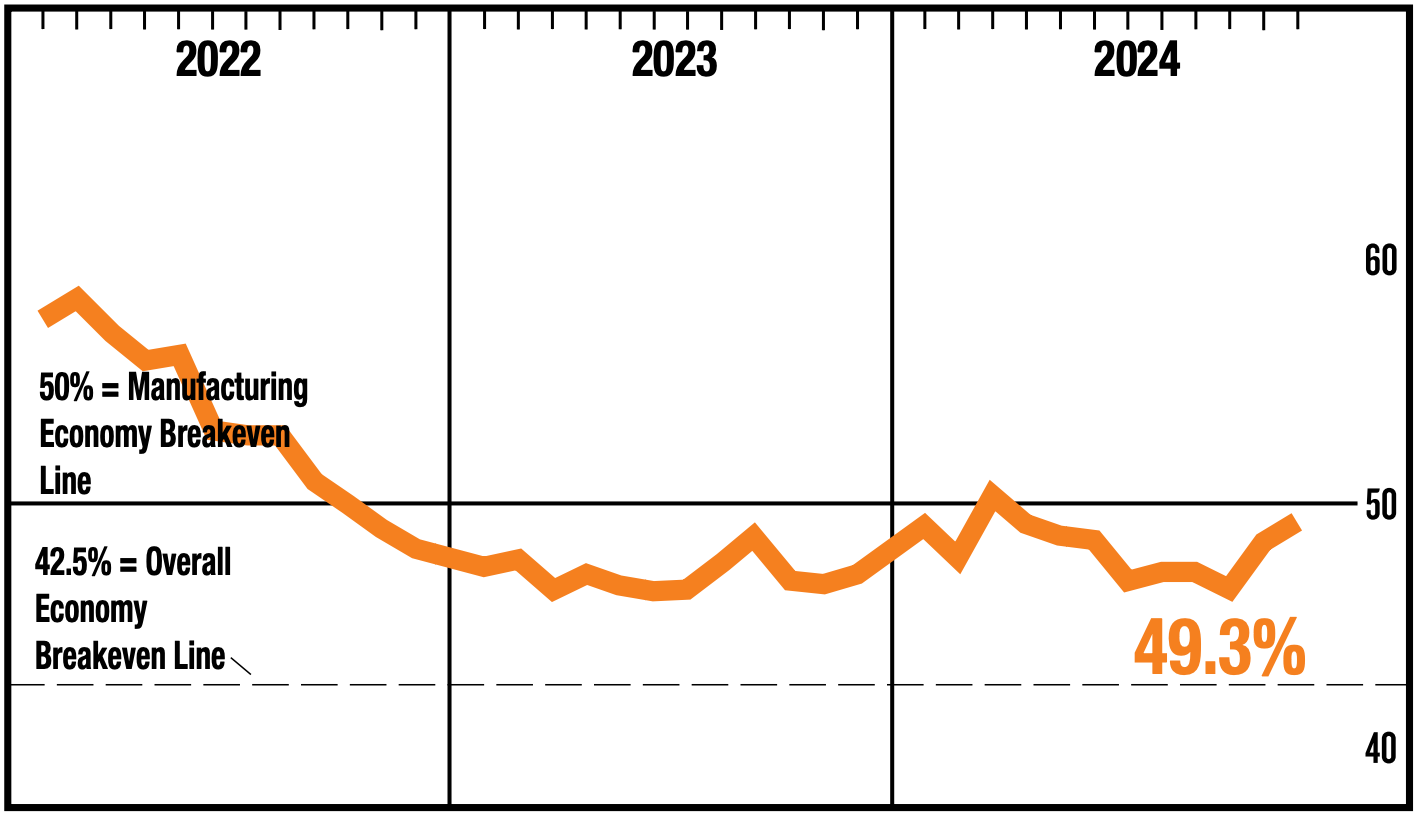
👎 Manufacturing surveys could be better. From S&P Global’s December U.S. Manufacturing PMI: “US factories reported a tough end to 2024, and have scaled back their optimism for growth in the year ahead. Production was cut at an increased rate in December amid disappointing inflows of new orders. While November had seen a near-stabilization of order books as uncertainty surrounding the election passed, reviving customer demand, this respite has proved temporary. Factories are reporting an environment of subdued sales and inquiries, notably in terms of exports. Many firms are generally anticipating that business will pick up in the New Year, with respondents pinning hopes on expectations that the new administration will loosen regulations, reduce tax burdens and boost demand for US-made goods via tariffs.”
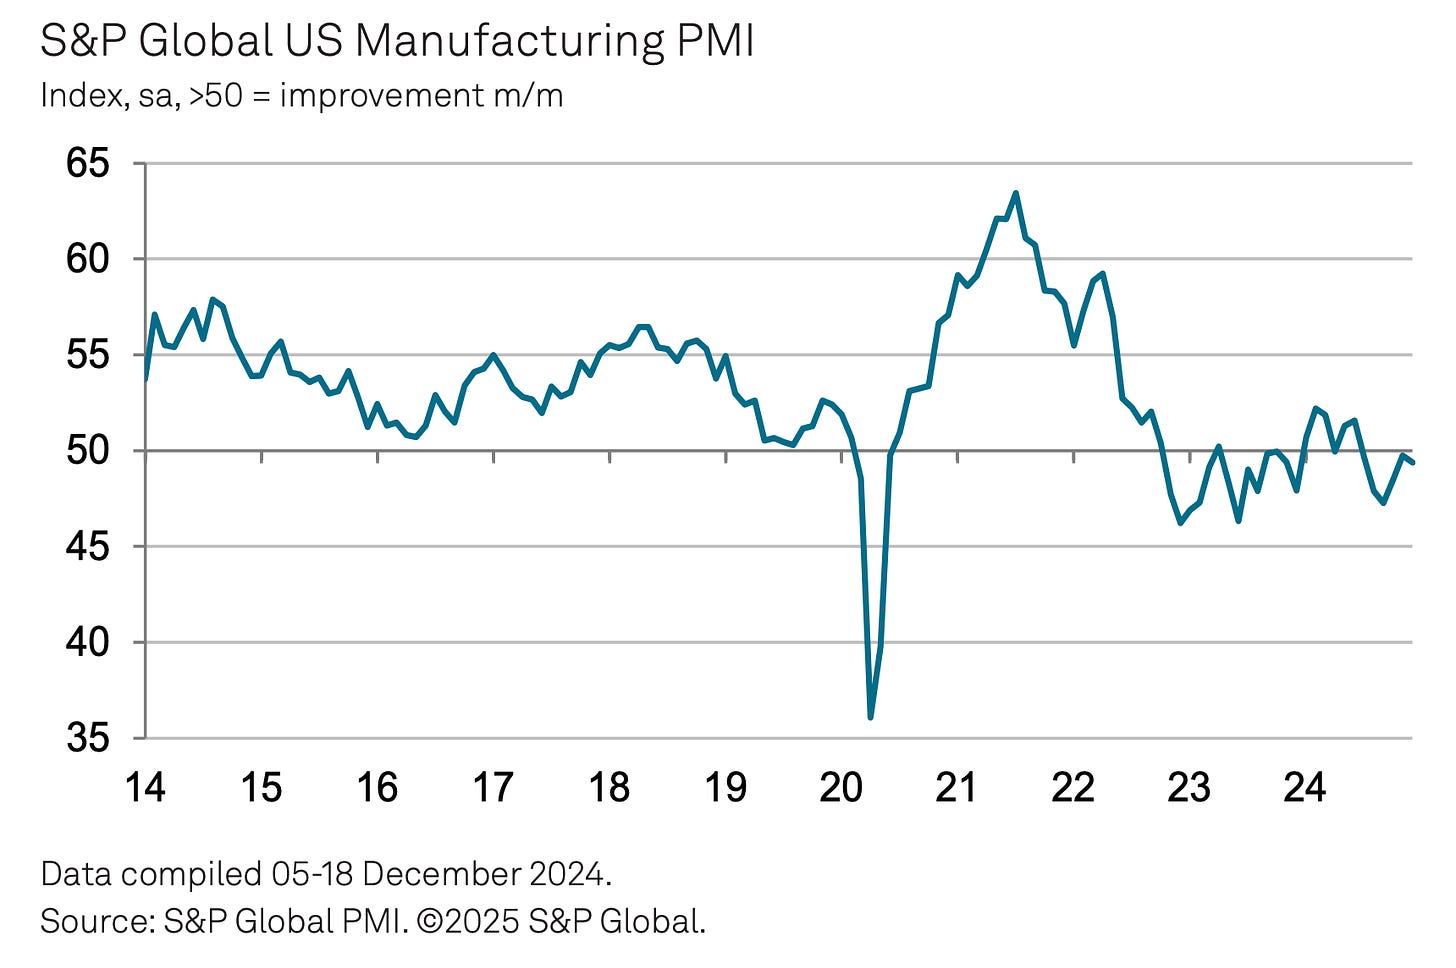
The ISM Manufacturing PMI improved in December but continued to signal contraction in the sector.
Keep in mind that during times of perceived stress, soft survey data tends to be more exaggerated than actual hard data.
For more on this, read:What businesses do > what businesses say 🙊
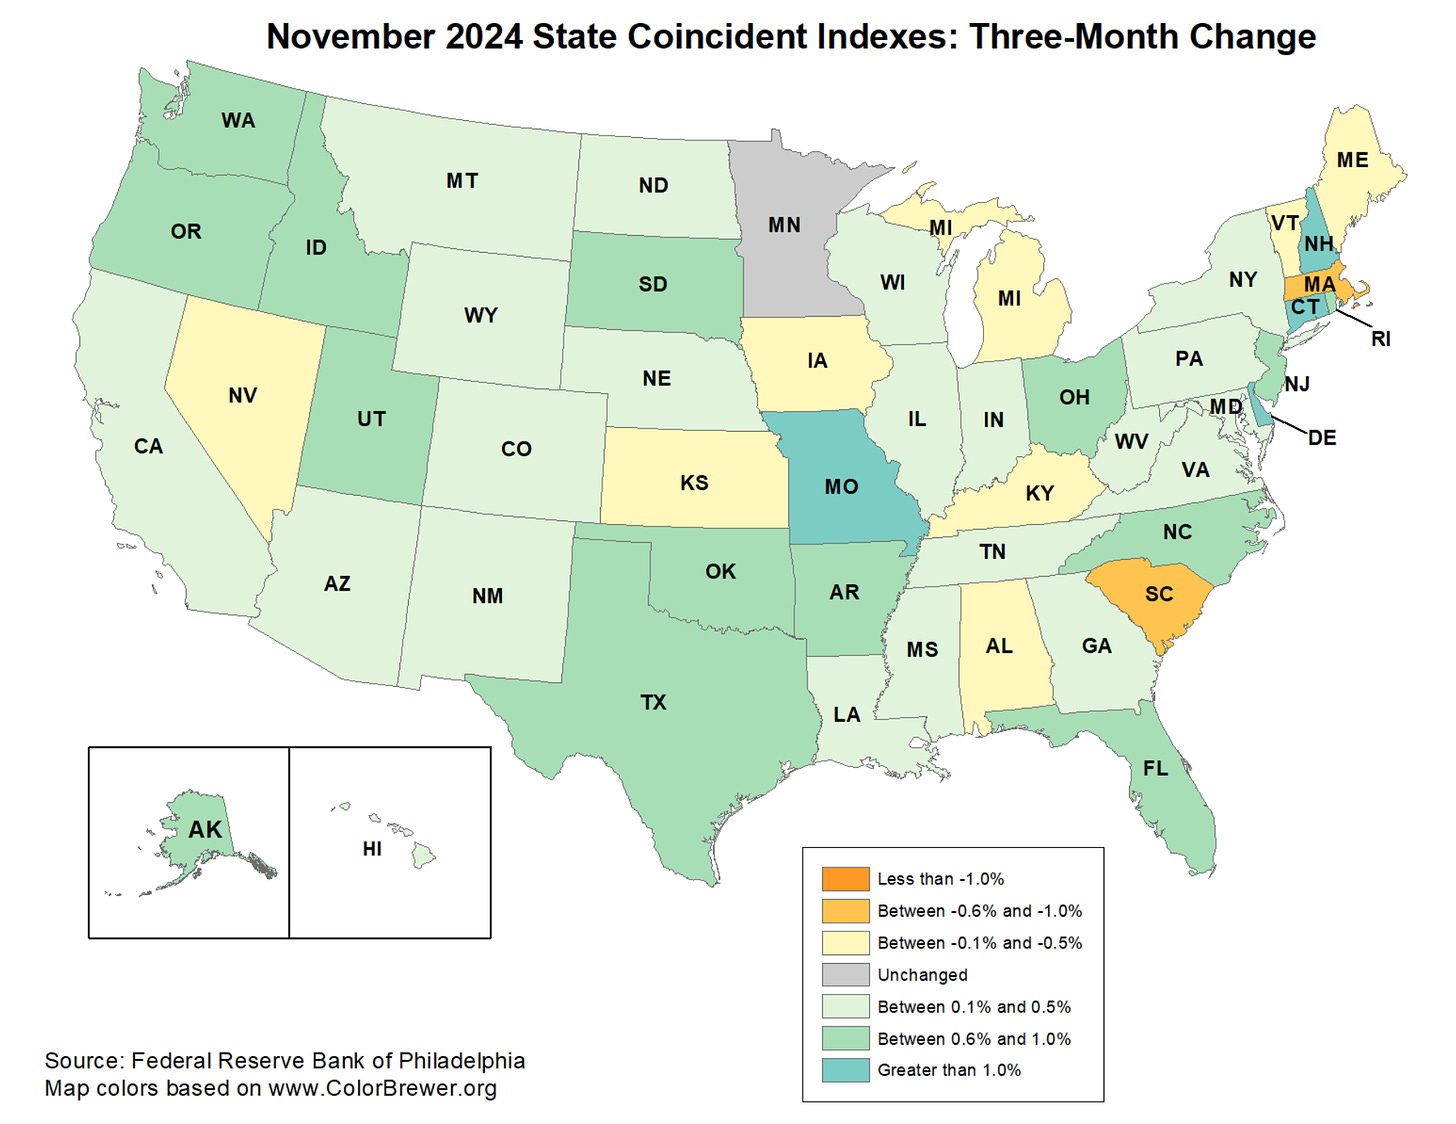
🇺🇸 Most U.S. states are still growing. From the Philly Fed’s November State Coincident Indexes report: “Over the past three months, the indexes increased in 39 states, decreased in 10 states, and remained stable in one, for a three-month diffusion index of 58. Additionally, in the past month, the indexes increased in 31 states, decreased in 15 states, and remained stable in four, for a one-month diffusion index of 32.”
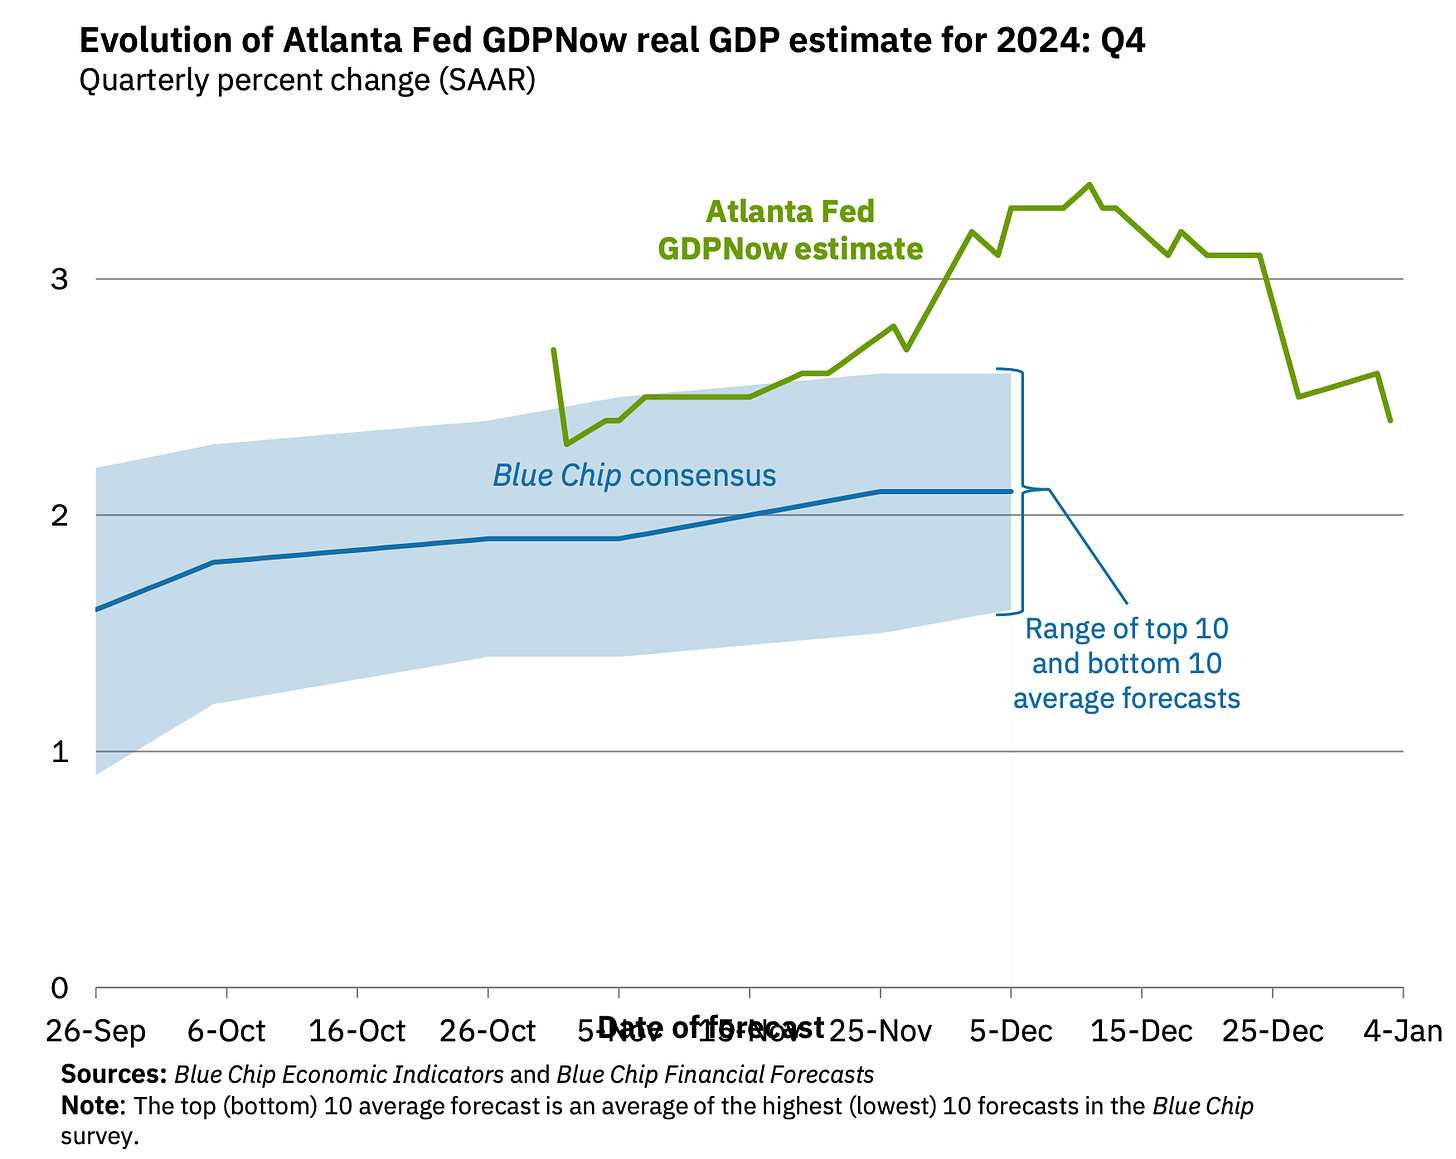
📈 Near-term GDP growth estimates remain positive. The Atlanta Fed’s GDPNow model sees real GDP growth climbing at a 2.4% rate in Q4.
For more on the economy, read:The US economy is now less ‘coiled’ 📈
The long-term outlook for the stock market remains favorable, bolstered by expectations for years of earnings growth. And earnings are the most important driver of stock prices.
Demand for goods and services is positive, and the economy continues to grow. At the same time, economic growth has normalized from much hotter levels earlier in the cycle. The economy is less “coiled” these days as major tailwinds like excess job openings have faded.
To be clear: The economy remains very healthy, supported by strong consumer and business balance sheets. Job creation remains positive. And the Federal Reserve — having resolved the inflation crisis — has shifted its focus toward supporting the labor market.
We are in an odd period given that the hard economic data has decoupled from the soft sentiment-oriented data. Consumer and business sentiment has been relatively poor, even as tangible consumer and business activity continue to grow and trend at record levels. From an investor’s perspective, what matters is that the hard economic data continues to hold up.
Analysts expect the U.S. stock market could outperform the U.S. economy, thanks largely due to positive operating leverage. Since the pandemic, companies have adjusted their cost structures aggressively. This has come with strategic layoffs and investment in new equipment, including hardware powered by AI. These moves are resulting in positive operating leverage, which means a modest amount of sales growth — in the cooling economy — is translating to robust earnings growth.
Of course, this does not mean we should get complacent. There will always be risks to worry about — such as U.S. political uncertainty, geopolitical turmoil, energy price volatility, cyber attacks, etc. There are also the dreaded unknowns. Any of these risks can flare up and spark short-term volatility in the markets.
There’s also the harsh reality that economic recessions and bear markets are developments that all long-term investors should expect to experience as they build wealth in the markets. Always keep your stock market seat belts fastened.
For now, there’s no reason to believe there’ll be a challenge that the economy and the markets won’t be able to overcome over time. The long game remains undefeated, and it’s a streak long-term investors can expect to continue.
For more on how the macro story is evolving, check out the the previous TKer macro crosscurrents »
Here’s a roundup of some of TKer’s most talked-about paid and free newsletters about the stock market. All of the headlines are hyperlinked to the archived pieces.
The stock market can be an intimidating place: It’s real money on the line, there’s an overwhelming amount of information, and people have lost fortunes in it very quickly. But it’s also a place where thoughtful investors have long accumulated a lot of wealth. The primary difference between those two outlooks is related to misconceptions about the stock market that can lead people to make poor investment decisions.
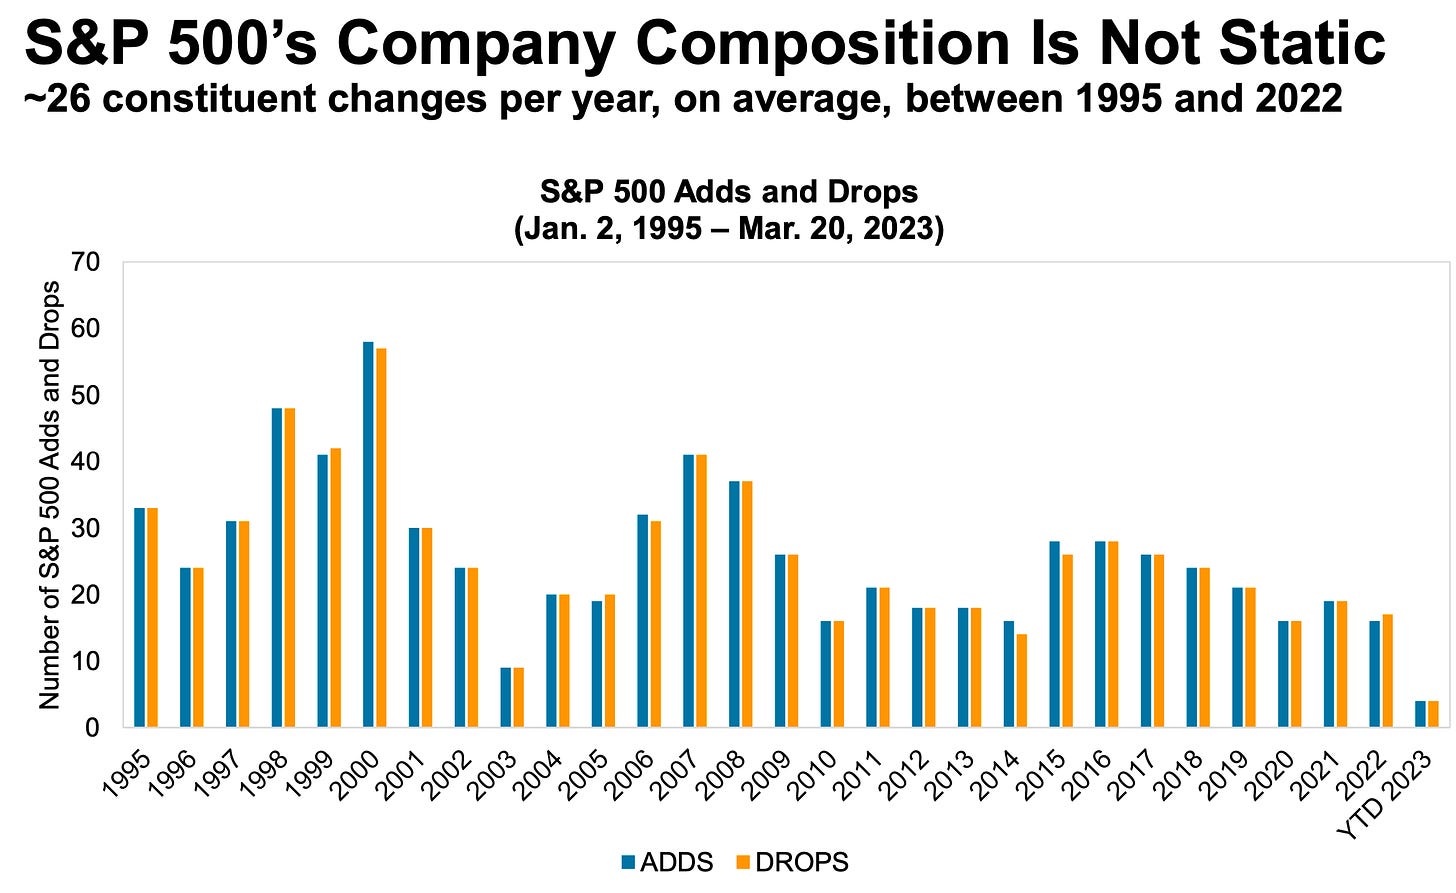
Passive investing is a concept usually associated with buying and holding a fund that tracks an index. And no passive investment strategy has attracted as much attention as buying an S&P 500 index fund. However, the S&P 500 — an index of 500 of the largest U.S. companies — is anything but a static set of 500 stocks.
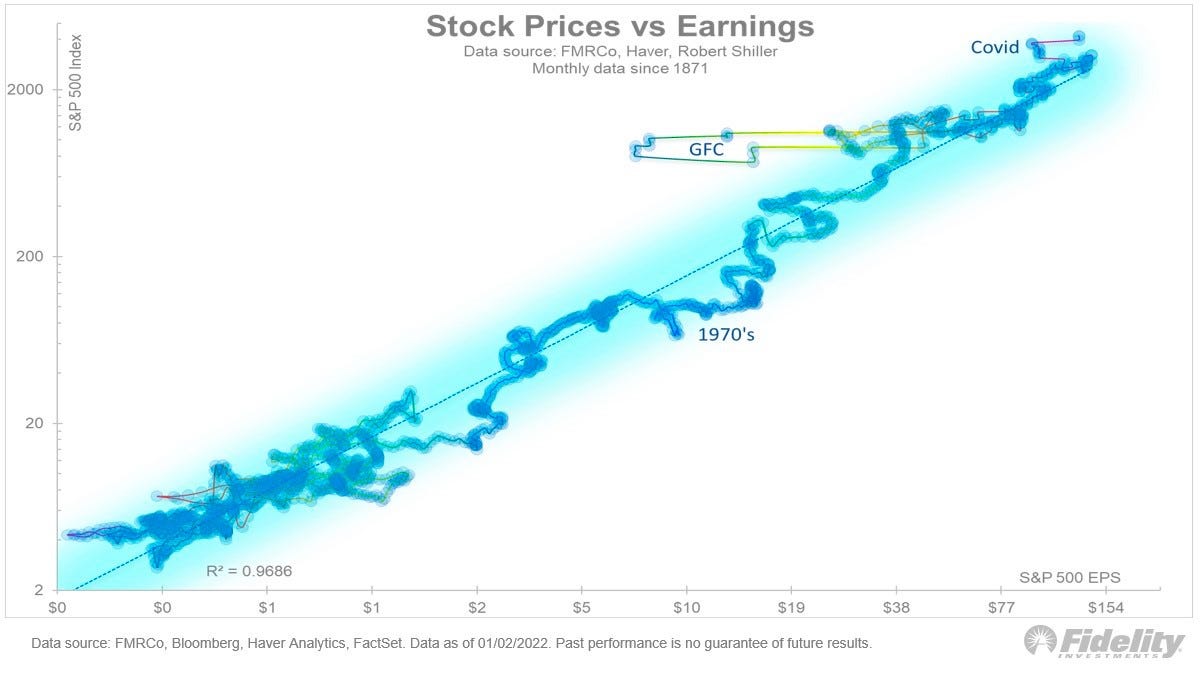
For investors, anything you can ever learn about a company matters only if it also tells you something about earnings. That’s because long-term moves in a stock can ultimately be explained by the underlying company’s earnings, expectations for earnings, and uncertainty about those expectations for earnings. Over time, the relationship between stock prices and earnings have a very tight statistical relationship.
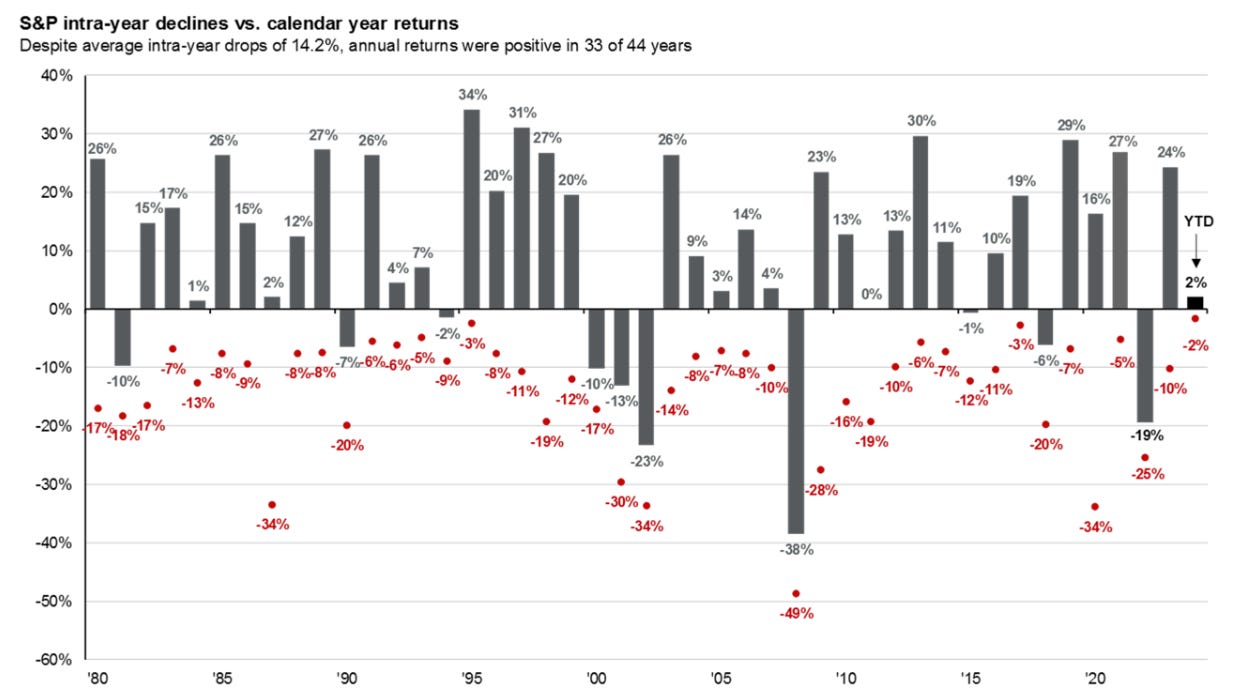
Investors should always be mentally prepared for some big sell-offs in the stock market. It’s part of the deal when you invest in an asset class that is sensitive to the constant flow of good and bad news. Since 1950, the S&P 500 has seen an average annual max drawdown (i.e., the biggest intra-year sell-off) of 14%.
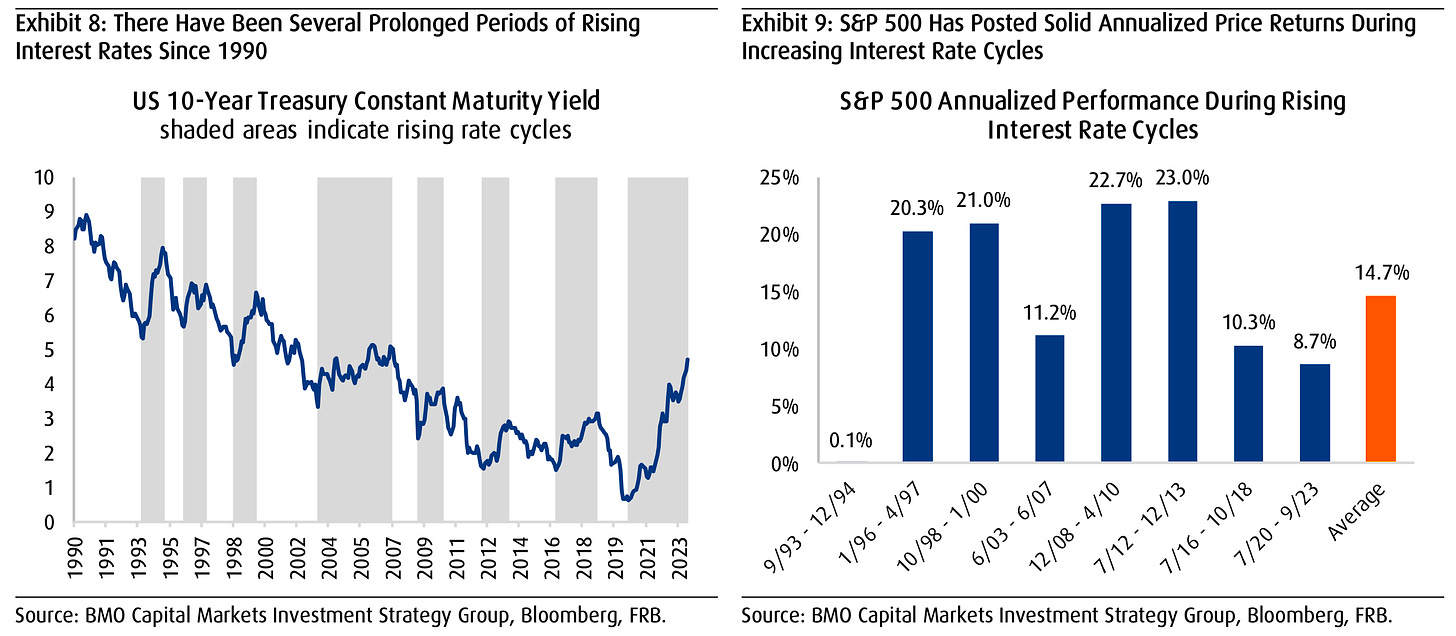
Generally speaking, rising interest rates are not welcome news for the economy and the stock market. They represent higher financing costs for businesses and consumers. All other things being equal, rising rates represent a hindrance to growth. However, the world is complicated, and this narrative comes with a lot of nuance. One big counterintuitive piece to this narrative is that historically, stocks have actually performed well during periods of rising interest rates.
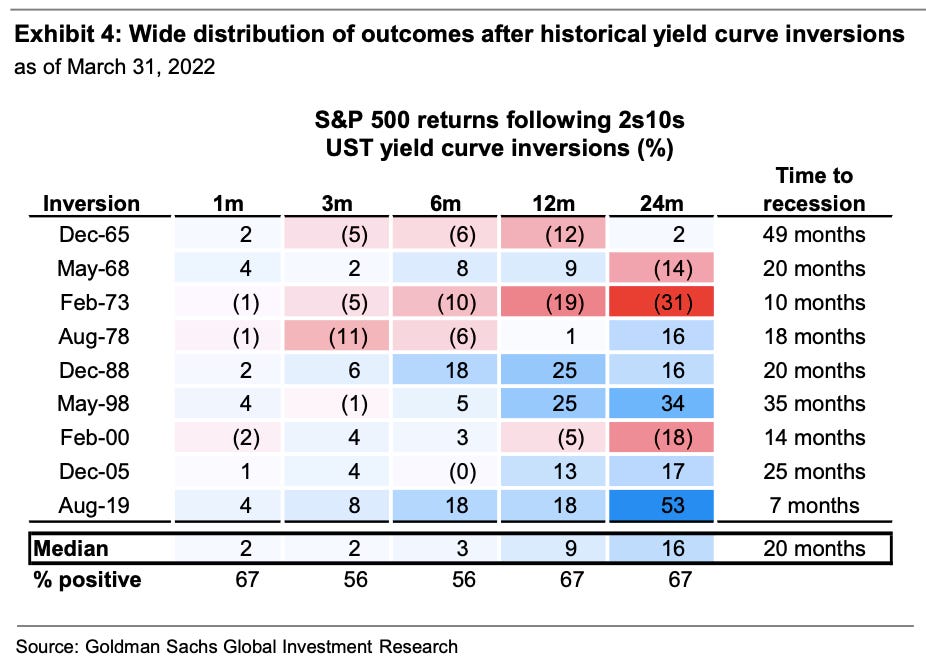
There’ve been lots of talk about the “yield curve inversion,” with media outlets playing up that this bond market phenomenon may be signaling a recession. Admittedly, yield curve inversions have a pretty good track record of being followed by recessions, and recessions usually come with significant market sell-offs. But experts also caution against concluding that inverted yield curves are bulletproof leading indicators.
Every recession in history was different. And the range of stock performance around them varied greatly. There are two things worth noting. First, recessions have always been accompanied by a significant drawdown in stock prices. Second, the stock market bottomed and inflected upward long before recessions ended.

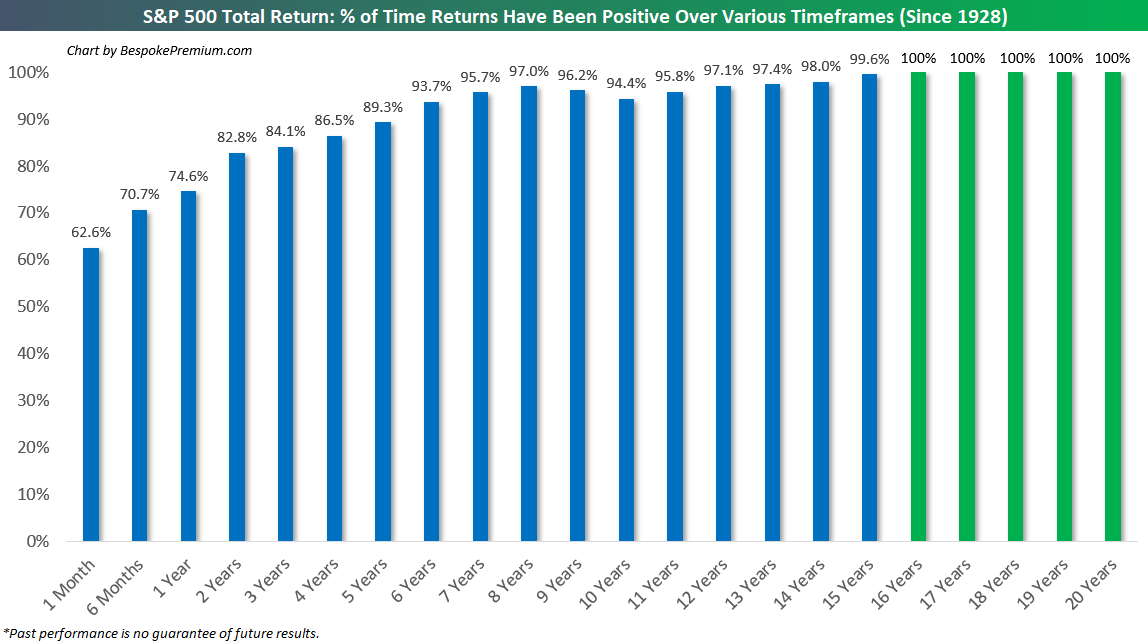
Since 1928, the S&P 500 generated a positive total return more than 89% of the time over all five-year periods. Those are pretty good odds. When you extend the timeframe to 20 years, you’ll see that there’s never been a period where the S&P 500 didn’t generate a positive return.
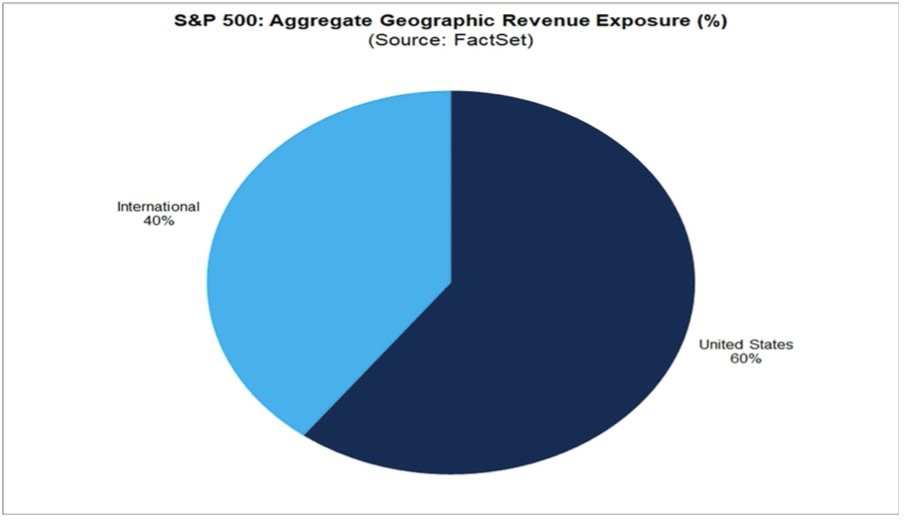
While a strong dollar may be great news for Americans vacationing abroad and U.S. businesses importing goods from overseas, it’s a headwind for multinational U.S.-based corporations doing business in non-U.S. markets.
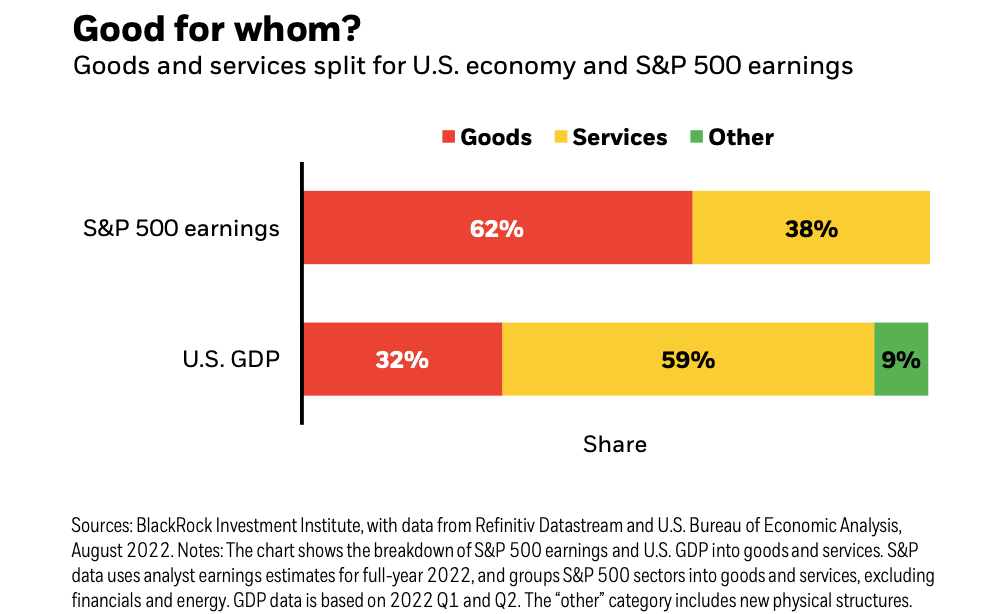
The stock market sorta reflects the economy. But also, not really. The S&P 500 is more about the manufacture and sale of goods. U.S. GDP is more about providing services.
…you don’t want to buy them when earnings are great, because what are they doing when their earnings are great? They go out and expand capacity. Three or four years later, there’s overcapacity and they’re losing money. What about when they’re losing money? Well, then they’ve stopped building capacity. So three or four years later, capacity will have shrunk and their profit margins will be way up. So, you always have to sort of imagine the world the way it’s going to be in 18 to 24 months as opposed to now. If you buy it now, you’re buying into every single fad every single moment. Whereas if you envision the future, you’re trying to imagine how that might be reflected differently in security prices.
Some event will come out of left field, and the market will go down, or the market will go up. Volatility will occur. Markets will continue to have these ups and downs. … Basic corporate profits have grown about 8% a year historically. So, corporate profits double about every nine years. The stock market ought to double about every nine years… The next 500 points, the next 600 points — I don’t know which way they’ll go… They’ll double again in eight or nine years after that. Because profits go up 8% a year, and stocks will follow. That’s all there is to it.
Long ago, Sir Isaac Newton gave us three laws of motion, which were the work of genius. But Sir Isaac’s talents didn’t extend to investing: He lost a bundle in the South Sea Bubble, explaining later, “I can calculate the movement of the stars, but not the madness of men.” If he had not been traumatized by this loss, Sir Isaac might well have gone on to discover the Fourth Law of Motion: For investors as a whole, returns decrease as motion increases.
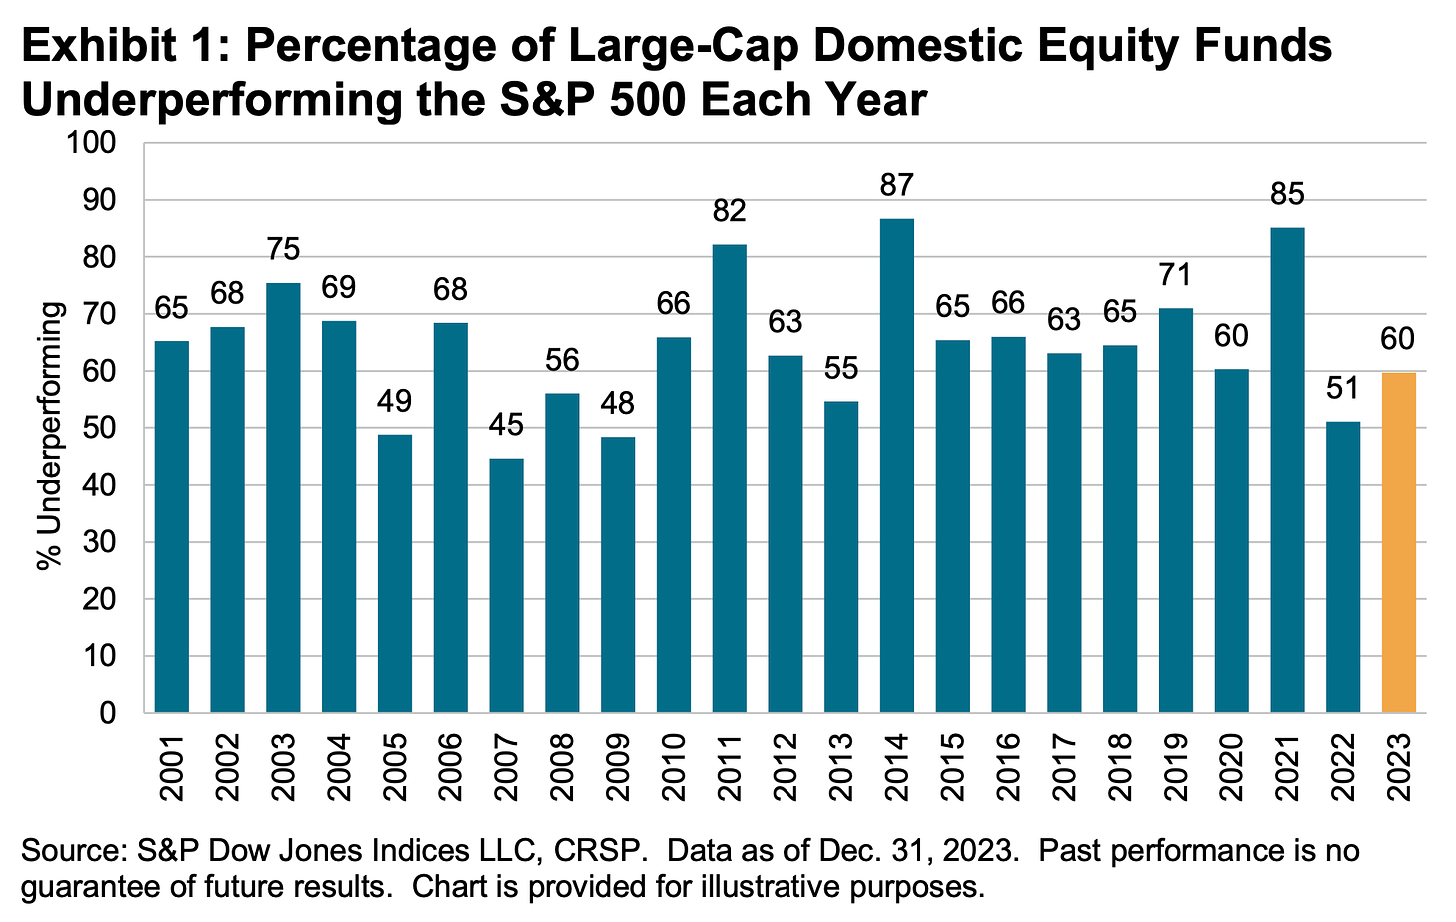
According to S&P Dow Jones Indices (SPDJI), 59.7% of U.S. large-cap equity fund managers underperformed the S&P 500 in 2023. As you stretch the time horizon, the numbers get even more dismal. Over a three-year period, 79.8% underperformed. Over a 10-year period, 87.4% underperformed. And over a 20-year period, 93% underperformed. This 2023 performance follows 13 consecutive years in which the majority of fund managers in this category have lagged the index.
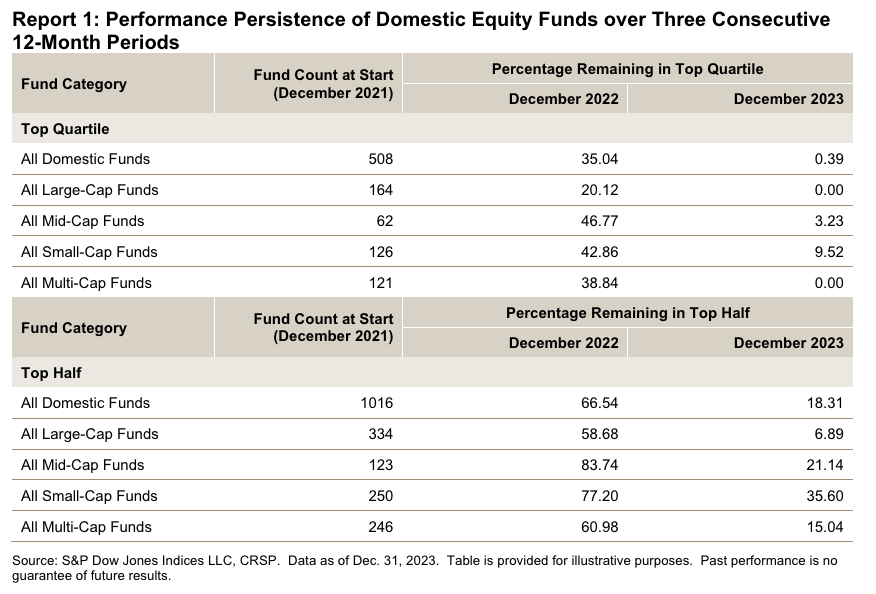
S&P Dow Jones Indices found that funds beat their benchmark in a given year are rarely able to continue outperforming in subsequent years. For example, 334 large-cap equity funds were in the top half of performance in 2021. Of those funds, 58.7% came in the top half again in 2022. But just 6.9% were able to extend that streak through 2023. If you set the bar even higher and consider those in the top quartile of performance, just 20.1% of 164 large-cap funds remained in the top quartile in 2022. No large-cap funds were able to stay in the top quartile for the three consecutive years ending in 2023.
Picking stocks in an attempt to beat market averages is an incredibly challenging and sometimes money-losing effort. In fact, most professional stock pickers aren’t able to do this on a consistent basis. One of the reasons for this is that most stocks don’t deliver above-average returns. According to S&P Dow Jones Indices, only 24% of the stocks in the S&P 500 outperformed the average stock’s return from 2000 to 2022. Over this period, the average return on an S&P 500 stock was 390%, while the median stock rose by just 93%.

Search
RECENT PRESS RELEASES
Related Post

