Genome-specific association study (GSAS) for exploration of variability in hemp (Cannabis sativa)
March 11, 2025
Abstract
Hemp (Cannabis sativa L.) is a versatile crop with substantial potential for creating productive, sustainable, and resilient agricultural systems. However, in contrast to other crops such as cereals, hemp is highly heterozygous, resulting in both challenges and opportunities for agriculture, breeding, and research. Here, we utilise the heterozygosity of hemp to explore the genetic basis of phenotypic variability in a population generated from a single self-pollinated hemp plant. The S1 population shows extensive variability in plant growth, development, and reproductive patterns. Using reduced representation sequencing, selection of alleles heterozygous in the parent plant, and a model originally developed for genome-wide association studies (GWAS), we were able to identify statistically significant single nucleotide variants (SNVs) and haplotypes associated with phenotypic traits of interest, such as flowering time or biomass yield. This new approach, which we term genome-specific association study (GSAS), enables the mapping of traits in a single generation without the need for a large number of diverse cultivars or samples. GSAS might be applicable to other highly heterozygous vegetable and fruit crops, informing the breeding of new cultivars with enhanced uniformity and improved performance in traits relevant to various applications.
Introduction
Hemp (Cannabis sativa L.) is a versatile crop with high economic potential1,2,3. However, due to its complicated legal status in relatively recent history4, uniformly performing cultivars have not been readily available, and the genetic basis of agriculturally important traits remains poorly understood.
The recent loosening of legislation has enabled studies to investigate various traits in hemp, revealing differences among cultivars. Some studies explored the effect of various fertigation rates on the essential oil content, growth, biomass, and cannabinoid profiles5,6, or the effect of nitrogen fertilisation and sowing density on weight, height, and cannabinoid yield7. Other studies focused on differences in the performance of cultivars under identical cultivation conditions. Morpho-anatomical differences of stems and mechanical fibre properties8, antinutritional components, oil and protein content of seeds9, or the mechanism of water stress response10 varied significantly among different studied cultivars. Differences among cultivars on the phenotypic level were found to be mirrored on the genomic level11,12,13,14. Extensive variability in yield, cannabinoid production, and other traits, such as disease resistance, was observed in studies investigating the effect of environmental15,16 and temporal17 interactions with genotype.
Studies exploring predominantly the intravarietal variability in hemp are similarly sparse and focused on the response variability of a single cultivar to different levels of nitrogen application and sowing densities measured through various agricultural parameters18,19.
Alongside the quantitative trait loci (QTL) mapping genome-wide association studies (GWAS) are utilised as one of the two primary methodologies for the identification of alleles associated with traits of interest. Since 2002, when the results of the first GWA study on humans were published20, this type of study has risen in popularity not only in human genetics but also in agricultural studies. The advances in sequencing technologies and the decreasing cost of sequencing made the GWAS approach of unbiased search for significant alleles associated with specific traits a success story in the case of crops such as rice21, spring wheat22, tomato23, or soybean24.
Hemp is a diploid species (2n = 20) with 18 autosomes and one pair of sex chromosomes, and its genome size has been determined through flow cytometry to be 1636 ± 7.2 Mbp and 1683 ± 13.9 Mbp for plants carrying XX and XY combinations of sex chromosomes, respectively25,26. The availability of its genomic information, combined with advancements in sequencing technologies, has facilitated the application of genome-wide association studies (GWAS) to investigate the genetic basis of various traits in hemp. Initial GWAS efforts utilised the panel of 123 accessions grown in three distinct European locations and phenotyped for various fibre quality-related parameters27. The same panel was used to investigate flowering time and sex determination in hemp28. A GWAS approach was also utilised to identify markers associated with nine morphological and yield-related traits in a panel of 176 drug-type C. sativa accessions exemplifying the Canadian legal market29, as well as multiple morphological, flowering, and cannabinoid content-related traits in 35 Iranian wild C. sativa populations30.
Both QTL mapping and GWAS each bear their own merits and limitations. QTL analysis requires inbred lines or populations like F2 or subsequent generations to link molecular markers to phenotype31. This method often yields large loci which include many genes. Conversely, GWAS investigates populations with individuals of varying levels of relatedness. It outputs specific alleles which can be located also in genes with minor effect. However, this approach often yields false positives. Several studies combine both approaches to harness their advantages32,33,34,35,36,37.
This study represents an extensive exploration of morphological and developmental intravarietal variability in hemp, utilising an S1 population originating from a single highly heterozygous mother plant. Through in-depth phenotypic analysis, we uncover extensive variability in agronomically important traits, including plant height, stem diameter, side branch lengths, biomass yield, inflorescence density, and flowering time. The design of this study assumes that the large phenotypic variability was derived from the heterozygous alleles of a parent plant, which segregated into the studied S1 population. This premise is then employed in a novel type of association analysis, termed genome-specific association study (GSAS). Initially, GSAS selects only alleles segregating in the 1:2:1 genotypic ratio before employing the BLINK model38. Studied alleles are positioned across the whole genome, and the term ‘specific’ in GSAS refers to a specific parent plant from which the studied S1 population originates. GSAS, as a tool, enables the utilisation of high heterozygosity in an individual and the resulting variability of phenotypic traits in the S1 offspring within a single generation.
GSAS offers a distinct advantage over traditional QTL mapping by directly investigating intravarietal variability within an S1 population. Unlike QTL mapping, which typically requires the generation of F2 or inbred populations from parents differing in the trait of interest, GSAS eliminates this step, thereby expediting the research process and reducing resource requirements. Furthermore, while GWAS typically utilises the varying relatedness among individuals within the studied population, GSAS leverages the inherent heterozygosity within the S1 population. By filtering for alleles segregating in a Mendelian ratio, GSAS effectively reduces the number of markers analysed while simultaneously increasing the confidence in identified associations. This targeted approach enhances the efficiency and precision of trait mapping within the S1 population.
Overall, the GSAS method simplifies the identification of variants and genes associated with specific traits and carries the potential to facilitate the breeding of new hemp cultivars that will be more uniform, allowing for optimization of harvesting and processing, and showing improved values in traits of interest for diverse applications.
Results
A monoecious hemp cultivar ‘Felina 32’ originating from France was selected for this study. This popular cultivar can be used for a wide range of applications, including seeds, fibre, or biomass production, phytoremediation, or for extraction of secondary metabolites, depending on the climate, growing conditions, and harvesting period selected. The variety of agronomically important phenotypic traits that can be studied in this cultivar makes it an ideal candidate for this study.
To explore the variability of a single hemp individual, an S1 population originating from a self-pollinated ‘Felina 32’ plant was cultivated during the summer of 2022 in a greenhouse in Dublin, Ireland. The S1 population consisted of 342 individuals phenotyped to a high level of detail.
We observed substantial variability and correlations among key agronomically important traits, including plant height, stem diameter, biomass yield, and flowering time. Using the GSAS approach, we identified significant single nucleotide variants (SNVs) and haplotypes associated with these traits.
The S1 population exhibited large variability in all recorded morphological traits
Stem height and diameter are important traits which need to be considered when optimising the harvesting and mechanical processing of hemp39,40,41. In the vegetative phase, differences in plant height within the S1 population kept increasing rapidly and plant height plateaued when plants switched to the reproductive phase around week 12 (Fig. 1a and b). At the end of the trial, plant height ranged from 26 to 303 cm with an average of 230.5 cm and a median of 244 cm (Fig. 1a, Supplementary Table S1).
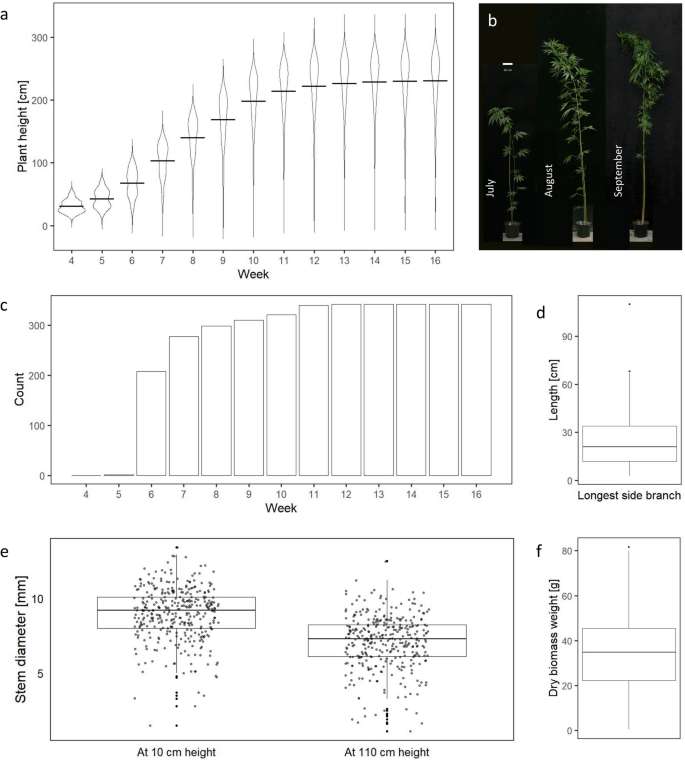
Variability in morphological and developmental traits within a hemp population derived from a self-pollinated individual. Violin plots depict the distribution of plant height measurements (in cm) on a weekly basis (a). Each violin represents the density of data points along the y-axis, with wider sections indicating higher density. The mean value for each distribution is indicated by a horizontal crossbar. Morphological and developmental changes of the same plant photographed in four-week intervals (b). Plants with at least one side branch were counted every week (c). The length (in cm) of the longest side branch among 342 samples at the end of the trial (d). The stem diameter measurements (in mm) of 342 plants were recorded at two distinct heights at the end of the trial, 10Â cm and 110Â cm above the soil level (e). Dry biomass weight (in g) among 342 individuals from the S1 population (f).
Stem diameter at the soil level is the best predictor of biomass yield42. Also, together with plant height, stem diameter is a good predictor of bast fibre quality and yield43,44. At the end of the trial, at 10 cm above the soil level, stem diameter ranged from 1.5 to 13.4 mm, with an average of 9.0 mm and a median of 9.2 mm (Fig. 1e, Supplementary Table S1). At 110 cm above the soil level, stem diameter ranged from 1.1 to 12.5 mm, with an average of 7.1 mm and a median of 7.3 mm (Fig. 1e, Supplementary Table S1). In most cases, the stem diameter was smaller at 110 cm height, but in 1.46% of plants, the recorded stem diameter at 110 cm was larger than at 10 cm above the soil level, and in 1.46% of plants it was identical at both measured heights.
Branching positively affects the biomass yield and negatively affects the length of bast fibres, and might interfere with the processing8. It is desired to have long bast fibres which are used to manufacture insulation, paper, textiles, ropes, bioplastics, and biocomposites45. The emergence of the first branch was recorded in two plants on week five after sowing. By week 12, all plants had at least one side branch (Fig. 1c). The length of the longest side branch on each plant at the end of the trial varied between 3 and 110 cm with an average of 24.8 cm and a median of 21 cm (Fig. 1d, Supplementary Table S1).
Another important agricultural trait is biomass yield. Hemp biomass has high carbon sequestration potential46,47 and can be used for many applications, ranging from the production of biofuels48,49 to secondary metabolites extraction50. In the S1 population, the dry biomass yield ranged astoundingly from less than 0.5 to 81.7 g per plant, with an average of 34.4 g and a median of 34.8 g (Fig. 1f, Supplementary Table S1).
Flowering time dynamics highlights the succession of male and female flower emergence
Unsynchronised flowering and ripening of hemp seeds is one of the main factors complicating the optimisation of production and processing in the hemp industry. Harvesting time affects the quality of fibre or seed yield27,45,51,52. ‘Felina 32’ is a dual-purpose monoecious variety harvested for both fibre and seed. Flowering time, measured as the number of days between sowing and flowering, was recorded separately for male and female flowers. The first male flowers were observed on week 8 and the female flowers on week 10. The last observed either male or female flowers were recorded on week 13. The majority of male flower emergence was observed on week 9 and of female flower on week 11 of the trial (Fig. 2a, Supplementary Table S1). On each plant, male flowers emerged before female flowers.
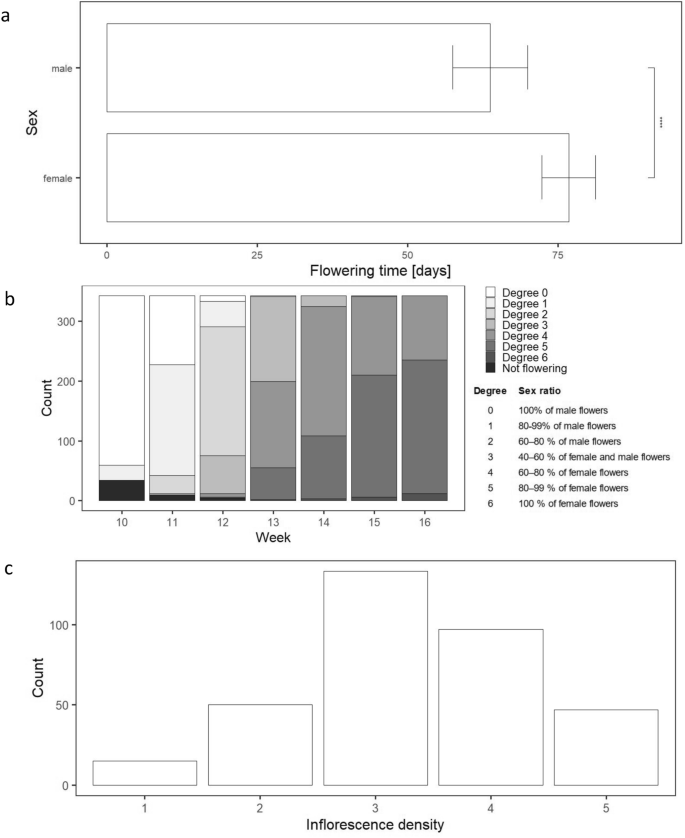
Variability in flowering time, sex ratio and inflorescence density within a hemp population derived from a self-pollinated individual. Boxplots summarise the distribution of flowering time as the number of days after sowing when the first male and female flowers were observed on each plant (a). Counts of plants displaying a specific sex ratio degrees on a weekly basis from week 10 when the first male flowers emerged on plants (b). The sex ratio degree scale was applied at the level of individual plants. The distribution of individuals categorised into inflorescence density groups at the time of harvest suggests a tendency towards a balanced distribution (c). The bars represent the number of individuals in each inflorescence density group, ranging from the lowest density (1) to the highest density (5).
To measure the sex ratio degree, a five-point scale originally developed by Segenbuch53 and modified to measure the monoecy degree per plot26 or per node of a hemp plant54 was used. On this scale, Degree 0 was assigned to plants having only male flowers and Degree 6 to plants having only female flowers. The temporal dynamics of reproductive development within the S1 population (Fig. 2b) is visualised as sex ratio degree measured on a weekly basis, from week 10 when the first female flowers appeared until week 16 when the trial finished. It follows the trend of flowering time with male flowers appearing before female flowers and senescing earlier. At week 16, many seeds of varying degrees of ripeness were formed on plants from pollinated female flowers.
Inflorescence density, a good indicator of dry flower biomass and seed yield, was measured subjectively at the end of the trial on a scale of one to five, with one standing for the lowest and five for the highest density (Supplementary Fig. S1). The distribution (Fig. 2c) resembles the normal distribution slightly negatively skewed towards lower densities. Overall, the inflorescence density distribution suggests a tendency towards a balanced distribution within the studied S1 population.
Morphological and flowering parameters are correlated
We hypothesised that some morphological traits found in the S1 population would exhibit interdependence and be correlated to each other. The strength of the linear relationship between observed quantitative morphological and flowering traits was measured using Pearson correlation (Fig. 3). Plant height at the end of the trial showed a strong positive correlation with stem diameter at 10 cm height above the soil level, and both these traits were strongly positively correlated with dry biomass yield. The flowering time of male flowers showed a positive correlation with the flowering time of female flowers, and a negative correlation with plant height, stem diameter, and dry biomass yield. However, this trend was not observed in relation to the flowering time of female flowers (Fig. 3).
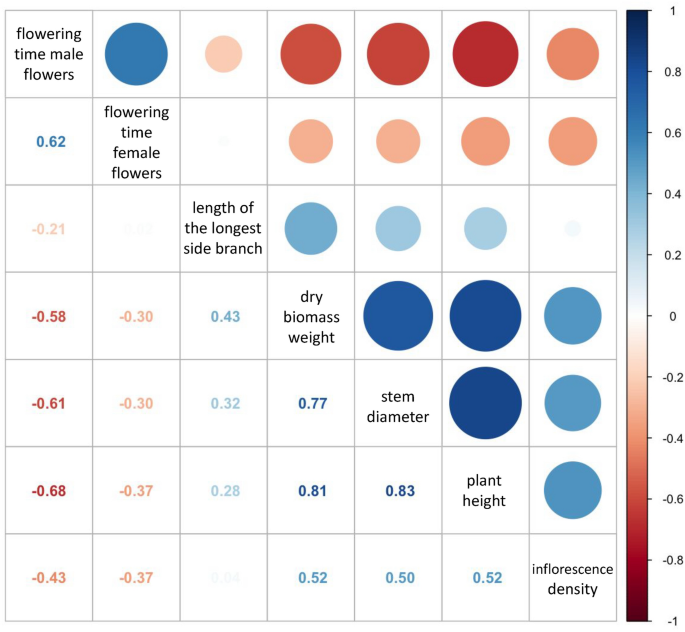
Correlation analysis of the examined quantitative traits. The results of correlation analysis reveal strong linkages among various morphological and flowering traits. The correlation coefficients displayed in the lower left corner indicate the degree of association between continuous quantitative observed traits. A correlation coefficient of +1 signifies a perfect positive correlation, while a coefficient of −1 represents a perfect negative correlation.
Heterozygosity rate of the parent plant is dependent on the sequencing method used
Hemp is highly heterozygous11,12,14. However, it is crucial to note that the computed rate of heterozygosity is affected by the number of analysed single nucleotide variants (SNVs)55, and this can vary based on different library preparation methods12,56.
The parent plant used to generate the S1 generation was sequenced using both double digest restriction-site associated DNA (ddRAD) and whole genome sequencing (WGS). The ddRAD-sequenced parent plant sample yielded 9358 SNVs. Out of these, 3530 SNVs were heterozygous. The heterozygosity rate, computed as a ratio of heterozygous to all SNVs, was 37.7%. The same parent plant sample sequenced on the WGS platform yielded 4,731,739 SNVs. Given that 2,515,651 of these SNVs were heterozygous, the heterozygosity rate of the whole-genome sequenced parent plant sample was 53.2%. 6325 SNVs in the parent plant sample were identified through both ddRAD and WGS sequencing methods.
Genome-specific association study (GSAS) enables the identification of SNVs significantly associated with phenotypic traits
To identify S1 SNVs associated with quantitative phenotypic traits we first filtered out SNVs which were not following the Mendelian law of segregation and then used the BLINK package38 initially developed for GWAS. Continuous traits of interest were plant height, length of the longest side branch, stem diameter at 10Â cm above the soil level, and dry biomass weight. Discrete traits of interest were flowering time for both male and female flowers, and inflorescence density.
On some of the chromosomes, namely chromosome 2 (NC_044375.1), chromosome 5 (NC_044374.1), and the non-recombining half of the X sex chromosome (NC_044370.1) a higher number of SNVs were removed when filtering for alleles segregating in the 1:2:1 ratio than from other chromosomes. Fewer SNVs in these loci were then used for the subsequent association analysis due to possible segregation distortion57 in these loci.
At least one statistically significant SNV was associated with each of the traits of interest (Fig. 4, Supplementary Table S2, Supplementary Fig. S3). The variance in the phenotypic trait explained by these SNVs as the proportion of total variance varied between 31.6% in the case of one of the two identified SNVs significantly associated with flowering time of female flowers and 2.1% for one of the five SNVs significantly associated with plant height and one of the four SNVs significantly associated with dry biomass weight (Supplementary Table S2). Two loci with common significant markers within the same haplotype (Supplementary Table S3) were detected by two traits, and another two by more than two traits (Supplementary Fig. S2). However, not all p values of these markers were significant at the genomic level (Supplementary Table S2).
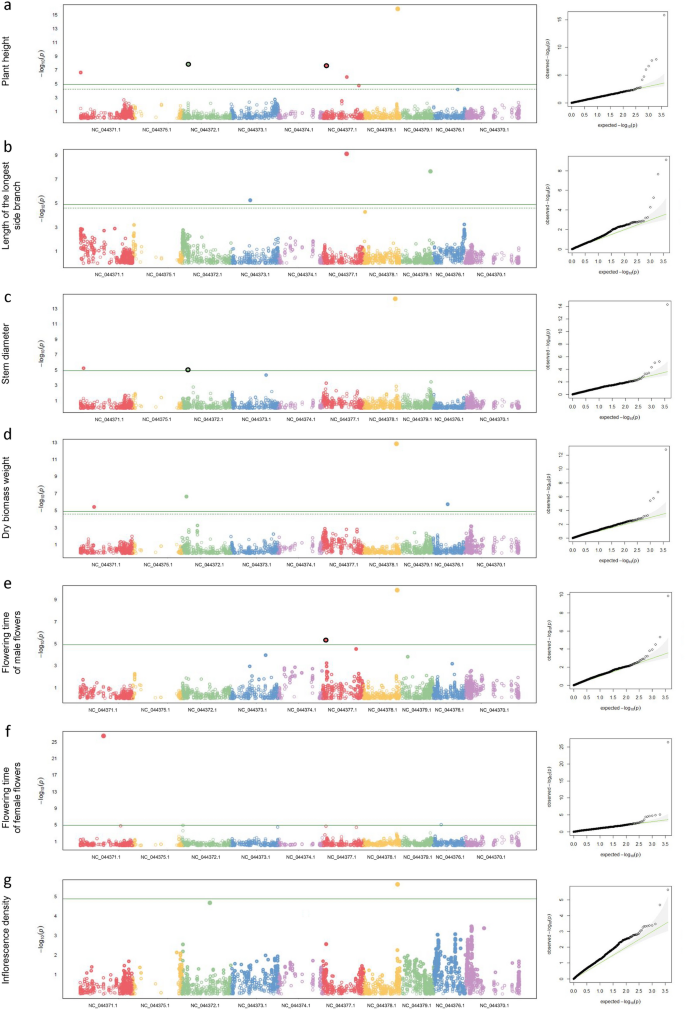
Manhattan plots and QQ plots of GSAS results display statistically significant SNVs and a good fit of the model for individual phenotypic traits. GSAS results displayed for plant height (a), length of the longest side branch (b), stem diameter (c), dry biomass weight (d), flowering time of male (e) and female flowers (f), and inflorescence density (g). In each panel, the Manhattan plot displays the p values of the entire S1 population GSAS on a genomic scale. The green line represents the significance level. Statistically significant SNVs can be found in the Supplementary Table S2. QQ plot is a graphical representation of the deviation of the observed p values from the null hypothesis. The green trend line represents the expected p values and the grey area 95% confidence region. SNVs significantly associated with more than one trait of interest are highlighted in black.
The proportion of phenotypic variance of a trait explained by an associated SNV is positively correlated with minor allele frequency and the magnitude of the marker effect58. QQ plots (Fig. 4) visualising the deviation of the observed p values from the null hypothesis confirm the good fit of the model for individual phenotypic traits. The analysis achieved a statistical power of 16.4% at α = 0.05.
A total of 410 haplotype blocks, representing SNVs that are physically inherited together, were identified (Supplementary Table S3). The number of haplotypes varied between 15 on chromosome 2 (NC_044375.1) to 55 on chromosome 3 (NC_044372.1).
Analysis of haplotypes including SNVs significant for more than one trait of interest showed interesting patterns
To examine some of the statistically significantly associated SNVs more closely, we chose those associated with more than one trait of interest.
An SNV on chromosome 3 was significantly associated with plant height and stem diameter at 10 cm above the soil level (NC_044372.1:11,400,838, REF: A, ALT: T, major allele: A). Analysis of the position across all individuals revealed that 87 individuals carried homozygous alleles, 177 individuals heterozygous alleles, and 71 individuals homozygous alternative alleles. Individuals carrying homozygous allele had significantly lower plant height (Welch t-test, p value 7.12e−07 and 5.02e−05 respectively) as well as stem diameter (Welch t-test, p value 2.36e−04 and 1.02e−04 respectively) than those carrying either homozygous alternative or heterozygous allele (Fig. 5a). The haplotype associated with this SNV contained an additional 10 SNVs (Fig. 5b, Supplementary Table S3). Genes from the reference genome annotation in the range of this haplotype include examples of key development regulators, such as a WRKY homologue (LOC115709155) and homeobox transcription factor (LOC115709290) (Supplementary Table S4).
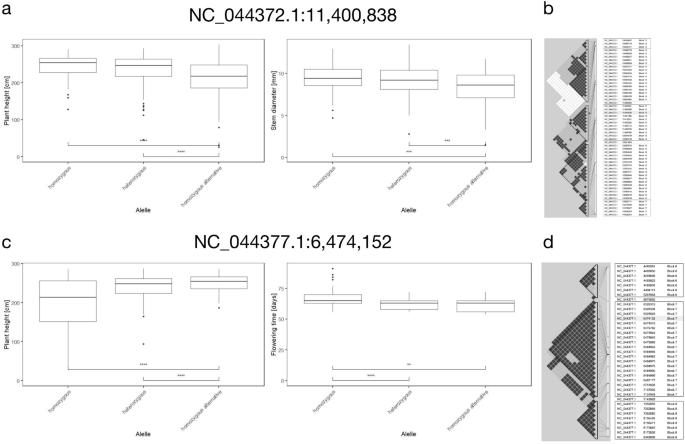
Analysis of statistically significant SNVs associated with more than one trait of interest revealed interesting patterns. An SNV on chromosome 3 (NC_044372.1:11,400,838, REF: A, ALT: T) was statistically significantly associated with plant height and stem diameter at 10 cm above the soil level. Boxplots depicting the value of each trait for individuals carrying either homozygous, heterozygous, or homozygous alternative allele at this position (a) manifest significant differences as determined by the Welch t-test (p <  0.001****). Haplotype inference for this SNV suggests that this allele, highlighted as a green dot, is inherited together with another 10 analysed alleles (b). Another SNV, on chromosome 6, (NC_044377.1:6,474,152, REF: G, ALT: A) was statistically significantly associated with plant height and flowering time of male flowers. Boxplots illustrate the value of each trait for individuals carrying either homozygous, heterozygous, or homozygous alternative allele at this position (c) with differences assessed by Welch t-test (p < 0.01** and p < 0.0001****). Haplotypes estimated for this SNV suggest that this allele, highlighted as a green dot, is inherited with an additional 19 analysed alleles (d). The effect of each of the two SNVs used as an example on the values of associated traits is notable in comparison to the correlation of those traits (Fig. 3).
Another SNV statistically significant for more than one trait and associated with plant height and flowering time of male flowers was identified on chromosome 6 (NC_044377.1:6,474,152, REF: G, ALT: A, major allele: G). Information about the allele was missing for 220 individuals from the S1 population. Analysis across all individuals of the S1 population revealed that 29 individuals carried homozygous alleles, 72 individuals heterozygous alleles, and 21 individuals homozygous alternative alleles in this position. Individuals carrying heterozygous or homozygous alternative allele had significantly higher plant height (Welch t-test, p value 8.11e−05 and 3.25e−03 respectively) and earlier onset of flowering of male flowers (Welch t-test, p value 1.56e−05 and 3.50e−03 respectively) than those carrying homozygous allele (Fig. 5c). Plant height and flowering time of male flowers were also negatively correlated (Fig. 3). The estimated haplotype block contained an additional 19 SNVs (Fig. 5d). Genes from the reference genome annotation in the range of this haplotype include ethylene-responsive transcription factor 5-like (LOC115694911) (Supplementary Table S5).
Discussion
The two primary objectives of this study were to investigate the intravarietal variability by analysing the variability present within a single plant, utilising a population derived from the self-pollinated ‘Felina 32’ hemp plant, and to associate specific loci in its genome with traits of interest utilising a newly developed GSAS approach.
Phenotypic variability arises from genetic variability in hemp
‘Felina 32’ has early-medium length flowering time26,59 and relatively high biomass and fibre yield are characteristic of this cultivar60. It also provides a relatively high seed yield61,62 a high yield of secondary metabolites, namely cannabinoids, terpenoids, and phenolic compounds63, and its seeds have high polyphenolic content and showed the highest antioxidant activity of 20 studied cultivars9. The potential of ‘Felina 32’ as a hyperaccumulator of heavy metals for phytoremediation64,65 and as biofuel in the form of pressed pellets66 was investigated as well. Uniformity in the variety of agronomically important traits could further increase the economic potential of the ‘Felina 32’ cultivar.
‘Felina 32’ is a monoecious cultivar. Monoecious cultivars are reported to be more uniform than dioecious cultivars in plant height and seed yield45,67, fibre quality68, and flowering time45,67,68,69. This presents an advantage for mechanical harvesting and processing67,70. However, the pollen of monoecious cultivars is reported to be less uniform than the pollen of dioecious cultivars71.
The high heterozygosity of the parent plant and the segregation of alleles in the offspring resulted in high variability in many different traits in the S1 population. We phenotyped and genotyped 342 individuals, presumably capturing a large spectrum of the potential variability. However, it is presumed that if all seeds generated after the self-pollination of the parent plant were cultivated, an increase in the variability of some traits might be observed.
Outstanding are mainly the variability in plant height and dry biomass yield. In the vegetative phase, distinctions in plant height within the S1 population kept increasing rapidly and plant height plateaued when plants switched to the generative phase. At the harvest, the difference in plant height between some of the plants was more than tenfold (Fig. 1a). The difference in the dry biomass weight was very high, surpassing 160-fold (Fig. 1f). Dry biomass weight was strongly positively correlated with both the plant height and stem diameter and all three traits were strongly negatively correlated with flowering time of male flowers (Fig. 3). These findings align with previously published studies in which increase in the plant height during the vegetative phase positively correlated with biomass yield and negatively with flowering time72,73. The flowering time of female and male flowers were positively correlated, but the correlation of the flowering time of female flowers with other morphological traits, such as plant height, stem diameter, or biomass yield was not as strong as in the case of male flowers, suggesting a different genetic control mechanism. The succession of male and female flowers emergence followed the established flowering pattern of monoecious hemp cultivars26,68. On each plant, male flowers appeared before female flowers and each plant expressed both types of flowers, suggesting that while there might be variability in the degree of monoecy in the S1 population, the trait conferring monoecy itself was fixed in the mother plant. Previous reports state the loss of monoecy and reversion to dioecy in hemp68,74, suggesting a genetic or epigenetic component75 which likely was not present in the mother plant employed for this study.
It appears that for some of the highly correlated phenotypic traits are responsible specific hotspots on certain chromosomes, such as one on chromosome 3 (NC_044372.1) for positively correlated plant height, stem diameter, and dry biomass weight, or one on chromosome 9 (NC_044376.1) for negatively correlated plant height with either flowering time of male or female flowers (Supplementary Fig. S2).
Previous studies attributed the phenotypic variability in traits observed in hemp primarily to the environmental factors and agronomic practices, such as water or nutrient availability, sowing density, or timing of sowing and harvesting in relation to photoperiod, amount of light, and temperature18,26,27,28,39,43,69,70,76,77,78,79,80. To ensure that phenotypic variability could be ascribed to genetic variability, measures were taken to exclude or minimise environmental effects. These measures included the use of border plants, optimised fertigation regime, consistent inter-plant spacing, and regular randomisation of plant positions throughout cultivation. Biological controls were used for pest management. Thus, in this study, the observed variability in morphological and developmental traits arose predominantly from the underlying genetic variability. It is noteworthy that no previous study has comprehensively explored the variability of a single plant through the S1 population or even intravarietal variability in hemp to this extent.
Genome-specific association study inference is a viable tool for mapping genetic trait loci
Phenotype is determined by genotype, environment, and their interactions. For effective breeding efforts, it is imperative to first comprehend the effect of the genotype.
The statistical genetic analysis of the association between phenotypic and genotypic data has been primarily utilising one of the two prevalent methodologies, QTL mapping and GWAS, each harbouring its inherent limitations. GSAS profits from the heterozygosity contained in the parent plant similar in this context to the F1 generation in QTL mapping. However, due to the algorithms used, GSAS is more closely related to GWAS but instead of a panel of different cultivars and individuals with different levels of relatedness, it utilises the S1 population for the detection of alleles statistically significantly associated with traits of interest, thereby achieving higher accuracy. Additionally, by phenotyping and genotyping the monoparental S1 population originating from a self-pollinated plant, the laborious and time-intensive cultivation of several generations of progeny or inbred lines is circumvented. This approach hinges on the ease of cultivating and self-pollinating the parent plant when the only concern is to prevent cross-pollination from other individuals. Self-pollination in hemp is almost effortless, especially in monoecious cultivars. Additionally, many methods of sex modification or reversion in dioecious C. sativa cultivars by exogenous applications of plant growth regulators81 or silver-containing compounds82 have been known for a long time.
The S1 population, derived from self-pollination of a single highly heterozygous C. sativa parent plant, exhibits segregation of alleles due to meiotic recombination in the parent plant generating new combinations of alleles. This segregation of alleles is the genetic basis for the phenotypic variability observed in the S1 population. As a consequence of selfing, the S1 generation shows a reduction in heterozygosity compared to the parent, with the emergence of homozygous genotypes following Mendelian inheritance patterns83,84. The S1 population will inherit haplotype blocks from the parent, but these blocks will be broken down by recombination over generations of selfing. While C. sativa exhibits some karyotype polymorphisms85,86, large-scale genomic rearrangements are not expected to arise de novo within a single S1 generation.
The GSAS analysis focuses solely on heterozygous alleles of the parent plant segregating in the expected 1:2:1 Mendelian ratio within the S1 population which is a pattern resulting from the parent’s haplotype structure and recombination events. The S1 population then allows for exploration of the variability of a specific parent plant on the genomic scale, therefore, the suggested designation for this type of study is a genome-specific association study (GSAS). While the captured variability accounts for a fraction of the broader cultivar variability, the simplicity of obtaining the S1 population, subsequent association analysis utilising the tools developed for GWAS to identify alleles significantly associated with various traits of interest, and the level of confidence in findings render this approach uniquely convenient.
The power of the GWAS model to identify true association between an allele and specific traits is known to depend on several parameters. Among the most important are the population structure and size of the mapping panel87, alongside the effect size, which characterises how two different variants of the allele differ in their effect on phenotype. Challenges arise in GWAS when handling rare variants and alleles with small effect size31,88. From human genetics, it is known that to achieve the same statistical power a larger sample size is needed for family-based GWAS than for GWAS with unrelated individuals, but concerns about uncorrected stratification in the population can be avoided89. Another important parameter affecting statistical power is the quantity of analysed SNVs which can be influenced by the choice of the sequencing platform90. ddRAD sequencing proved to be instrumental as a relatively inexpensive method yielding SNV markers91 which can be utilised for identification of alleles associated with traits of interest92. Epistasis and population structure also contribute to the association between traits and SNVs, even in instances where the SNVs aren’t causal. Interestingly, some non-causal SNVs have been found to be more informative indicators for specific traits than causative ones93. Additionally, the overall design of GSAS allows to capture only variability contained in a single plant which might not contain alleles associated with a given trait across the studied cultivar or species. Associated alleles can also be missed if they do not manifest Mendelian inheritance or their segregation is distorted. Increasing the population size to include individuals from all seeds generated by the parent plant would enhance the robustness of results, particularly for detecting rare variants and alleles with small effect sizes. To capture a higher variability within a cultivar and to prevent missing loci because of segregation distortion multiple mother plants could be employed to generate multiple independent S1 populations. The use of a population made from random cross-pollination of several parent plants of the same cultivar is also conceivable. Additionally, the effects of genetic variants may vary depending on the specific environmental conditions. Conducting trials to evaluate the identified associations across different environments can help assess their consistency and robustness.
Advancements in the development of the GWA analysis models have yielded a suitable framework for the GSA analysis for the effective identification of statistically significant alleles with both major and minor effects, assuming the S1 population size is substantial. Fixed and random model Circulating Probability Unification (FarmCPU)94 and the model of choice for GSAS, Bayesian-information and LD Iteratively Nested keyway (BLINK)38, are both multilocus models employed for marker association across genomes. Multilocus models allow for the association analysis of traits controlled by many rare SNVs with a large phenotypic effect on the trait or many common SNVs with a small effect on the trait. Similarly to the general linear model, BLINK bypasses the kinship computation58 and allows optimisation for the population structure, but it differs in using the Bonferroni correction for establishing the p value threshold and thereby mitigating many false positives. Instead, BLINK relies on the Bayesian information criteria (BIC) and runs iteratively two fixed models. The use of BIC not only enhances computational efficiency but also increases statistical power. Additionally, BLINK eliminates the requirement for genes underlying a trait to be distributed evenly across the genome, further improving the statistical power38.
The combination of streamlined generation of a single phenotyped population, identification of segregating SNVs heterozygous in the parent plant, and application of a suitable model previously developed for GWAS allowing for the polygenic association of studied traits make the GSAS approach uniquely suitable for the exploration of variability in hemp and other highly heterozygous crops with the little known genetic background of phenotypic traits.
Search for trait-associated markers in hemp
Markers for marker-assisted selection linked to various agronomically important traits were identified in hemp in the past. The type of markers always reflected methods available at the time. Numerous successful attempts to identify markers related to chemotype determination in C. sativa, both hemp and marijuana67,95, or associated with Y chromosome and sex determination96 were extensively reviewed. Types of these markers include allozymes, restriction fragment length polymorphisms (RFLP), amplified fragment length polymorphisms (AFLP), random amplified polymorphic DNA (RAPD) markers, or simple sequence repeats (SSR) and inter-simple sequence repeats (ISSR). More recently, the first attempts to develop SSR markers for evaluating homozygosity, genetic uniformity, and genetic variation within and among various hemp cultivars were developed to facilitate marker-assisted breeding97.
The GSAS method represents a logical progression of these undertakings. Although the character and number of analysed SNVs are influenced by the employed sequencing method, the availability of heterozygous SNVs of the whole-genome sequenced parent plant allows to screen the S1 samples to investigate alleles in these positions employing PCR Allelic Competitive Extension98 (PACE™, 3CR Bioscience, UK). Thanks to the PCR amplification of cDNA this approach is cost-effective and has a short turn-around time compared to any sequencing method. It can be used with PACE™ (3CR Bioscience, UK), KASP™ assays (LGC Biosearch Technologies, UK), or Amplifluor™ assays (Merck KGaA, Germany) coupled with sequence-specific fluorescent probes which allow to differentiate between allele variants. This approach was successfully used for SNV genotyping to detect SARS-CoV-2 variants99, the fruity aroma in Fragaria × ananassa100, and as a complementary method to confirm SNV sex-linked markers in Colossoma macropomum identified in ddRAD-sequenced samples101.
Subsequent validation of the identified SNVs and haplotypes identified by GSAS, whether through expression analysis or gene editing techniques, will allow to confirm their causality. Irrespective of the causality, identified SNVs offer valuable tools for marker-assisted breeding. The development of new hemp cultivars based on the traditional individuals selection method is a lengthy and strenuous process7. Availability of SNV markers associated with specific traits will allow for an increase in homozygosity at loci associated with the given trait but simultaneously maintain heterozygosity in the rest of the genome102 to allow for heterosis103 and phenotypic plasticity. High heterozygosity in hemp11,12,14 resulting from allogamy and cross-pollination45 introduces a potential for breeding new hemp cultivars with improved values in traits of interest45,104,105 adapted to specific environmental conditions. Studies focused on the expression of these traits under various environmental conditions and climates45 and allele mining in germplasm collections containing various cultivars have the potential to uncover additional SNVs and haplotypes associated with specific phenotypes. Progress in the development of models for the analysis of such interactions106 implies the development of a model for analysing the interaction of statistically significant SNVs obtained from GSAS with the environment in the near future.
Summary
This study provides the most extensive investigation of intravarietal phenotypic variability in hemp conducted to date by examining the variability of an individual hemp plant through an S1 population. It presents significant SNVs and haplotypes associated with plant height, length of the longest side branch, dry biomass yield, flowering time of male and female flowers, and inflorescence density. Nevertheless, the main contribution of this study lies in demonstrating an innovative, straightforward, and cost-effective GSAS approach. This approach leverages a combination of a population originating from a single self-pollinated heterozygous plant, the application of a law of segregation, and existing models for the association of phenotypic with genomic data from this population to identify markers significantly associated with traits of interest. The GSAS method can substantially contribute to advancing our foundational understanding of hemp – a high-value crop with a plethora of applications. Applied research can facilitate the breeding of new hemp cultivars that will be more uniform and show superior performance in key traits relevant to various applications. Such advancements hold the promise of development of breeding strategies for novel hemp cultivars without genetic modifications and optimising both the cultivation and processing of hemp plants, thus aligning with the need for continuously expanding industry and creating productive, sustainable, and resilient agricultural systems. Beyond hemp, this approach offers the potential to investigate the intravarietal variability of other highly heterozygous plant genomes and crops displaying low uniformity, in which the genetic background of the traits remains little understood.
Methods
Plant cultivation
‘Felina 23’ can be found under the ‘Registered’ status in the EUPVP—Common Catalogue also known as the List of EU-approved hemp varieties107. In the summer of 2021, a single hemp plant of the ‘Felina 23’ (Seedstockers) cultivar was grown in the greenhouse at Rosemount Environmental Research Station in Dublin, Ireland, and self-pollinated.
It produced over 2100 viable seeds. Over 650 of these seeds were sown at the end of May 2022 in 0.5L pots in a custom horticultural substrate mix 1:1:1:1 (John Innes No. 1 : John Innes No. 2 : Perlite : Vermiculite) and grown under artificial LED horticultural lights, and controlled temperature and humidity conditions in the grow room at University College Dublin for one week. After one week, 600 of these plants were re-planted into 1L pots using the same custom horticultural substrate and placed in the greenhouse under natural sunlight with no forced air circulation. After another 3 weeks, 450 of these plants were replanted into 3L pots in a custom growing substrate mix 4:4:1:1 (John Innes No. 1 : John Innes No. 2 : Perlite : Vermiculite). 350 plants were labelled and phenotyped from this day on, the rest were used as border plants to ensure identical environmental conditions for phenotyped plants. During the trial, eight of these plants were damaged and therefore not included in the GSAS analysis. The position of plants was randomised every four weeks during the trial to avoid bias associated with their position in the greenhouse. Until week six, the horticultural substrate mix provided plants with sufficient amounts of nutrients to use only water for watering. From week six until week 12, plants were fertilised once a week with water-soluble crystalline fertiliser (NPK 24-8-16, Water Soluble All Purpose Plant Food, Scotts Miracle-Gro Products, Inc.) in the form of a bottom feed. From week 12 until the harvest in week 16, when the majority of plants were flowering, liquid fertiliser VitaLink EarthMAX Bloom (NPK 1.7–1.8–3.6, HydroGarden Ltd) was supplied three times a week as a bottom feed. During the trial, the greenhouse temperature ranged between 15.5 and 40.5 °C with an average of 22.6 °C, and relative humidity ranged between 24.0 and 94.0% with an average of 70.1%. All seasonal insect infestations (thrips, various types of aphids, white flies, fungus gnats) were controlled using natural predators, specifically various types of mites and parasitic wasps.
Phenotypic measurements and morphological records of S1 population
Plant height was measured once a week from week four of the trial until the harvest day. Plant height was measured from the base of the plant to the top of the main stem. The appearance of the first side branch on each plant was observed three times a week and recorded. Flowering was defined as the presence of a female flower with visible stigmata and a male flower bulb with a length of at least 3Â mm. The presence of either male or female flowers was observed three times a week. The day when male and female flowers were first observed was recorded as male respectively female flowering time for each plant expressed as a number of days after sowing. From week 10, sex expression was recorded for each individual phenotyped plant once a week. The sex expression is characterised by the degree of monoecy developed by Sengbusch53 on a scale from 0 to 6 as the ratio between male and female flowers. The scale was previously modified and used by Faux et al.26 to record the monoecy degree of a hemp plant plots by randomly selecting plants on defined observational dates and by Faux et al.59 for each flowering node of each observed plant independently once a week.
Inflorescence density (Supplementary Fig. S1), length of 10 longest side branches, and stem diameter at 10 cm and 110 cm above the substrate level were recorded at the time of the harvest. Plants were cut ~ 10 cm above the substrate line at a standard harvesting height. Stem diameter was measured at this height and then at 110 cm to assess stem growth over a metre of the plant. Following harvest, plants were dried first naturally by hanging upside down in the greenhouse followed by placing plants in the drying oven (Memmert GmbH) at 60 °C for at least 24 h. The dry biomass weight was then recorded.
Tissue harvesting and DNA extraction
At weeks four, five, and six after sowing, tissue samples of individuals from the S1 population were harvested from the young leaves. At weeks 11 and 13 after sowing, tissue samples from the leaves of the parent plant were harvested. Samples were snap-frozen in liquid nitrogen and stored at − 78 °C before DNA extraction. Genomic DNA was extracted from each sample using a DNeasy plant mini kit (Qiagen, Germany). DNA quality and concentration were controlled using gel electrophoresis, NanoDrop Microvolume Spectrophotometer (ThermoFisher Scientific), and Qubit sDNA Kit (ThermoFisher Scientific) fluorometric quantification.
Library preparation and sequencing of S1 population and the parent plant
Genomic DNA of 342 plants from the S1 population and the parent plant was digested with PstI + MspI restriction enzyme combination and the library was prepared following the ddRAD-Seq protocol108. The library was sequenced on the PE100 DNBSEQ-G400RS sequencing platform (MGI).
The parent plant was sequenced at 30 × WGS on the Illumina NovaSeq PE150 platform.
Mapping, variant calling, and filtering
Adapters were trimmed from the collection of paired-end reads of the RAD-sequenced S1 population and the parent plant with Trimmomatic, version 0.39109. Trimmed forward and reverse reads were aligned using the BWA-MEM algorithm to index C. sativa CBDRx (cs10) genome assembly GCF_900626175.2110,111. Indexing and mapping were performed using Burrows-Wheeler Aligner, BWA version 0.7.17112. Mapped reads were sorted and converted to BAM format using SAMtools, version 1.11113. Statistical analysis was performed using BAMtools114. Variants were called from all S1 samples into one file and from the parent plant sample into a separate file using BCFtools, version 1.17113. The same tool was used to change the sample names in the resulting file and to call variants from the parent plant. Next, VCFtools115 was used for S1 samples to select only biallelic SNVs with quality values over 30 mapped to chromosomes of the reference genome, read depth between 5 and 100, and minor allele frequency greater or equal to 5%. The resulting file allowed for an 80% proportion of missing data across a specific locus and yielded 16,148 SNVs. To keep only positions that were heterozygous in the parent plant, Chi-squared statistics were computed in R, version 4.2.3116 to test for a ratio of homozygous to heterozygous to homozygous alternative alleles for each position meeting an expected ratio of 1:2:1. Positions with p value lower or equal to 1% were excluded yielding 3920 SNVs.
VCFtools115 was used to filter the WGS-sequenced parent plant file to select only biallelic SNVs mapped to chromosomes of the reference genome with quality values over 30, and read depth between five and 50, resulting in 5,818,449 SNVs. The same type of filtering, with the exception of read depth between 5 and 100 resulted in 16,719 SNVs in the filtered ddRAD-sequenced parent plant file. These files were not filtered on any population-related parameters.
Calculation of heterozygosity of the parent plant
The individual heterozygosity of the parent plant was calculated using TASSEL, version 5.0117 as the ratio of heterozygous to all SNVs after removing the unknown alleles.
Genome-specific association study (GSAS)
The p value filtered file was converted to Hapmap format using TASSEL, version 5.0117. Association analysis and statistical power were computed in BLINK38 utilising GAPIT, version 358 in R environment, version 4.2.3116.
Haplotypes and genes identification
Haplotype blocks118,119 were estimated using PLINK 1.9120,121 in the 1Â Mb window. Subsequently, haplotypes were visualised with Haploview122.
Genes from the C. sativa CBDRx (cs10) genome110,111 assembly annotation in ranges of haplotype blocks were identified using the NCBI Genome Browser123,124,125.
Data availability
The raw sequencing and phenotyping data have been deposited in the NIH Sequence Read Archive (SRA) under BioProject PRJNA1107367.
Abbreviations
- SNV:
-
Single nucleotide variant
- GSAS:
-
Genome-specific association study
- GWAS:
-
Genome-wide association study
- QTL:
-
Quantitative trait loci
- ddRAD:
-
Double digest restriction-site associated DNA
- WGS:
-
Whole-genome sequencing
- FarmCPU:
-
Fixed and random model circulating probability unification
- BLINK:
-
Bayesian-information and LD iteratively nested keyway
- BIC:
-
Bayesian information criteria
- RFLP:
-
Restriction fragment length polymorphism
- AFLP:
-
Amplified fragment length polymorphism
- RAPD:
-
Random amplified polymorphic DNA
- SSR:
-
Simple sequence repeat
- ISSR:
-
Inter-simple sequence repeat
- PACE:
-
PCR allelic competitive extension
References
-
Schilling, S. et al. The Cream of the Crop: Biology, Breeding and Applications of Cannabis Sativa. https://www.authorea.com/users/360584/articles/483690-the-cream-of-the-crop-biology-breeding-and-applications-of-cannabis-sativa?commit=6532fb15968ae2aa7e3410d50241bbd53a2ff5cf (2020) https://doi.org/10.22541/au.160139712.25104053/v2.
-
Visković, J. et al. Industrial hemp (Cannabis sativa L.) agronomy and utilization: A review. Agronomy 13, 931 (2023).
-
Yano, H. & Fu, W. Hemp: A sustainable plant with high industrial value in food processing. Foods 12, 651 (2023).
-
Herer, J. The Emperor Wears No Clothes (Ah Ha Publishing, 2007).
-
Anderson, S. L., Pearson, B., Kjelgren, R. & Brym, Z. Response of essential oil hemp (Cannabis sativa L.) growth, biomass, and cannabinoid profiles to varying fertigation rates. PLOS ONE 16, e0252985 (2021).
-
Höppner, F. & Menge-Hartmann, U. Yield and quality of fibre and oil of fourteen hemp cultivars in Northern Germany at two harvest dates. Landbauforsch. Völkenrode 3, 219–232 (2007).
-
Poniatowska, J. et al. Variability of cannabinoid yields of fibre hemp cultivars depending on the sowing density and nitrogen fertilisation. Plant Soil Environ. 68, 525–532 (2022).
-
Amarasinghe, P. et al. The morphological and anatomical variability of the stems of an industrial hemp collection and the properties of its fibres. Heliyon 8, e09276 (2022).
-
Galasso, I. et al. Variability in Seed traits in a collection of Cannabis sativa L. genotypes. Front. Plant Sci. 7, 688 (2016).
-
Duong, H., Pearson, B., Anderson, S., Berthold, E. & Kjelgren, R. Variation in hydric response of two industrial hemp varieties (Cannabis sativa) to induced water stress. Horticulturae 9, 431 (2023).
-
Sawler, J. et al. The genetic structure of marijuana and hemp. PLOS ONE 10, e0133292 (2015).
-
Lynch, R. C. et al. Genomic and chemical diversity in Cannabis. Crit. Rev. Plant Sci. 35, 349–363 (2016).
-
Soorni, A., Fatahi, R., Haak, D. C., Salami, S. A. & Bombarely, A. Assessment of genetic diversity and population structure in Iranian cannabis germplasm. Sci. Rep. 7, 15668 (2017).
-
Trubanová, N., Pender, G., McCabe, P. F., Melzer, R. & Schilling, S. Exploring phenotypic and genetic variability in hemp (Cannabis sativa). https://www.biorxiv.org/content/https://doi.org/10.1101/2023.11.01.565084v1 (2023).
-
Campbell, B. J., Berrada, A. F., Hudalla, C., Amaducci, S. & McKay, J. K. Genotype × environment interactions of industrial hemp cultivars highlight diverse responses to environmental factors. Agrosystems Geosci. Environ. 2, 1–11 (2019).
-
Stack, G. M. et al. Season-long characterization of high-cannabinoid hemp (Cannabis sativa L.) reveals variation in cannabinoid accumulation, flowering time, and disease resistance. GCB Bioenergy 13, 546–561 (2021).
-
Hammami, N., Privé, J.-P. & Moreau, G. Spatiotemporal variability and sensitivity of industrial hemp cultivars under variable field conditions. Eur. J. Agron. 138, 126549 (2022).
-
van der Werf, H. M. G., van Geel, W. C. A., van Gils, L. J. C. & Haverkort, A. J. Nitrogen fertilization and row width affect self-thinning and productivity of fibre hemp (Cannabis sativa L.). Field Crops Res. 42, 27–37 (1995).
-
Komahan, D. H. S. et al. Future scenario of better New Zealand adapted industrial hemp varieties. Agron. N. Z. 49, 63–39 (2019).
-
Ozaki, K. et al. Functional SNPs in the lymphotoxin-α gene that are associated with susceptibility to myocardial infarction. Nat. Genet. 32, 650–654 (2002).
-
Zhao, K. et al. Genome-wide association mapping reveals a rich genetic architecture of complex traits in Oryza sativa. Nat. Commun. 2, 467 (2011).
-
Turuspekov, Y. et al. GWAS for plant growth stages and yield components in spring wheat (Triticum aestivum L.) harvested in three regions of Kazakhstan. BMC Plant Biol. 17, 190 (2017).
-
Ranc, N. et al. Genome-wide association mapping in tomato (Solanum lycopersicum) is possible using genome admixture of Solanum lycopersicum var. cerasiforme. G3 GenesGenomesGenetics 2, 853–864 (2012).
-
Priyanatha, C., Torkamaneh, D. & Rajcan, I. Genome-wide association study of soybean germplasm derived from Canadian × Chinese crosses to mine for novel alleles to improve seed yield and seed quality traits. Front. Plant Sci. 13, 866300 (2022).
-
Sakamoto, K., Akiyama, Y., Fukui, K., Kamada, H. & Satoh, S. Characterization; genome sizes and morphology of sex chromosomes in hemp (Cannabis sativa L.). Cytologia (Tokyo) 63, 459–464 (1998).
-
Faux, A.-M. et al. The relationship of stem and seed yields to flowering phenology and sex expression in monoecious hemp (Cannabis sativa L.). Eur. J. Agron. 47, 11–22 (2013).
-
Petit, J. et al. Genetic variability of morphological, flowering, and biomass quality traits in hemp (Cannabis sativa L.). Front. Plant Sci. 11, 102 (2020).
-
Petit, J., Salentijn, E. M. J., Paulo, M.-J., Denneboom, C. & Trindade, L. M. Genetic architecture of flowering time and sex determination in hemp (Cannabis sativa L.): A genome-wide association study. Front. Plant Sci. 11, 569958 (2020).
-
De Ronne, M., Lapierre, É. & Torkamaneh, D. Genetic Insights into Agronomic and Morphological Traits of Drug-Type Cannabis Revealed by Genome-Wide Association Studies. http://biorxiv.org/lookup/doi/https://doi.org/10.1101/2023.11.09.566286 (2023).
-
Dehnavi, M. M. et al. Population genomics of a natural Cannabis sativa L. collection from Iran identifies novel genetic loci for flowering time, morphology, sex and chemotyping. https://doi.org/10.1101/2024.05.07.593022 (2024).
-
Korte, A. & Farlow, A. The advantages and limitations of trait analysis with GWAS: A review. Plant Methods 9, 29 (2013).
-
Brachi, B. et al. Linkage and association mapping of Arabidopsis thaliana flowering time in nature. PLoS Genet. 6, e1000940 (2010).
-
Zhao, K. et al. An arabidopsis example of association mapping in structured samples. PLoS Genet. 3(1), 71–82 (2005).
-
Sallam, A., Arbaoui, M., El-Esawi, M., Abshire, N. & Martsch, R. Identification and verification of QTL associated with frost tolerance using linkage mapping and GWAS in winter faba bean. Front. Plant Sci. 7, 1098 (2016).
-
Zhang, T. et al. A combined linkage and GWAS analysis identifies QTLs linked to soybean seed protein and oil content. Int. J. Mol. Sci. 20, 5915 (2019).
-
Gardiner, L.-J., Bansept-Basler, P., El-Soda, M., Hall, A. & O’Sullivan, D. M. A framework for gene mapping in wheat demonstrated using the Yr7 yellow rust resistance gene. PLOS ONE 15, e0231157 (2020).
-
Sallam, A., Eltaher, S., Alqudah, A. M., Belamkar, V. & Baenziger, P. S. Combined GWAS and QTL mapping revealed candidate genes and SNP network controlling recovery and tolerance traits associated with drought tolerance in seedling winter wheat. Genomics 114, 110358 (2022).
-
Huang, M., Liu, X., Zhou, Y., Summers, R. M. & Zhang, Z. BLINK: A package for the next level of genome-wide association studies with both individuals and markers in the millions. GigaScience 8, giy154 (2019).
-
Amaducci, S., Zatta, A., Raffanini, M. & Venturi, G. Characterisation of hemp (Cannabis sativa L.) roots under different growing conditions. Plant Soil 313, 227–235 (2008).
-
Khan, M. M. R. et al. Compressive properties of hemp (Cannabis sativa L.) stalks. Biosyst. Eng. 106, 315–323 (2010).
-
Wang, S. et al. Assessment system to characterise and compare different hemp varieties based on a developed lab-scaled decortication system. Ind. Crops Prod. 117, 159–168 (2018).
-
Carlson, C. H. et al. Morphometric relationships and their contribution to biomass and cannabinoid yield in hybrids of hemp (Cannabis sativa ). J. Exp. Bot. 72, 7694–7709 (2021).
-
van der Werf, H. M. G., Wijlhuizen, M. & de Schutter, J. A. A. Plant density and self-thinning affect yield and quality of fibre hemp (Cannabis sativa L.). Field Crops Res. 40, 153–164 (1995).
-
Musio, S., Müssig, J. & Amaducci, S. Optimizing hemp fiber production for high performance composite applications. Front. Plant Sci. 9, 1702 (2018).
-
Salentijn, E. M. J., Zhang, Q., Amaducci, S., Yang, M. & Trindade, L. M. New developments in fiber hemp (Cannabis sativa L.) breeding. Ind. Crops Prod. 68, 32–41 (2015).
-
Pervaiz, M. & Sain, M. M. Carbon storage potential in natural fiber composites. Resour. Conserv. Recycl. 39, 325–340 (2003).
-
Shen, Z., Tiruta-Barna, L. & Hamelin, L. From hemp grown on carbon-vulnerable lands to long-lasting bio-based products: Uncovering trade-offs between overall environmental impacts, sequestration in soil, and dynamic influences on global temperature. Sci. Total Environ. 846, 157331 (2022).
-
Prade, T., Svensson, S.-E. & Mattsson, J. E. Energy balances for biogas and solid biofuel production from industrial hemp. Biomass Bioenergy 40, 36–52 (2012).
-
Rheay, H. T., Omondi, E. C. & Brewer, C. E. Potential of hemp (Cannabis sativa L.) for paired phytoremediation and bioenergy production. GCB Bioenergy 13, 525–536 (2021).
-
Chen, C. & Pan, Z. Cannabidiol and terpenes from hemp–ingredients for future foods and processing technologies. J. Future Foods 1, 113–127 (2021).
-
Westerhuis, W. et al. Sowing density and harvest time affect fibre content in hemp ( Cannabis sativa ) through their effects on stem weight. Ann. Appl. Biol. 155, 225–244 (2009).
-
Westerhuis, W. et al. Plant weight determines secondary fibre development in fibre hemp (Cannabis sativa L.). Ind. Crops Prod. 139, 111493 (2019).
-
von Sengbusch, R. Ein weiterer Beitrag zur Vererbung des Geschlechts bei Hanf als Grundlage für die Züchtung eines monözischen Hanfes. Z. Für Pflanzenzücht. 31(3), 319–338 (1952).
-
Faux, A.-M. & Bertin, P. Modelling approach for the quantitative variation of sex expression in monoecious hemp (Cannabis sativa L.). Plant Breed. 133, 782–787 (2014).
-
Vergara, D. et al. Genetic and genomic tools for Cannabis sativa. Crit. Rev. Plant Sci. 35, 364–377 (2016).
-
Friel, J., Bombarely, A., Fornell, C. D., Luque, F. & Fernández-Ocaña, A. M. Comparative analysis of genotyping by sequencing and whole-genome sequencing methods in diversity studies of Olea europaea L. Plants 10, 2514 (2021).
-
Dai, B., Guo, H., Huang, C., Ahmed, M. M. & Lin, Z. Identification and characterization of segregation distortion loci on cotton chromosome 18. Front. Plant Sci. 7, 2037 (2017).
-
Wang, J. & Zhang, Z. GAPIT version 3: Boosting power and accuracy for genomic association and prediction. Genomics Proteomics Bioinform. 19, 629–640 (2021).
-
Faux, A.-M., Berhin, A., Dauguet, N. & Bertin, P. Sex chromosomes and quantitative sex expression in monoecious hemp (Cannabis sativa L.). Euphytica 196, 183–197 (2014).
-
Datasheet Felina 32 (FR).
-
Rahemi, A., Dhakal, R., Temu, V. W., Rutto, L. & Kering, M. K. Performance of different-use type industrial hemp cultivars under mid-Atlantic region conditions. Agronomy 11, 2321 (2021).
-
Hansen, J. et al. 2017 Industrial Hemp Trials for New York State Grain and Fiber Production (2018).
-
Ingallina, C. et al. Cannabis sativa L. Inflorescences from monoecious cultivars grown in central Italy: An untargeted chemical characterization from early flowering to ripening. Molecules 25, 1908 (2020).
-
Hussain, T. et al. Demystifying the liverwort Radula marginata, a critical review on its taxonomy, genetics, cannabinoid phytochemistry and pharmacology. Phytochem. Rev. 18, 953–965 (2019).
-
Canu, M. et al. Hemp cultivation in soils polluted by Cd, Pb and Zn in the Mediterranean area: Sites characterization and phytoremediation in real scale settlement. Appl. Sci. 12, 3548 (2022).
-
Jasinskas, A., Streikus, D. & Vonžodas, T. Fibrous hemp (Felina 32, USO 31, Finola) and fibrous nettle processing and usage of pressed biofuel for energy purposes. Renew. Energy 149, 11–21 (2020).
-
Mandolino, G. & Carboni, A. Potential of marker-assisted selection in hemp genetic improvement. Euphytica 140, 107–120 (2004).
-
Small, E. Evolution and classification of Cannabis sativa (Marijuana, Hemp) in relation to human utilization. Bot. Rev. 81, 189–294 (2015).
-
Amaducci, S. et al. Evaluation of a phenological model for strategic decisions for hemp (Cannabis sativa L.) biomass production across European sites. Ind. Crops Prod. 37, 100–110 (2012).
-
Salentijn, E. M. J., Petit, J. & Trindade, L. M. The complex interactions between flowering behavior and fiber quality in hemp. Front. Plant Sci. 10, 614 (2019).
-
Migalj, N. D. Morphology of hemp (Cannabis L.) pollen. Bot. Zhurnal 54, 274276 (1969).
-
Hall, J., Bhattarai, S. P. & Midmore, D. J. The effects of different sowing times on maturity rates, biomass, and plant growth of industrial fiber hemp. J. Nat. Fibers 10, 40–50 (2013).
-
Toth, J. A., Stack, G. M., Carlson, C. H. & Smart, L. B. Identification and mapping of major-effect flowering time loci Autoflower1 and Early1 in Cannabis sativa L. Front. Plant Sci. 13, 991680 (2022).
-
Neuer, H. & Sengbusch, R. V. Die Geschlechtsvererbung bei Hanf und die Züchtung eines monöcischen Hanfes. Zücht 15, 49–62 (1943).
-
Truta, E., Olteanu, Z., Surdu, T., Zamfirache, M.-M. & Opric, M. Some aspects of sex determinism in hemp. Analele Ştiinţ. Ale Univ. Alexandru Ioan Cuza Secţiunea Genet. Şi Biol. Mol. (2007).
-
Borthwick, H. A. & Scully, N. J. Photoperiodic responses of hemp. Bot. Gaz. 116, 14–29 (1954).
-
de Meijer, E. P. M. Fibre hemp cultivars: A survey of origin, ancestry, availability and brief agronomic characteristics. J. Int. Hemp Assoc. 2(2), 66–73 (1995).
-
Struik, P. C. et al. Agronomy of fibre hemp (Cannabis sati6a L.) in Europe. Ind. Crops Prod. 12, 107–118 (2000).
-
Amaducci, S. et al. Key cultivation techniques for hemp in Europe and China. Ind. Crops Prod. 68, 2–16 (2015).
-
Tang, K., Struik, P. C., Amaducci, S., Stomph, T. J. & Yin, X. Hemp (Cannabis sativa L.) leaf photosynthesis in relation to nitrogen content and temperature: Implications for hemp as a bio-economically sustainable crop. GCB Bioenergy 9, 1573–1587 (2017).
-
Galoch, E. The hormonal control fo sex differentiation in dioecious plant of hemp (Cannabis sativa). Acta Soc. Bot. Pol. XLVII, 153–162 (1978).
-
Mohan Ram, H. Y. & Sett, R. Induction of fertile male flowers in genetically female Cannabis sativa plants by silver nitrate and silver thiosulphate anionic complex. Theor. Appl. Genet. 62, 369–375 (1982).
-
De Meijer, E. P. M. & Hammond, K. M. The inheritance of chemical phenotype in Cannabis sativa L. (II): Cannabigerol predominant plants. Euphytica 145, 189–198 (2005).
-
Kurtz, L. E., Mahoney, J. D., Brand, M. H. & Lubell-Brand, J. D. Comparing genotypic and phenotypic variation of selfed and outcrossed progeny of hemp. HortScience 55, 1206–1209 (2020).
-
Razumova, O. V., Alexandrov, O. S., Divashuk, M. G., Sukhorada, T. I. & Karlov, G. I. Molecular cytogenetic analysis of monoecious hemp (Cannabis sativa L.) cultivars reveals its karyotype variations and sex chromosomes constitution. Protoplasma 253, 895–901 (2016).
-
Lynch, R. C. et al. Domesticated cannabinoid synthases amid a wild mosaic cannabis pangenome. https://doi.org/10.1101/2024.05.21.595196 (2024)
-
Widmayer, S. J., Evans, K. S., Zdraljevic, S. & Andersen, E. C. Evaluating the power and limitations of genome-wide association studies in Caenorhabditis elegans. G3 GenesGenomesGenetics 12, jkac114 (2022).
-
Wu, X. et al. Prioritized candidate causal haplotype blocks in plant genome-wide association studies. PLOS Genet. 18, e1010437 (2022).
-
Uffelmann, E. et al. Genome-wide association studies. Nat. Rev. Methods Prim. 1, 59 (2021).
-
Klein, R. J. Power analysis for genome-wide association studies. BMC Genet. 8, 58 (2007).
-
Peterson, B. K., Weber, J. N., Kay, E. H., Fisher, H. S. & Hoekstra, H. E. Double digest RADseq: An inexpensive method for De Novo SNP discovery and genotyping in model and non-model species. PLoS ONE 7, e37135 (2012).
-
Poland, J. A. & Rife, T. W. Genotyping�by�Sequencing for Plant Breeding and Genetics. Plant Genome 5, plantgenome2012.05.0005 (2012).
-
Platt, A., Vilhjálmsson, B. J. & Nordborg, M. Conditions under which genome-wide association studies will be positively misleading. Genetics 186, 1045–1052 (2010).
-
Liu, X., Huang, M., Fan, B., Buckler, E. S. & Zhang, Z. Iterative usage of fixed and random effect models for powerful and efficient genome-wide association studies. PLOS Genet. 12, e1005767 (2016).
-
Coyle, H. M., Palmbach, T., Juliano, N., Ladd, C. & Lee, H. C. An overview of DNA methods for the identification and individualization of Marijuana. Croat Med. J. 44(3), 315–321 (2003). PMID: 12808725.
-
Toth, J. A. et al. Development and validation of genetic markers for sex and cannabinoid chemotype in Cannabis sativa L. GCB Bioenergy 12, 213–222 (2020).
-
Borin, M. et al. Developing and testing molecular markers in Cannabis sativa (hemp) for their use in variety and dioecy assessments. Plants 10, 2174 (2021).
-
von Maydell, D. PCR allele competitive extension (PACE). In Plant Genotyping vol. 2638 (Humana, 2023).
-
Harper, H. et al. Detecting SARS-CoV-2 variants with SNP genotyping. PLoS ONE 16, e0243185 (2021).
-
Oh, Y. et al. Genomic characterization of the fruity aroma gene, FaFAD1, reveals a gene dosage effect on γ-Decalactone production in strawberry (Fragaria × ananassa). Front. Plant Sci. 12, 639345 (2021).
-
Varela, E. S. et al. A high-density linkage map and sex-linked markers for the Amazon Tambaqui Colossoma macropomum. BMC Genomics 22, 709 (2021).
-
Clarke, R. C. & Merlin, M. D. Cannabis domestication, breeding history, present-day genetic diversity, and future prospects. Crit. Rev. Plant Sci. 35, 293–327 (2016).
-
Barcaccia, G. et al. Potentials and challenges of genomics for breeding cannabis cultivars. Front. Plant Sci. 11, 573299 (2020).
-
Ranalli, P. Current status and future scenarios of hemp breeding. Euphytica 140, 121–131 (2004).
-
Flajšman, M. & A�ko, D. K. Industrial hemp breeding and genetics. In Industrial Hemp 37–57 (Elsevier, 2022). https://doi.org/10.1016/B978-0-323-90910-5.00009-9.
-
Yu, K. et al. Genome-wide association studies reveal novel QTLs, QTL-by-environment interactions and their candidate genes for tocopherol content in soybean seed. Front. Plant Sci. 13, 1026581 (2022).
-
European commission. Common catalogue of varieties of agricultural plant species. EUPVP – COMMON Cat. 10 (2023).
-
Shirasawa, K., Hirakawa, H. & Isobe, S. Analytical workflow of double-digest restriction site-associated DNA sequencing based on empirical and in silico optimization in tomato. DNA Res. 23, 145–153 (2016).
-
Bolger, A. M., Lohse, M. & Usadel, B. Trimmomatic: A flexible trimmer for Illumina sequence data. Bioinformatics 30, 2114–2120 (2014).
-
Cannabis sativa genome assembly cs10 v2. NCBI https://www.ncbi.nlm.nih.gov/datasets/genome/GCF_900626175.2/.
-
Grassa, C. J. et al. A Complete Cannabis Chromosome Assembly and Adaptive Admixture for Elevated Cannabidiol (CBD) Content. http://biorxiv.org/lookup/doi/https://doi.org/10.1101/458083 (2018)
-
Li, H. & Durbin, R. Fast and accurate short read alignment with Burrows–Wheeler transform. Bioinformatics 25, 1754–1760 (2009).
-
Danecek, P. et al. Twelve years of SAMtools and BCFtools. GigaScience 10, giab008 (2021).
-
Barnett, D. W., Garrison, E. K., Quinlan, A. R., Strömberg, M. P. & Marth, G. T. BamTools: A C++ API and toolkit for analyzing and managing BAM files. Bioinformatics 27, 1691–1692 (2011).
-
Danecek, P. et al. The variant call format and VCFtools. Bioinformatics 27, 2156–2158 (2011).
-
R Core Team. R: A Language and Environment for Statistical Computing (R Foundation for Statistical Computing, 2021).
-
Bradbury, P. J. et al. TASSEL: Software for association mapping of complex traits in diverse samples. Bioinformatics 23, 2633–2635 (2007).
-
Taliun, D., Gamper, J. & Pattaro, C. Efficient haplotype block recognition of very long and dense genetic sequences. BMC Bioinform. 15, 10 (2014).
-
Gaunt, T. R., RodrÃguez, S. & Day, I. N. Cubic exact solutions for the estimation of pairwise haplotype frequencies: implications for linkage disequilibrium analyses and a web tool ‘CubeX’. BMC Bioinform. 8, 428 (2007).
-
Purcell, S. & Chang, C. PLINK 1.9.
-
Chang, C. C. et al. Second-generation PLINK: Rising to the challenge of larger and richer datasets. GigaScience 4, 7 (2015).
-
Barrett, J. C., Fry, B., Maller, J. & Daly, M. J. Haploview: Analysis and visualization of LD and haplotype maps. Bioinformatics 21, 263–265 (2005).
-
Sayers, E. W. et al. Database resources of the national center for biotechnology information. Nucleic Acids Res. 50, D20–D26 (2022).
-
Rangwala, S. H. et al. Accessing NCBI data using the NCBI sequence viewer and genome data viewer (GDV). Genome Res. 31, 159–169 (2021).
-
Gene. NCBI https://www.ncbi.nlm.nih.gov/datasets/gene/.
Acknowledgements
N. T. is funded by the University College Dublin, School of Biology and Environmental Science. The Postdoctoral Fellowship for Research in Japan, granted to N. T. by the London office of JSPS, enabled collaboration between University College Dublin in Ireland and Kazusa DNA Research Institute in Japan, making this study possible. We thank Crawford-Hayes summer interns Ava Evans, Beth Dimond, and Ben O’Leary Chaney for their help with plant phenotyping, and all members of the UCD Flower Power research group for their assistance with the harvest. Additionally, we thank Keishi Ozawa and Akiko Obara for their help with library preparation and sequencing.
Author information
Authors and Affiliations
Contributions
S. S. conceived the original idea. N. T. and S. S. designed the study. R. M. and S. S. supervised the cultivation of plants, phenotyping, and phenotypic data analysis. G. K. and N. T. extracted DNA from samples. S. I. and K. S. supervised genotyping. S. I., K. S., and A. W. supervised genomic data analysis and association analysis. N. T., a JSPS International Research Fellow, conducted the study and drafted the manuscript. All authors discussed the results, provided critical feedback, and reviewed the final manuscript.
Corresponding authors
Ethics declarations
Competing interests
The authors declare no competing interests.
Additional information
Publisher’s note
Springer Nature remains neutral with regard to jurisdictional claims in published maps and institutional affiliations.
Supplementary Information
Rights and permissions
Open Access This article is licensed under a Creative Commons Attribution-NonCommercial-NoDerivatives 4.0 International License, which permits any non-commercial use, sharing, distribution and reproduction in any medium or format, as long as you give appropriate credit to the original author(s) and the source, provide a link to the Creative Commons licence, and indicate if you modified the licensed material. You do not have permission under this licence to share adapted material derived from this article or parts of it. The images or other third party material in this article are included in the article’s Creative Commons licence, unless indicated otherwise in a credit line to the material. If material is not included in the article’s Creative Commons licence and your intended use is not permitted by statutory regulation or exceeds the permitted use, you will need to obtain permission directly from the copyright holder. To view a copy of this licence, visit http://creativecommons.org/licenses/by-nc-nd/4.0/.
About this article
Cite this article
Trubanová, N., Isobe, S., Shirasawa, K. et al. Genome-specific association study (GSAS) for exploration of variability in hemp (Cannabis sativa).
Sci Rep 15, 8371 (2025). https://doi.org/10.1038/s41598-025-92168-5
-
Received: 13 July 2024
-
Accepted: 24 February 2025
-
Published: 11 March 2025
-
DOI: https://doi.org/10.1038/s41598-025-92168-5
Keywords
Search
RECENT PRESS RELEASES
Related Post


