How Amazon’s $1B Belgium Investment Shapes the Stock’s Valuation in 2025
October 12, 2025
If you’re holding Amazon.com stock or wondering whether now is the right time to jump in, you’re not alone. The past few weeks have posed some tough questions for investors, with shares down 1.4% over the last seven days and off 5.9% for the month. Even year to date, the stock is treading water, slipping 1.7%. Yet looking further out, the picture brightens considerably: Amazon shares are up an impressive 14.6% over the last year and more than doubled (up 102.4%) over the past three. Those longer-term gains suggest the recent choppiness might be just noise for a company of this scale, especially given the ongoing news out of Seattle.
Recent headlines haven’t exactly been smooth sailing. Amazon temporarily halted its drone delivery program in Arizona after an aircraft collision attracted attention from both the FAA and NTSB, then promptly resumed the program. News also broke of the devices division’s VP stepping away shortly after hyped-up new device announcements. At the same time, Amazon announced plans to invest EUR 1 billion into Belgium infrastructure, a sign of long-term confidence and ambition even as some execs make headlines criticizing internal momentum. It’s a classic case of short-term volatility versus long-term growth narrative.
But ultimately, what really matters is valuation. Right now, Amazon scores a 5 out of 6 on our valuation checklist, meaning the company appears undervalued in nearly every metric we track. Over the next sections, I’ll break down these valuation models and what they say about Amazon today. And if you’re looking for a smarter, more nuanced way to gauge what the stock is truly worth, keep reading. The best assessment comes at the end.
Why Amazon.com is lagging behind its peers
Advertisement
Approach 1: Amazon.com Discounted Cash Flow (DCF) Analysis
The Discounted Cash Flow (DCF) model estimates a company’s true value by looking ahead at all the cash it’s expected to generate in the future, then adjusting those numbers back to today’s dollars. In other words, it asks: What are Amazon’s future cash flows worth right now?
At present, Amazon is producing $37.6 Billion in Free Cash Flow (FCF) annually. Analysts forecast rapid growth, with FCF projected to rise to $134.6 Billion by 2029, driven by both retail operations and Amazon Web Services. While formal analyst estimates only run out five years, further projections extrapolate this impressive upward trend out to 2035. Simply Wall St’s model expects FCF to more than double within a decade, pointing to substantial future earning power in dollars.
When these future cash flows are discounted back to today’s value, the model calculates Amazon’s intrinsic value at $271.61 per share. With shares currently trading about 20.3% below this fair value estimate, the DCF approach points to the stock being notably undervalued at current prices.
Result: UNDERVALUED
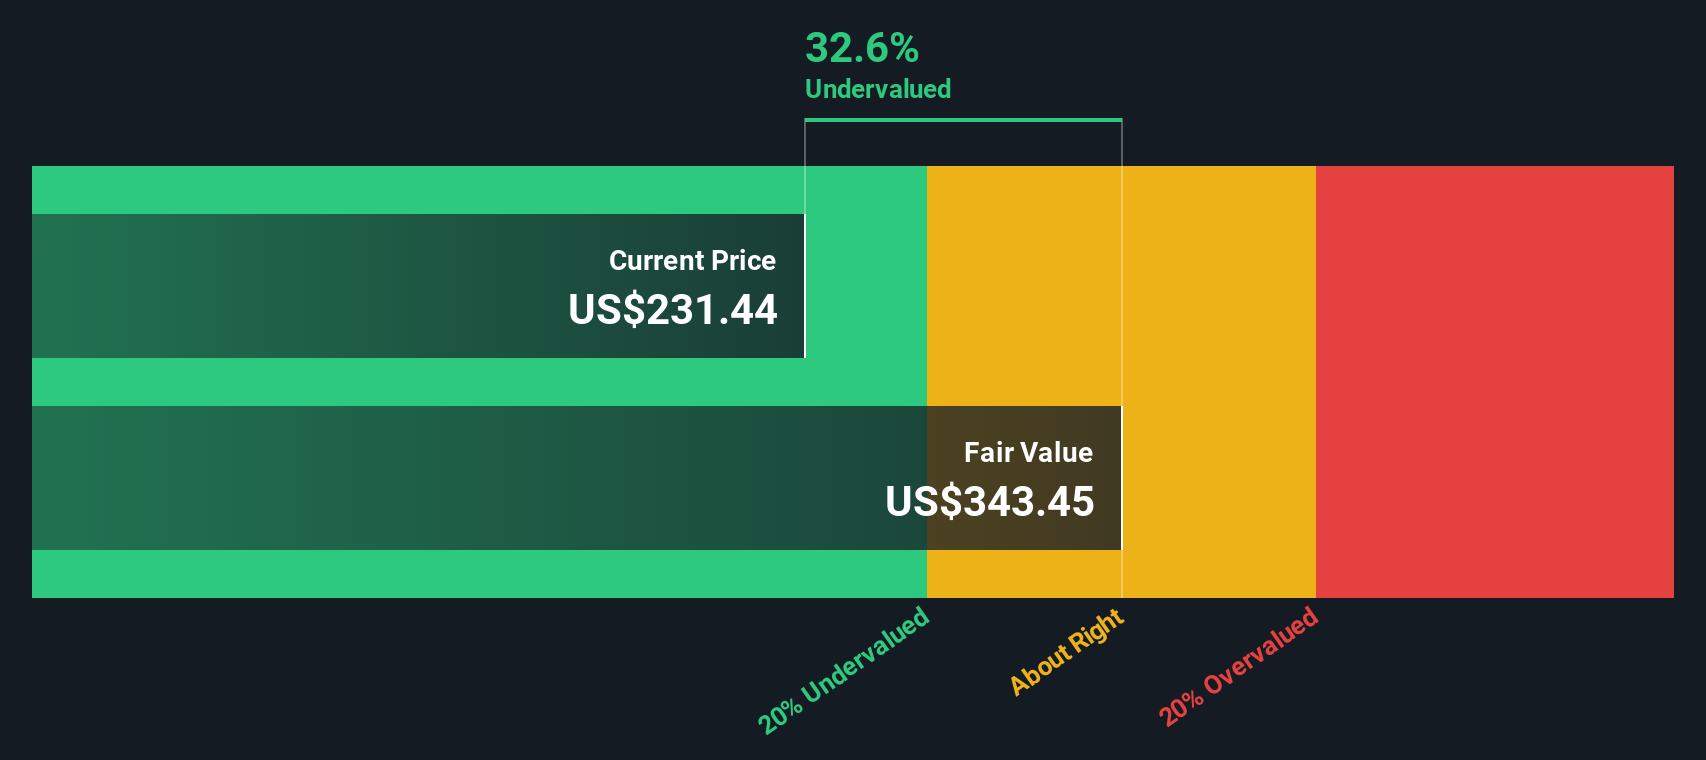
Our Discounted Cash Flow (DCF) analysis suggests Amazon.com is undervalued by 20.3%. Track this in your watchlist or portfolio, or discover more undervalued stocks.
Approach 2: Amazon.com Price vs Earnings
The price-to-earnings (PE) ratio is the go-to metric for valuing consistently profitable companies like Amazon. This multiple helps investors gauge what price they are paying for each dollar of the company’s current earnings, making it especially useful when profits are strong and sustainable. A higher PE often reflects market optimism about future growth or lower perceived risks, while a lower PE could signal caution or undervaluation. However, context is everything: growth prospects, profitability, and industry norms all shape what counts as “fair”.
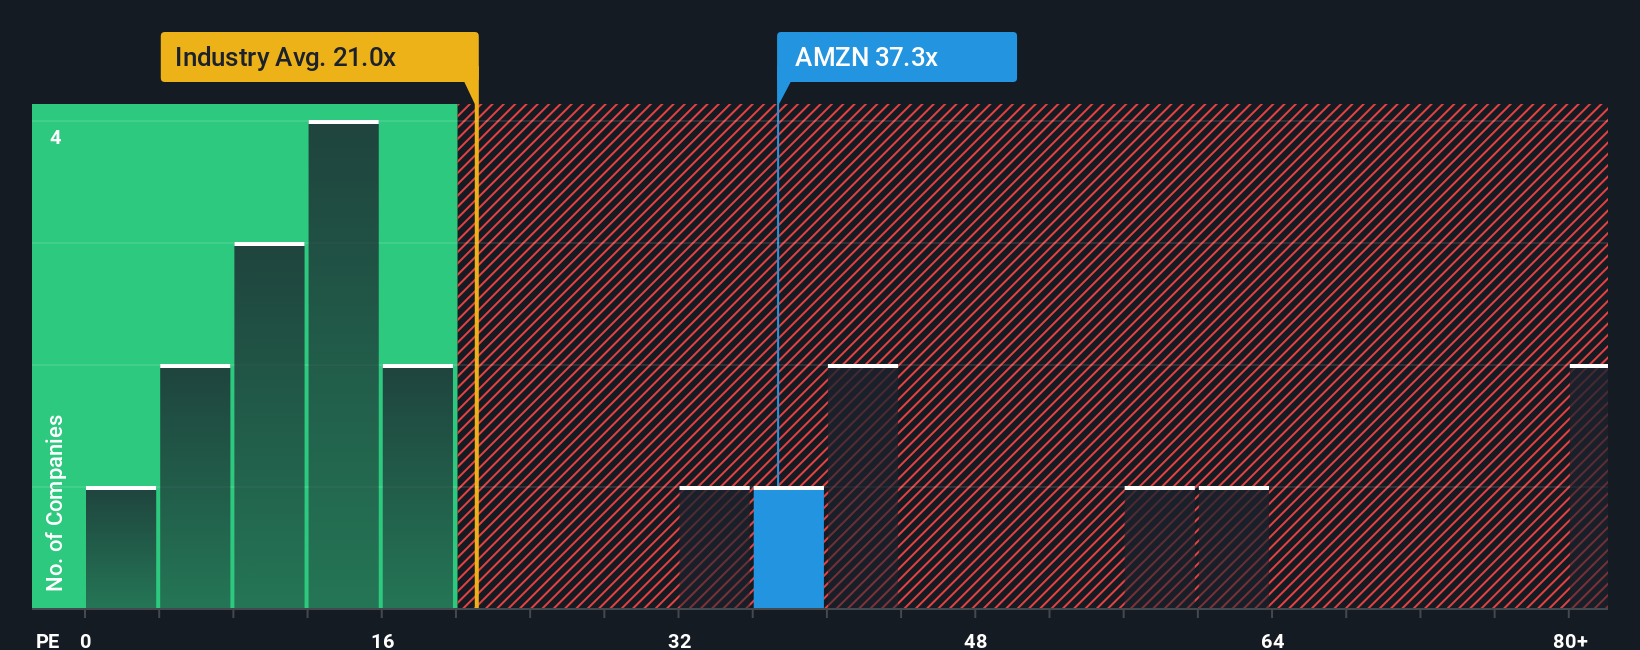
Right now, Amazon is trading at a PE of 32.7x. That is above the Multiline Retail industry average of 21.9x, but notably below the average for its peer group at 43.0x. On its own, Amazon’s premium over the industry may look pricey, yet this headline number misses some key details about Amazon’s massive scale, robust profitability, and market position. These are all factors investors should weigh before making any calls on value.
This is where the “Fair Ratio” comes in. This metric, calculated by Simply Wall St, blends Amazon’s expected earnings growth, margins, size, and industry risk to pinpoint what PE makes sense for this particular business right now. Because it considers not just peer or industry averages but also company-specific strengths and risks, it provides a more complete benchmark. For Amazon, the Fair Ratio sits at 38.8x, meaning the stock’s actual PE is considerably below this tailored value.
With Amazon’s PE ratio at 32.7x versus a Fair Ratio of 38.8x, the stock appears undervalued on this key metric. It is trading at a discount to what its quality and prospects would justify, even after accounting for its size and risk profile.
Result: UNDERVALUED
PE ratios tell one story, but what if the real opportunity lies elsewhere? Discover companies where insiders are betting big on explosive growth.
Upgrade Your Decision Making: Choose your Amazon.com Narrative
Earlier, we mentioned that there is an even better way to understand valuation, so let’s introduce you to Narratives. This is a powerful tool that brings the story behind Amazon’s numbers to life.
A Narrative is your personal investment perspective. It ties together your outlook on Amazon’s strategy, growth potential, and risks, and connects that story directly to forecasts for revenue, earnings, margins, and ultimately a fair value. Narratives transform dry data into actionable insights, making it easy for any investor to articulate their thesis, see how it affects valuation, and compare it with the market price, all in one place.
On Simply Wall St’s Community page, millions of investors create and share Narratives. This lets you access, learn from, and even build upon others’ views, whether you’re new to investing or deeply experienced. Narratives update automatically as new results or news arrive, so your analysis evolves in real-time.
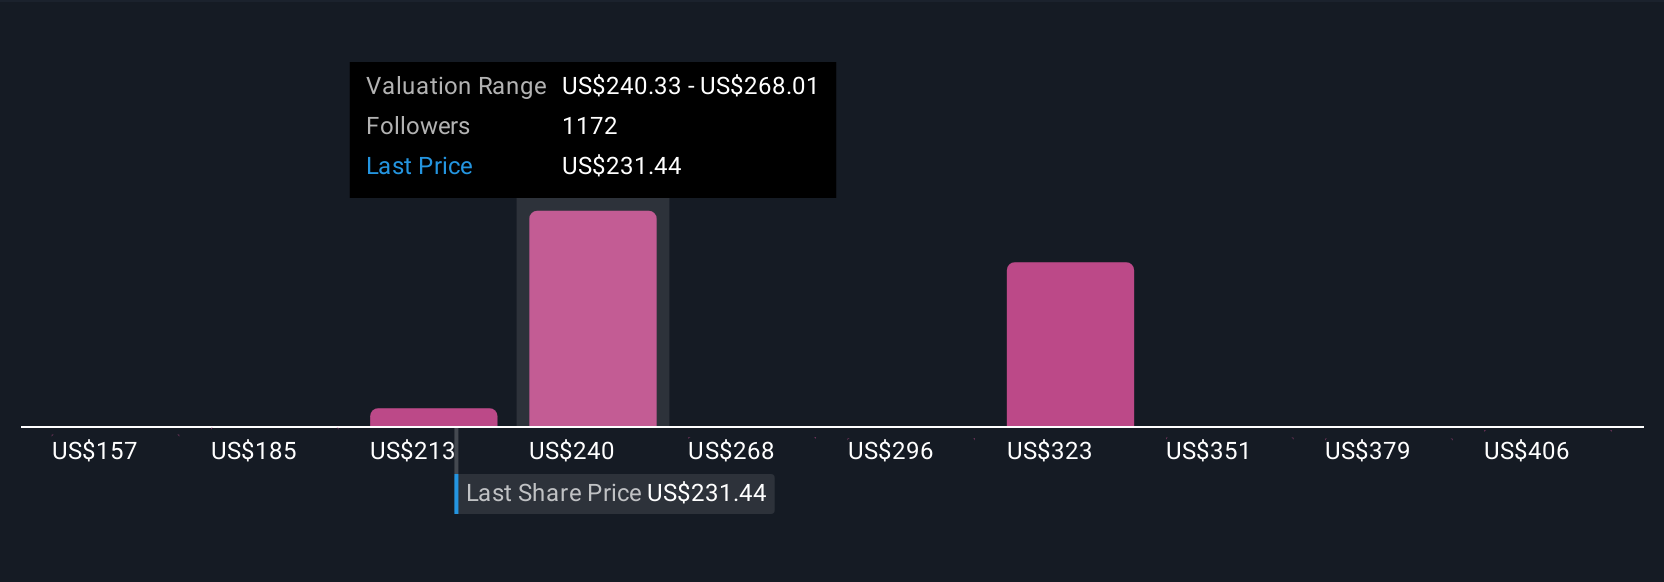
For example, some investors take a bullish stance, forecasting robust growth in Amazon’s tech and AI segments and estimate a fair value as high as $434 per share. Others focus on mature retail headwinds or margin risks, leading to more conservative estimates near $151 per share. By exploring the range of Narratives, you can choose the one that best matches your view and make informed buy or sell decisions based on that story.
For Amazon.com, however, we’ll make it really easy for you with previews of two leading Amazon.com Narratives:
- 🐂 Amazon.com Bull Case
Fair Value Estimate: $222.55
Current Price Discount: -2.78%
Forecast Revenue Growth: 15.19%
- Amazon’s core profitability is set to be powered by high-growth businesses like AWS, Advertising, and Third-Party Sellers. Long-term reinvestment is expected to build operating leverage.
- Operating cash flow and free cash flow are projected to continue rapid expansion as key segments outperform, supported by ongoing international growth and infrastructure optimization.
- Risks such as regulatory challenges and economic downturns could slow growth, but the current focus on core segments, global eCommerce trends, and the cloud opportunity support a robust long-term outlook.
- 🐻 Amazon.com Bear Case
Fair Value Estimate: $151.21
Current Price Premium: 43.14%
Forecast Revenue Growth: 7.2%
- Amazon faces headwinds from the maturity of its core retail business, rising capital investment needs, and increased competition, particularly from large retailers like Walmart moving further into eCommerce.
- While AWS and Advertising are expected to remain growth drivers, the base for future gains is tempered by slowing market expansion, eroding sales-to-capital efficiency, and potential dilution from stock-based compensation.
- Risks remain around trade tensions with China (impacting 3rd-party sales), evolving consumer demand, and the ability to maintain profitability and market share in an increasingly saturated and competitive environment.
Do you think there’s more to the story for Amazon.com? Create your own Narrative to let the Community know!
This article by Simply Wall St is general in nature. We provide commentary based on historical data
and analyst forecasts only using an unbiased methodology and our articles are not intended to be financial advice. It does not constitute a recommendation to buy or sell any stock, and does not take account of your objectives, or your
financial situation. We aim to bring you long-term focused analysis driven by fundamental data.
Note that our analysis may not factor in the latest price-sensitive company announcements or qualitative material.
Simply Wall St has no position in any stocks mentioned.
New: Manage All Your Stock Portfolios in One Place
We’ve created the ultimate portfolio companion for stock investors, and it’s free.
• Connect an unlimited number of Portfolios and see your total in one currency
• Be alerted to new Warning Signs or Risks via email or mobile
• Track the Fair Value of your stocks
Have feedback on this article? Concerned about the content? Get in touch with us directly. Alternatively, email editorial-team@simplywallst.com
Search
RECENT PRESS RELEASES
Related Post


