How High Can Bitcoin Go? This Expert Predicts BTC Price Jump to $137,000
April 15, 2025
Bitcoin’s
price (BTC) as of today (Wednesday), April 16, 2025, hovers around $85,962,
recovering from a dip below $80,000 last week. The crypto community is abuzz
over a bold prediction from analyst Titan of Crypto: Bitcoin could surge to
$137,000 by Q3 2025, driven by massive liquidity injections from the U.S.
Treasury.
In this guide,
we’ll unpack Titan of Crypto’s bullish outlook, explore the forces lifting
crypto in 2025, and answer the most important questions. How high can Bitcoin
go? What’s fueling this rally? And how should retail investors position
themselves?
During
Tuesday’s session, Bitcoin’s price is up about 1.3%, reaching an intraday high
of $86,000, one of the highest levels in April.
As a
result, Bitcoin’s total market capitalization rises to over $1.7 trillion, with
a 24-hour trading volume of $28.7 billion.
However,
one analyst on X (formerly Twitter) claims Bitcoin’s price could soon be much
higher.
Why Will Bitcoin Soar?
Titan of Crypto’s $137,000 BTC Prediction
Titan of
Crypto’s forecast, shared in an April 13, 2025, X post, is grounded in
technical and macroeconomic analysis. The analyst predicts Bitcoin could hit
$137,000 by July–August 2025, citing a bullish pennant pattern and U.S.
Treasury liquidity injections.
“Bitcoin
$137,000 in the Cards? BTC has formed a bull pennant on the daily chart. If it
plays out, a new ATH could be reached,” Titan of Crypto wrote.
#Bitcoin $137,000 in the Cards? ????#BTC has formed a bull pennant on the daily chart.
If it plays out, a new ATH could be reached — right against current market sentiment.Let’s see if price can break to the upside in the coming week! pic.twitter.com/Irr01KLvSE
— Titan of Crypto (@Washigorira)
Here’s
why this prediction is gaining traction:
- Liquidity Surge: Macroeconomic analyst “Tomas
on Markets” highlights the U.S. Treasury’s injection of $500 billion into
markets since February 2025, drawing down its Treasury General Account
(TGA) from $842 billion to $342 billion. This boosts net Federal Reserve
liquidity to $6.3 trillion, with projections of $6.6 trillion by August if
debt ceiling talks extend. “This liquidity surge could lift speculative
assets like Bitcoin,” Tomas commented on X.
???? Fed liquidity is rising
Net Federal Reserve Liquidity has increased by around $500bn since February.
It’s not really having any positive impact on risk asset prices with everything else going on.
But it is happening.
Here’s what is occurring and what to expect next…… https://t.co/VZJgGnDySS pic.twitter.com/IIsDJBuABq
— Tomas (@TomasOnMarkets)
- Historical Correlation: Financial analyst Lyn Alden’s
research shows Bitcoin moves in line with global liquidity 83% of the time
over 12 months, outperforming assets like the S&P 500 and gold. Past
TGA drawdowns in 2022 and 2023 fueled BTC rallies, and a projected $600 billion
boost by Q3 2025 could do the same. - Technical Breakout: Titan of Crypto’s chart
analysis identifies a bullish pennant on Bitcoin’s daily chart, signaling
a potential breakout. If BTC clears resistance at the 200-day exponential
moving average (EMA) near $90,000, it could target $137,000, a 60% jump
from current levels. - Market Resilience: Despite tariff concerns,
apparent exemptions have eased U.S. Treasury yields, reducing pressure on
risk assets.
Why Is Bitcoin Going Up in
2025? Liquidity, ETFs, and More
Bitcoin’s
rally isn’t just hype—it’s driven by a confluence of macroeconomic and
crypto-specific factors. Here’s a breakdown of the forces propelling BTC, with
insights for retail investors:
U.S. Treasury Liquidity
Injections
The
Treasury’s TGA drawdown is a game-changer. By releasing $500 billion since
February, the government has flooded markets with cash, boosting liquidity to
$6.3 trillion.
“The TGA
balance dropping to $342 billion means more cash in the system,” Tomas
explained. With another $600 billion expected by Q3, Bitcoin—historically tied
to liquidity—could see a massive tailwind. Retail investors should note that
past drawdowns in 2022 and 2023 sparked BTC rallies of 50%+.
ETF Inflows and
Institutional Adoption
Bitcoin
ETFs are a major driver. Self-directed retail investors account for 80% of ETF
flows, while institutions like MicroStrategy continue stockpiling BTC.
“Expected
ETF inflows of $70B+ in 2025 could push Bitcoin to $200,000,” Bernstein
analysts predicted. For retail investors, ETFs offer a low-risk way to gain
exposure without holding BTC directly.
Post-Halving Supply Shock
The April
2024 halving cut mining rewards to 3.125 BTC, tightening supply. Historically,
halvings precede bull runs (e.g., 2020’s 600% surge).
Tariff Exemptions and
Easing Yields
Trump’s
tariffs sparked fears of a risk-off market, but recent exemptions have calmed
nerves. Lower U.S. Treasury yields reduce pressure on speculative assets,
giving Bitcoin room to climb.
Bullish Market Sentiment
Crypto’s
resilience is evident in order books. “On Binance, buy-side liquidity for
BTC/USDT is 10x higher than sell-side,” noted Dr Kirill Kretov,
Senior Automation Expert at CoinPanel. Large players are moving
BTC to cold storage, signaling confidence.
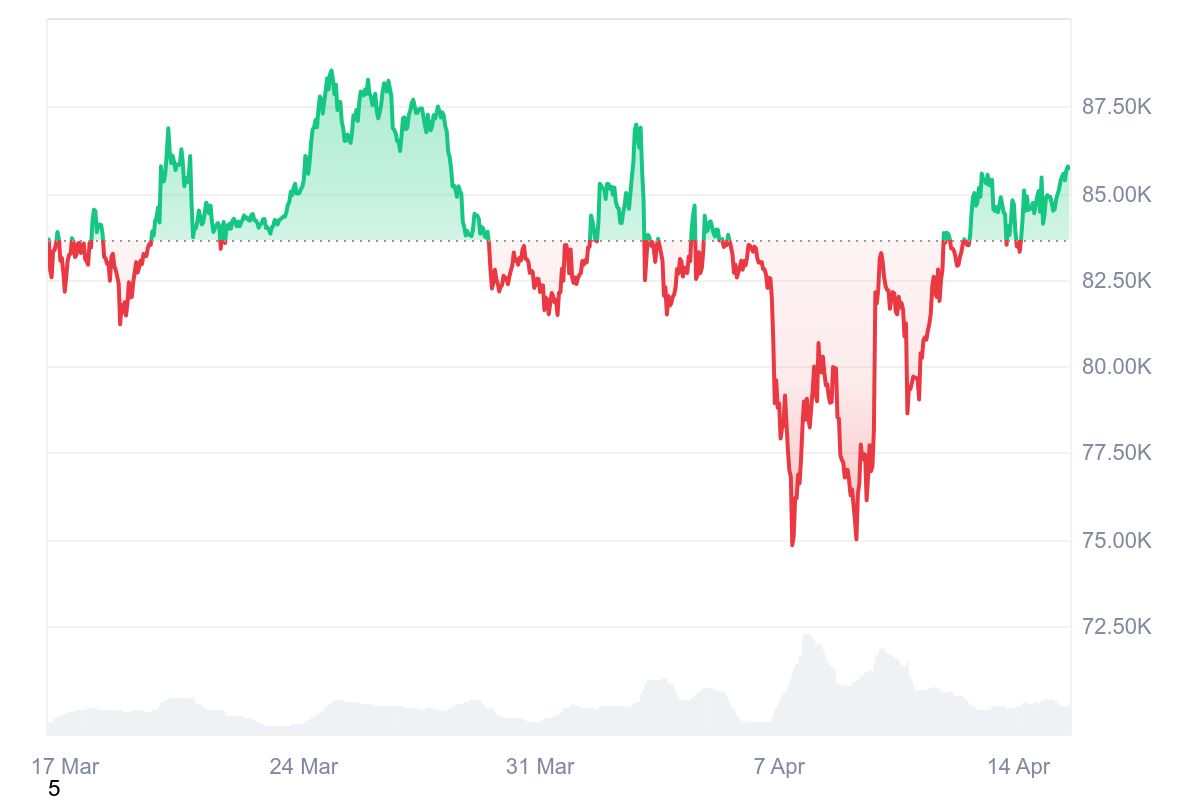
How High Can Bitcoin Go? Bitcoin
Price Chart Technical Analysis
Based on my
technical analysis, Bitcoin has been stuck in a deadlock since late February.
Neither buyers nor sellers can decide which direction to take, and two key
moving averages have converged.
I’m
referring to the 50-day exponential moving average (50 EMA), marked in red, and
the 200-day EMA, marked in blue. The price is currently trading at their level,
indicating the market has reached a balance within a consolidation range
between resistance at $87,400 (local highs from March) and support at $78,000
(lows from last month and late February).

If
Bitcoin’s price breaks above the yellow-highlighted sideways channel, it faces
significant resistance in the $90,000–$92,000 zone, defined by lows from
November to February. Only a move above this level would make me bullish on the
BTC/USD chart again. The resistances I currently identify are:
- $87,400
– upper consolidation boundary - $90,000–$92,000 – resistance
zone from late 2024/early 2025 lows - $100,000
– psychological level - $102,300 – local highs tested
in December and early January - $108,000 – all-time high from
December 2024, which also capped gains in January 2025
If Bitcoin
breaks below the current consolidation, the first support lies at $74,500.
Personally, I wouldn’t expect a sharper decline beyond the $66,000–$68,000
zone, where October 2024 lows are located. The main support levels are:
- $78,000
– lower consolidation boundary - $74,500
– April lows - $72,000 – highs from May and
June 2024 - $68,000
– highs tested in July 2024 - $66,000 – October 2024 lows,
after which the rally to new all-time highs began in 2025
Bitcoin price support and
resistance zones table
|
Support Levels |
Description |
Resistance Levels |
Description |
|
$78,000 |
Lower |
$87,400 |
Upper |
|
$74,500 |
April |
$90,000–$92,000 |
Resistance |
|
$72,000 |
Highs |
$100,000 |
Psychological |
|
$68,000 |
Highs |
$102,300 |
Local |
|
$66,000 |
October |
$108,000 |
All-time |
Why Bitcoin Might Stall?
Not
everyone is all-in on the $137,000 call. Bearish risks include:
- Debt Ceiling Deadlock: If Congress resolves the debt
ceiling early, TGA drawdowns could slow, capping liquidity at $6.3
trillion. “No liquidity, no rally,” Tomas warned. - Tariff Risks: While exemptions help,
renewed trade wars could spike yields and crush risk assets. - Technical Resistance: Failing to break the 200-day
EMA for long could trap BTC below $85,000, delaying the rally.
“Prediction that Bitcoin breaking through $137,000 by late summer may be overlooking critical dynamics playing out beneath the surface,” thinks Kretov. “We are in a period of extreme uncertainty with escalating geopolitical tensions, global economic fragility, and a pervasive risk-off sentiment. Gold, not Bitcoin, has resumed its role as a safe-haven asset in this climate.”
You may also like: How Low Can Bitcoin Go? This Expert Predicts BTC Price Drop to $10,000
Still,
bulls dominate. The April 2024 halving, ETF momentum, and liquidity injections
create a strong case. Below is a table of bullish Bitcoin price predictions for
2025:
Bitcoin Price Prediction 2025 Table
|
Source |
2025 Price Prediction |
Key Drivers |
|
Titan of Crypto |
$137,000 |
TGA |
|
Bernstein |
$200,000 |
ETF |
|
$200,000–$250,000 |
U.S. |
|
|
Bitfinex |
$145,000–$200,000 |
Historical |
|
H.C. Wainwright & Co. |
$225,000 |
Spot ETF |
These
forecasts hinge on liquidity, regulatory clarity, and Bitcoin’s scarcity. While
bears see tariff and macro risks, bulls argue 2025’s unique catalysts could
push BTC to new highs.
“We are likely to
continue seeing dramatic but meaningless moves, 10% drops overnight and 15%
rebounds over weekends. It’s all noise. The market lacks conviction, and high
emotional sensitivity fuels volatility,” adds Kretov. “Even traditional markets are behaving like memecoins. In that context, why expect Bitcoin to be any different?”
Bitcoin Price Prediction,
FAQ
How High Will Bitcoin
Climb?
Titan of
Crypto’s $137,000 call—a 60% jump from $85,838—rests on liquidity and
technicals. “If it plays out, a new ATH could be reached,” the analyst said.
Historically, BTC rallies 50%–600% post-halving, so $137,000 is plausible,
though $100K–$120K is a safer bet for Q2.
How Much Will 1 Bitcoin Be
Worth in 2025?
Predictions
range from $137,000 (Titan of Crypto) to $250,000 (Standard Chartered).
“Putting price and time together is tough,” Tomas noted. Liquidity, ETFs, and
halving effects favor bulls, but tariff risks could cap gains—expect swings.
What If I Bought $1 of
Bitcoin 10 Years Ago?
In April
2015, BTC averaged $250. A $1 investment bought 0.004 BTC. At $85,838, that’s
$343—a 343x return. If BTC hits $137,000, your $1 becomes $548, outpacing most
assets. Even at $100,000, it’s $400, showcasing BTC’s long-term potential.
Is It Worth Having $100 in
Bitcoin?
Yes, for
risk-tolerant investors. At $85,838, $100 buys 0.001165 BTC. If BTC hits
$137,000, that’s $159; at $200,000, it’s $233. “There’s going to be decent
volatility, a lot of trading opportunities,” Kretov said. $100 is a low-stakes
entry, but brace for dips.
Should I Buy Bitcoin Now?
Tes, but Titan
of Crypto’s view isn’t guaranteed. “Let’s see if price can break to the
upside,” they cautioned. If you’re long-term focused, buying on dips near
$80,000–$82,000 could pay off, given historical rebounds (e.g., 2023’s 150%
surge).
Is Bitcoin Still “Digital
Gold”?
“Bitcoin
moves with global liquidity,” Lyn Alden’s research shows, reinforcing its
speculative appeal. While gold shines in crises, BTC’s 21 million coin cap and
halving-driven scarcity make it a compelling hedge—monitor liquidity trends to
gauge its role.
Bitcoin’s
price (BTC) as of today (Wednesday), April 16, 2025, hovers around $85,962,
recovering from a dip below $80,000 last week. The crypto community is abuzz
over a bold prediction from analyst Titan of Crypto: Bitcoin could surge to
$137,000 by Q3 2025, driven by massive liquidity injections from the U.S.
Treasury.
In this guide,
we’ll unpack Titan of Crypto’s bullish outlook, explore the forces lifting
crypto in 2025, and answer the most important questions. How high can Bitcoin
go? What’s fueling this rally? And how should retail investors position
themselves?
During
Tuesday’s session, Bitcoin’s price is up about 1.3%, reaching an intraday high
of $86,000, one of the highest levels in April.
As a
result, Bitcoin’s total market capitalization rises to over $1.7 trillion, with
a 24-hour trading volume of $28.7 billion.
However,
one analyst on X (formerly Twitter) claims Bitcoin’s price could soon be much
higher.
Why Will Bitcoin Soar?
Titan of Crypto’s $137,000 BTC Prediction
Titan of
Crypto’s forecast, shared in an April 13, 2025, X post, is grounded in
technical and macroeconomic analysis. The analyst predicts Bitcoin could hit
$137,000 by July–August 2025, citing a bullish pennant pattern and U.S.
Treasury liquidity injections.
“Bitcoin
$137,000 in the Cards? BTC has formed a bull pennant on the daily chart. If it
plays out, a new ATH could be reached,” Titan of Crypto wrote.
#Bitcoin $137,000 in the Cards? ????#BTC has formed a bull pennant on the daily chart.
If it plays out, a new ATH could be reached — right against current market sentiment.Let’s see if price can break to the upside in the coming week! pic.twitter.com/Irr01KLvSE
— Titan of Crypto (@Washigorira)
Here’s
why this prediction is gaining traction:
- Liquidity Surge: Macroeconomic analyst “Tomas
on Markets” highlights the U.S. Treasury’s injection of $500 billion into
markets since February 2025, drawing down its Treasury General Account
(TGA) from $842 billion to $342 billion. This boosts net Federal Reserve
liquidity to $6.3 trillion, with projections of $6.6 trillion by August if
debt ceiling talks extend. “This liquidity surge could lift speculative
assets like Bitcoin,” Tomas commented on X.
???? Fed liquidity is rising
Net Federal Reserve Liquidity has increased by around $500bn since February.
It’s not really having any positive impact on risk asset prices with everything else going on.
But it is happening.
Here’s what is occurring and what to expect next…… https://t.co/VZJgGnDySS pic.twitter.com/IIsDJBuABq
— Tomas (@TomasOnMarkets)
- Historical Correlation: Financial analyst Lyn Alden’s
research shows Bitcoin moves in line with global liquidity 83% of the time
over 12 months, outperforming assets like the S&P 500 and gold. Past
TGA drawdowns in 2022 and 2023 fueled BTC rallies, and a projected $600 billion
boost by Q3 2025 could do the same. - Technical Breakout: Titan of Crypto’s chart
analysis identifies a bullish pennant on Bitcoin’s daily chart, signaling
a potential breakout. If BTC clears resistance at the 200-day exponential
moving average (EMA) near $90,000, it could target $137,000, a 60% jump
from current levels. - Market Resilience: Despite tariff concerns,
apparent exemptions have eased U.S. Treasury yields, reducing pressure on
risk assets.
Why Is Bitcoin Going Up in
2025? Liquidity, ETFs, and More
Bitcoin’s
rally isn’t just hype—it’s driven by a confluence of macroeconomic and
crypto-specific factors. Here’s a breakdown of the forces propelling BTC, with
insights for retail investors:
U.S. Treasury Liquidity
Injections
The
Treasury’s TGA drawdown is a game-changer. By releasing $500 billion since
February, the government has flooded markets with cash, boosting liquidity to
$6.3 trillion.
“The TGA
balance dropping to $342 billion means more cash in the system,” Tomas
explained. With another $600 billion expected by Q3, Bitcoin—historically tied
to liquidity—could see a massive tailwind. Retail investors should note that
past drawdowns in 2022 and 2023 sparked BTC rallies of 50%+.
ETF Inflows and
Institutional Adoption
Bitcoin
ETFs are a major driver. Self-directed retail investors account for 80% of ETF
flows, while institutions like MicroStrategy continue stockpiling BTC.
“Expected
ETF inflows of $70B+ in 2025 could push Bitcoin to $200,000,” Bernstein
analysts predicted. For retail investors, ETFs offer a low-risk way to gain
exposure without holding BTC directly.
Post-Halving Supply Shock
The April
2024 halving cut mining rewards to 3.125 BTC, tightening supply. Historically,
halvings precede bull runs (e.g., 2020’s 600% surge).
Tariff Exemptions and
Easing Yields
Trump’s
tariffs sparked fears of a risk-off market, but recent exemptions have calmed
nerves. Lower U.S. Treasury yields reduce pressure on speculative assets,
giving Bitcoin room to climb.
Bullish Market Sentiment
Crypto’s
resilience is evident in order books. “On Binance, buy-side liquidity for
BTC/USDT is 10x higher than sell-side,” noted Dr Kirill Kretov,
Senior Automation Expert at CoinPanel. Large players are moving
BTC to cold storage, signaling confidence.
How High Can Bitcoin Go? Bitcoin
Price Chart Technical Analysis
Based on my
technical analysis, Bitcoin has been stuck in a deadlock since late February.
Neither buyers nor sellers can decide which direction to take, and two key
moving averages have converged.
I’m
referring to the 50-day exponential moving average (50 EMA), marked in red, and
the 200-day EMA, marked in blue. The price is currently trading at their level,
indicating the market has reached a balance within a consolidation range
between resistance at $87,400 (local highs from March) and support at $78,000
(lows from last month and late February).
If
Bitcoin’s price breaks above the yellow-highlighted sideways channel, it faces
significant resistance in the $90,000–$92,000 zone, defined by lows from
November to February. Only a move above this level would make me bullish on the
BTC/USD chart again. The resistances I currently identify are:
- $87,400
– upper consolidation boundary - $90,000–$92,000 – resistance
zone from late 2024/early 2025 lows - $100,000
– psychological level - $102,300 – local highs tested
in December and early January - $108,000 – all-time high from
December 2024, which also capped gains in January 2025
If Bitcoin
breaks below the current consolidation, the first support lies at $74,500.
Personally, I wouldn’t expect a sharper decline beyond the $66,000–$68,000
zone, where October 2024 lows are located. The main support levels are:
- $78,000
– lower consolidation boundary - $74,500
– April lows - $72,000 – highs from May and
June 2024 - $68,000
– highs tested in July 2024 - $66,000 – October 2024 lows,
after which the rally to new all-time highs began in 2025
Bitcoin price support and
resistance zones table
|
Support Levels |
Description |
Resistance Levels |
Description |
|
$78,000 |
Lower |
$87,400 |
Upper |
|
$74,500 |
April |
$90,000–$92,000 |
Resistance |
|
$72,000 |
Highs |
$100,000 |
Psychological |
|
$68,000 |
Highs |
$102,300 |
Local |
|
$66,000 |
October |
$108,000 |
All-time |
Why Bitcoin Might Stall?
Not
everyone is all-in on the $137,000 call. Bearish risks include:
- Debt Ceiling Deadlock: If Congress resolves the debt
ceiling early, TGA drawdowns could slow, capping liquidity at $6.3
trillion. “No liquidity, no rally,” Tomas warned. - Tariff Risks: While exemptions help,
renewed trade wars could spike yields and crush risk assets. - Technical Resistance: Failing to break the 200-day
EMA for long could trap BTC below $85,000, delaying the rally.
“Prediction that Bitcoin breaking through $137,000 by late summer may be overlooking critical dynamics playing out beneath the surface,” thinks Kretov. “We are in a period of extreme uncertainty with escalating geopolitical tensions, global economic fragility, and a pervasive risk-off sentiment. Gold, not Bitcoin, has resumed its role as a safe-haven asset in this climate.”
You may also like: How Low Can Bitcoin Go? This Expert Predicts BTC Price Drop to $10,000
Still,
bulls dominate. The April 2024 halving, ETF momentum, and liquidity injections
create a strong case. Below is a table of bullish Bitcoin price predictions for
2025:
Bitcoin Price Prediction 2025 Table
|
Source |
2025 Price Prediction |
Key Drivers |
|
Titan of Crypto |
$137,000 |
TGA |
|
Bernstein |
$200,000 |
ETF |
|
$200,000–$250,000 |
U.S. |
|
|
Bitfinex |
$145,000–$200,000 |
Historical |
|
H.C. Wainwright & Co. |
$225,000 |
Spot ETF |
These
forecasts hinge on liquidity, regulatory clarity, and Bitcoin’s scarcity. While
bears see tariff and macro risks, bulls argue 2025’s unique catalysts could
push BTC to new highs.
“We are likely to
continue seeing dramatic but meaningless moves, 10% drops overnight and 15%
rebounds over weekends. It’s all noise. The market lacks conviction, and high
emotional sensitivity fuels volatility,” adds Kretov. “Even traditional markets are behaving like memecoins. In that context, why expect Bitcoin to be any different?”
Bitcoin Price Prediction,
FAQ
How High Will Bitcoin
Climb?
Titan of
Crypto’s $137,000 call—a 60% jump from $85,838—rests on liquidity and
technicals. “If it plays out, a new ATH could be reached,” the analyst said.
Historically, BTC rallies 50%–600% post-halving, so $137,000 is plausible,
though $100K–$120K is a safer bet for Q2.
How Much Will 1 Bitcoin Be
Worth in 2025?
Predictions
range from $137,000 (Titan of Crypto) to $250,000 (Standard Chartered).
“Putting price and time together is tough,” Tomas noted. Liquidity, ETFs, and
halving effects favor bulls, but tariff risks could cap gains—expect swings.
What If I Bought $1 of
Bitcoin 10 Years Ago?
In April
2015, BTC averaged $250. A $1 investment bought 0.004 BTC. At $85,838, that’s
$343—a 343x return. If BTC hits $137,000, your $1 becomes $548, outpacing most
assets. Even at $100,000, it’s $400, showcasing BTC’s long-term potential.
Is It Worth Having $100 in
Bitcoin?
Yes, for
risk-tolerant investors. At $85,838, $100 buys 0.001165 BTC. If BTC hits
$137,000, that’s $159; at $200,000, it’s $233. “There’s going to be decent
volatility, a lot of trading opportunities,” Kretov said. $100 is a low-stakes
entry, but brace for dips.
Should I Buy Bitcoin Now?
Tes, but Titan
of Crypto’s view isn’t guaranteed. “Let’s see if price can break to the
upside,” they cautioned. If you’re long-term focused, buying on dips near
$80,000–$82,000 could pay off, given historical rebounds (e.g., 2023’s 150%
surge).
Is Bitcoin Still “Digital
Gold”?
“Bitcoin
moves with global liquidity,” Lyn Alden’s research shows, reinforcing its
speculative appeal. While gold shines in crises, BTC’s 21 million coin cap and
halving-driven scarcity make it a compelling hedge—monitor liquidity trends to
gauge its role.
Search
RECENT PRESS RELEASES
Amazon Freight Partners: Building trucking companies without buying tractors
SWI Editorial Staff2025-12-16T17:30:41-08:00December 16, 2025|
President Trump says he’s considering an executive order to reclassify marijuana
SWI Editorial Staff2025-12-16T17:29:52-08:00December 16, 2025|
Trump expected to sign an order moving to reclassify cannabis and open up medical potentia
SWI Editorial Staff2025-12-16T17:29:31-08:00December 16, 2025|
How marijuana reclassification could reshape Arizona’s cannabis industry
SWI Editorial Staff2025-12-16T17:29:06-08:00December 16, 2025|
Johnson City Press | News
SWI Editorial Staff2025-12-16T17:28:35-08:00December 16, 2025|
The Arctic’s annual physical finds an environment that’s breaking down
SWI Editorial Staff2025-12-16T17:28:13-08:00December 16, 2025|
Related Post


