How High Oil Prices Could Accelerate the Green Energy Transition
April 26, 2026
Apr 27, 2026
While Wall Street remains preoccupied with Middle East geopolitical tensions and their effect on volatile oil prices, a closer examination suggests that high crude costs may not hinder the green energy transition and could even accelerate it. According to a recent analysis from Yahoo Finance, the clean energy sector offers distinct opportunities for different types of investors.
Bloom Energy Shows Rapid Growth
Bloom Energy has seen its stock price surge more than tenfold over the past twelve months, making it suitable only for aggressive growth investors. The company’s fuel cells are experiencing strong demand, with revenues increasing 37% in 2025. Its total backlog stands at $20 billion, of which only $6 billion is tied to product sales; the remainder relates to services for existing fuel cell owners. This large services backlog points to several years of stable revenue. A key advantage of Bloom Energy’s technology is enabling on-site power generation when grid connections are unavailable or providing backup power for facilities such as data centers that cannot tolerate downtime. The company recently signed an agreement with Oracle for up to 2.8 gigawatts of fuel cells to support the tech giant’s data center investments.
Brookfield Renewable Offers Broad Exposure
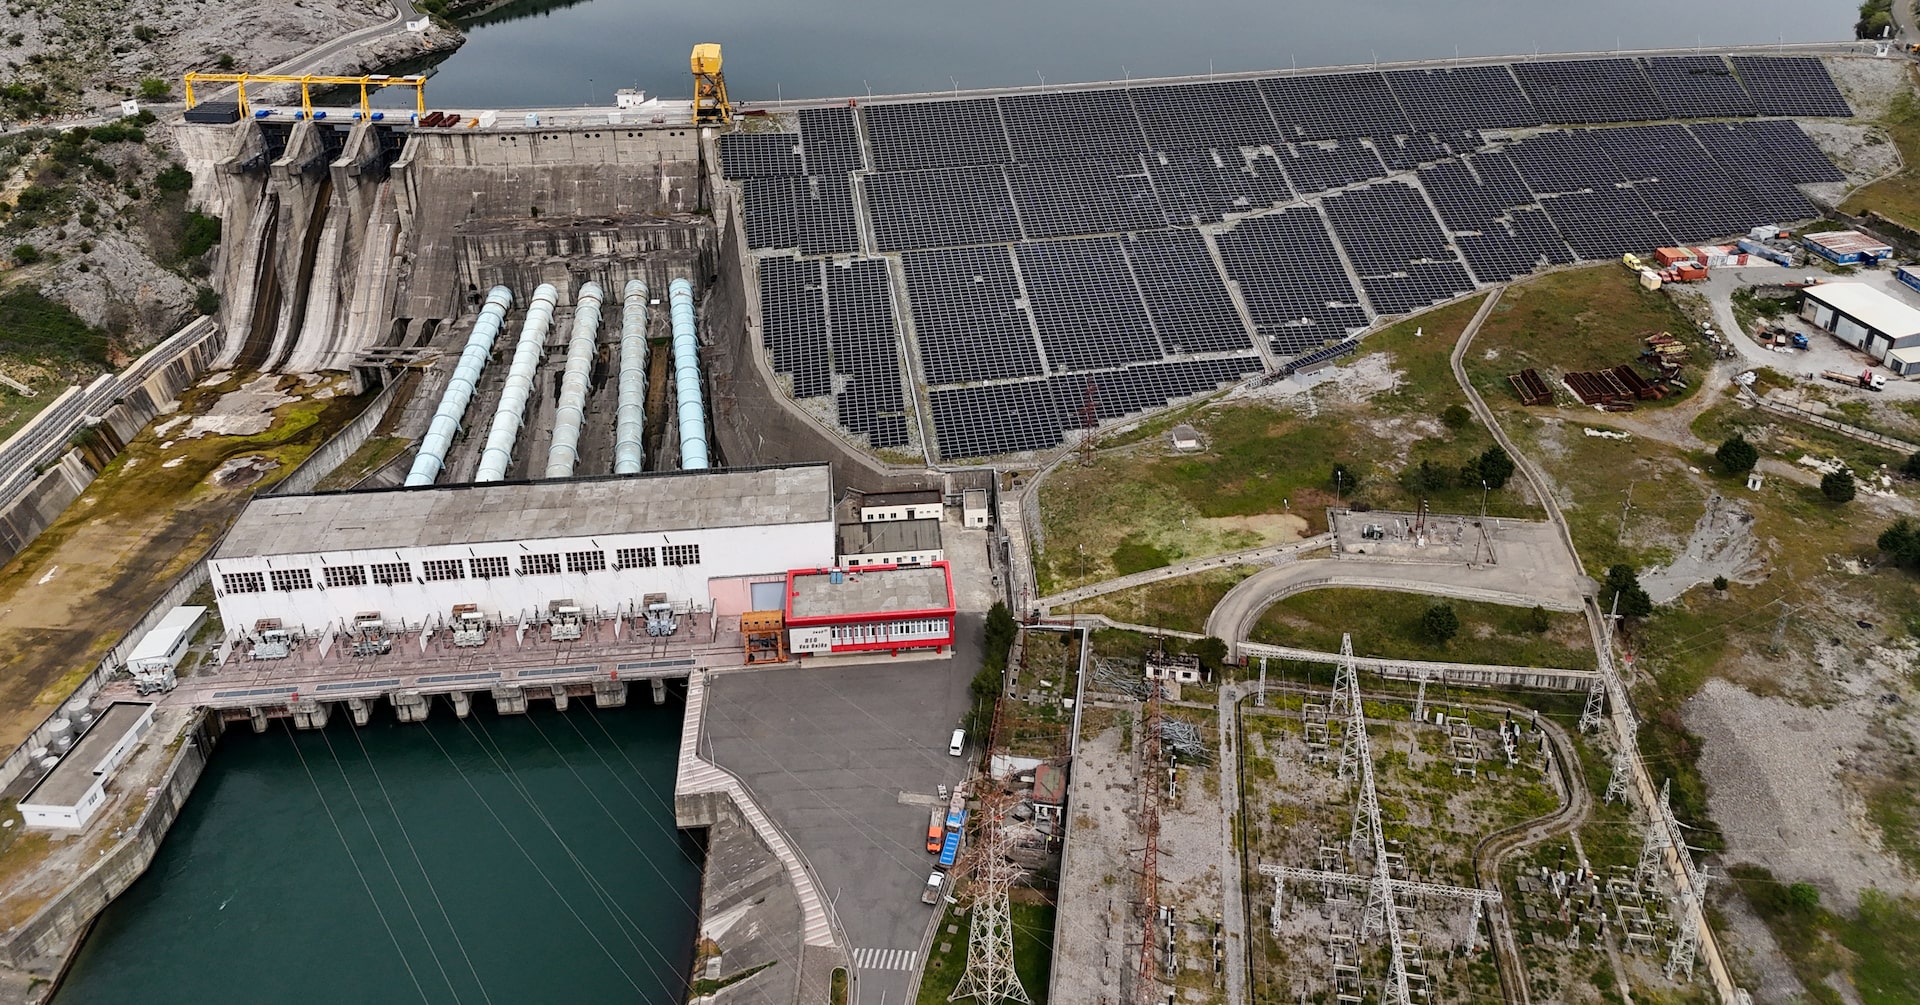
Brookfield Renewable manages a globally diversified portfolio of clean energy assets spanning hydroelectric, solar, wind, and nuclear power, along with battery storage. The firm actively buys, builds, and sells assets and has established partnerships with major technology companies including Google and Microsoft to supply them with clean energy.
NextEra Energy Suits Conservative Investors
NextEra Energy is described as a strong option for conservative investors who prefer a more cautious entry into the clean energy space.
-
1. INTRODUCTION
Making Data-Driven Decisions to Grow Your Business
- REPORT DESCRIPTION
- RESEARCH METHODOLOGY AND THE AI PLATFORM
- DATA-DRIVEN DECISIONS FOR YOUR BUSINESS
- GLOSSARY AND SPECIFIC TERMS
-
2. EXECUTIVE SUMMARY
A Quick Overview of Market Performance
- KEY FINDINGS
- MARKET TRENDS This Chapter is Available Only for the Professional EditionPRO
-
3. MARKET OVERVIEW
Understanding the Current State of The Market and its Prospects
- MARKET SIZE: HISTORICAL DATA (2012–2025) AND FORECAST (2026–2035)
- CONSUMPTION BY COUNTRY: HISTORICAL DATA (2012–2025) AND FORECAST (2026–2035)
- MARKET FORECAST TO 2035
-
4. MOST PROMISING PRODUCTS FOR DIVERSIFICATION
Finding New Products to Diversify Your Business
- TOP PRODUCTS TO DIVERSIFY YOUR BUSINESS
- BEST-SELLING PRODUCTS
- MOST CONSUMED PRODUCTS
- MOST TRADED PRODUCTS
- MOST PROFITABLE PRODUCTS FOR EXPORT
-
5. MOST PROMISING SUPPLYING COUNTRIES
Choosing the Best Countries to Establish Your Sustainable Supply Chain
- TOP COUNTRIES TO SOURCE YOUR PRODUCT
- TOP PRODUCING COUNTRIES
- TOP EXPORTING COUNTRIES
- LOW-COST EXPORTING COUNTRIES
-
6. MOST PROMISING OVERSEAS MARKETS
Choosing the Best Countries to Boost Your Export
- TOP OVERSEAS MARKETS FOR EXPORTING YOUR PRODUCT
- TOP CONSUMING MARKETS
- UNSATURATED MARKETS
- TOP IMPORTING MARKETS
- MOST PROFITABLE MARKETS
-
7. PRODUCTION
The Latest Trends and Insights into The Industry
- PRODUCTION VOLUME AND VALUE: HISTORICAL DATA (2012–2025) AND FORECAST (2026–2035)
- PRODUCTION BY COUNTRY: HISTORICAL DATA (2012–2025) AND FORECAST (2026–2035)
-
8. IMPORTS
The Largest Import Supplying Countries
- IMPORTS: HISTORICAL DATA (2012–2025) AND FORECAST (2026–2035)
- IMPORTS BY COUNTRY: HISTORICAL DATA (2012–2025) AND FORECAST (2026–2035)
- IMPORT PRICES BY COUNTRY: HISTORICAL DATA (2012–2025) AND FORECAST (2026–2035)
-
9. EXPORTS
The Largest Destinations for Exports
- EXPORTS: HISTORICAL DATA (2012–2025) AND FORECAST (2026–2035)
- EXPORTS BY COUNTRY: HISTORICAL DATA (2012–2025) AND FORECAST (2026–2035)
- EXPORT PRICES BY COUNTRY: HISTORICAL DATA (2012–2025) AND FORECAST (2026–2035)
-
10. PROFILES OF MAJOR PRODUCERS
The Largest Producers on The Market and Their Profiles
-
11. COUNTRY PROFILES
The Largest Markets And Their Profiles
This Chapter is Available Only for the Professional Edition
PRO-
11.1
United States
- Market Size
- Production
- Imports
- Exports
-
11.2
China
- Market Size
- Production
- Imports
- Exports
-
11.3
Japan
- Market Size
- Production
- Imports
- Exports
-
11.4
Germany
- Market Size
- Production
- Imports
- Exports
-
11.5
United Kingdom
- Market Size
- Production
- Imports
- Exports
-
11.6
France
- Market Size
- Production
- Imports
- Exports
-
11.7
Brazil
- Market Size
- Production
- Imports
- Exports
-
11.8
Italy
- Market Size
- Production
- Imports
- Exports
-
11.9
Russian Federation
- Market Size
- Production
- Imports
- Exports
-
11.10
India
- Market Size
- Production
- Imports
- Exports
-
11.11
Canada
- Market Size
- Production
- Imports
- Exports
-
11.12
Australia
- Market Size
- Production
- Imports
- Exports
-
11.13
Republic of Korea
- Market Size
- Production
- Imports
- Exports
-
11.14
Spain
- Market Size
- Production
- Imports
- Exports
-
11.15
Mexico
- Market Size
- Production
- Imports
- Exports
-
11.16
Indonesia
- Market Size
- Production
- Imports
- Exports
-
11.17
Netherlands
- Market Size
- Production
- Imports
- Exports
-
11.18
Turkey
- Market Size
- Production
- Imports
- Exports
-
11.19
Saudi Arabia
- Market Size
- Production
- Imports
- Exports
-
11.20
Switzerland
- Market Size
- Production
- Imports
- Exports
-
11.21
Sweden
- Market Size
- Production
- Imports
- Exports
-
11.22
Nigeria
- Market Size
- Production
- Imports
- Exports
-
11.23
Poland
- Market Size
- Production
- Imports
- Exports
-
11.24
Belgium
- Market Size
- Production
- Imports
- Exports
-
11.25
Argentina
- Market Size
- Production
- Imports
- Exports
-
11.26
Norway
- Market Size
- Production
- Imports
- Exports
-
11.27
Austria
- Market Size
- Production
- Imports
- Exports
-
11.28
Thailand
- Market Size
- Production
- Imports
- Exports
-
11.29
United Arab Emirates
- Market Size
- Production
- Imports
- Exports
-
11.30
Colombia
- Market Size
- Production
- Imports
- Exports
-
11.31
Denmark
- Market Size
- Production
- Imports
- Exports
-
11.32
South Africa
- Market Size
- Production
- Imports
- Exports
-
11.33
Malaysia
- Market Size
- Production
- Imports
- Exports
-
11.34
Israel
- Market Size
- Production
- Imports
- Exports
-
11.35
Singapore
- Market Size
- Production
- Imports
- Exports
-
11.36
Egypt
- Market Size
- Production
- Imports
- Exports
-
11.37
Philippines
- Market Size
- Production
- Imports
- Exports
-
11.38
Finland
- Market Size
- Production
- Imports
- Exports
-
11.39
Chile
- Market Size
- Production
- Imports
- Exports
-
11.40
Ireland
- Market Size
- Production
- Imports
- Exports
-
11.41
Pakistan
- Market Size
- Production
- Imports
- Exports
-
11.42
Greece
- Market Size
- Production
- Imports
- Exports
-
11.43
Portugal
- Market Size
- Production
- Imports
- Exports
-
11.44
Kazakhstan
- Market Size
- Production
- Imports
- Exports
-
11.45
Algeria
- Market Size
- Production
- Imports
- Exports
-
11.46
Czech Republic
- Market Size
- Production
- Imports
- Exports
-
11.47
Qatar
- Market Size
- Production
- Imports
- Exports
-
11.48
Peru
- Market Size
- Production
- Imports
- Exports
-
11.49
Romania
- Market Size
- Production
- Imports
- Exports
-
11.50
Vietnam
- Market Size
- Production
- Imports
- Exports
-
-
LIST OF TABLES
- Key Findings In 2025
- Market Volume, In Physical Terms: Historical Data (2012–2025) and Forecast (2026–2035)
- Market Value: Historical Data (2012–2025) and Forecast (2026–2035)
- Per Capita Consumption, by Country, 2022–2025
- Production, In Physical Terms, By Country: Historical Data (2012–2025) and Forecast (2026–2035)
- Imports, In Physical Terms, By Country: Historical Data (2012–2025) and Forecast (2026–2035)
- Imports, In Value Terms, By Country: Historical Data (2012–2025) and Forecast (2026–2035)
- Import Prices, By Country: Historical Data (2012–2025) and Forecast (2026–2035)
- Exports, In Physical Terms, By Country: Historical Data (2012–2025) and Forecast (2026–2035)
- Exports, In Value Terms, By Country: Historical Data (2012–2025) and Forecast (2026–2035)
- Export Prices, By Country: Historical Data (2012–2025) and Forecast (2026–2035)
-
LIST OF FIGURES
- Market Volume, In Physical Terms: Historical Data (2012–2025) and Forecast (2026–2035)
- Market Value: Historical Data (2012–2025) and Forecast (2026–2035)
- Consumption, by Country, 2025
- Market Volume Forecast to 2035
- Market Value Forecast to 2035
- Market Size and Growth, By Product
- Average Per Capita Consumption, By Product
- Exports and Growth, By Product
- Export Prices and Growth, By Product
- Production Volume and Growth
- Exports and Growth
- Export Prices and Growth
- Market Size and Growth
- Per Capita Consumption
- Imports and Growth
- Import Prices
- Production, In Physical Terms: Historical Data (2012–2025) and Forecast (2026–2035)
- Production, In Value Terms: Historical Data (2012–2025) and Forecast (2026–2035)
- Production, by Country, 2025
- Production, In Physical Terms, by Country: Historical Data (2012–2025) and Forecast (2026–2035)
- Imports, In Physical Terms: Historical Data (2012–2025) and Forecast (2026–2035)
- Imports, In Value Terms: Historical Data (2012–2025) and Forecast (2026–2035)
- Imports, In Physical Terms, By Country, 2025
- Imports, In Physical Terms, By Country: Historical Data (2012–2025) and Forecast (2026–2035)
- Imports, In Value Terms, By Country: Historical Data (2012–2025) and Forecast (2026–2035)
- Import Prices, By Country: Historical Data (2012–2025) and Forecast (2026–2035)
- Exports, In Physical Terms: Historical Data (2012–2025) and Forecast (2026–2035)
- Exports, In Value Terms: Historical Data (2012–2025) and Forecast (2026–2035)
- Exports, In Physical Terms, By Country, 2025
- Exports, In Physical Terms, By Country: Historical Data (2012–2025) and Forecast (2026–2035)
- Exports, In Value Terms, By Country: Historical Data (2012–2025) and Forecast (2026–2035)
- Export Prices, By Country: Historical Data (2012–2025) and Forecast (2026–2035)
Search
RECENT PRESS RELEASES
Related Post


