Improvement of engineering properties and environmental impact of fired clay bricks utilizing industry sludge waste
February 9, 2025
Abstract
The increasing generation of industrial waste sludge poses a serious worldwide problem with detrimental effects on the environment and the economy. Effective utilization of waste sludge in sustainable construction practices offers a universal solution to mitigate environmental impacts. As the mining industry continues to extract clay from clay mines, the demand for sustainable practices in both clay mineral extraction and brick production is growing. Bricks are fundamental in masonry construction, and current research is exploring the integration of industrial waste materials into fired clay bricks to enhance their properties and mitigate environmental impacts. This study investigates the incorporation of waste sludge in brick manufacturing to assess its potential for reducing environmental burdens while maintaining technical performance. X-ray Fluorescence Spectrometry (XRF) analysis reveals that both clay soil and mosaic sludge contain high levels of silicon dioxide (SiO₂) and aluminum oxide (Al₂O₃), supporting their suitability as partial substitutes for clay soil. Incorporating up to 30% of body mill sludge (BS) and polishing sludge (PS) into the brick mix significantly enhances physical and mechanical properties, resulting in reduced shrinkage, increased porosity, and improved compressive strength, reaching up to 25 N/mm². Initial rate of suction tests shows values below 5 g/mm², indicating optimal water absorption characteristics. Various leachability assessments, including the Toxicity Characteristic Leaching Procedure (TCLP), Synthetic Precipitation Leaching Procedure (SPLP), and Static Leachate Test (SLT), confirm that bricks containing up to 30% BS and PS comply with United States Environmental Protection Agency (USEPA) and Environment Protection Authority Victoria (EPAV) standards for heavy metals, making them environmentally safe for use. Additionally, indoor air quality assessments confirm that these bricks meet Industry Codes of Practice on Indoor Air Quality (ICOP-IAQ) guidelines. This study demonstrates that using BS and PS as alternative raw materials offers a sustainable, cost-effective solution aligned with Sustainable Development Goals (SDGs), promoting cleaner production practices in brick manufacturing.
Introduction
Sludge is frequently associated with industrial waste that comes from urban areas. Yet, it can also originate from industrial and medical waste, wastewater processing plants, street drainage, farming zones, and occasionally from the leachate of landfills. Typically, sludge usually derived from residential regions is organic in nature1. Hence, this refuse inflicts lesser damage and has a reduced effect on the ecosystem in contrast to industrial byproducts. Conversely, industrial sediment may exist in either an organic or inorganic state2,3. The primary concern with industrial sludge is its inorganic constituents, particularly heavy metals, which need specialized treatment to avoid harming the environment.
In Malaysia, mosaic tiles are among the sectors responsible for generating sludge waste production. Approximately 66 mosaic industries are officially recorded with the Construction Industry Development Board Malaysia. According, Malaysian Mosaics Berhad (MMB), each factory generates about 5–8 tonnes of mosaics sludge daily for every mosaic batch they produce. The mosaic industry, classified as a non-metal sector, generates roughly 250 tonnes of waste per month, included concrete, mosaics, ceramics, and stone body waste4. Huge volume and toxicity of the wastes, mosaic sludge can cause significant harm to both landfills and the environment4.
According to Department of Environment (Malaysia Environmental Quality Report, 2012) claimed that Malaysia, in 2012, a total of 2,854,516.78 metric tonnes of scheduled wastes were generated, reflecting a 13.01% reduction compared to the 3,281,569.73 metric tonnes reported in 20115. The primary categories of waste included dross/slag/clinker/ash, gypsum, mineral sludge, oil and hydrocarbons, heavy metal sludge, and e-waste. Among the states, Terengganu contributed the largest share of scheduled waste (20.9%), followed by Johor (20.14%), Perak (14.23%), Selangor (12.87%), and Pulau Pinang (8.58%), while the remaining 10 states collectively accounted for 23.28% of the total waste generated. In Malaysia, approximately 1.6Â million metric tonnes of industrial sludge are generated annually, with 0.81Â million metric tonnes disposed of in sanitary landfills6.
In addition, the general public concern and the limited land resources will heighten the relevance of the industrial sludge disposal issues7. Furthermore, landfills are recognized as a significant contributor to adverse environmental effects in Malaysia8. Huge quantities of industrial sludge have piled up, and there is a pressing need for alternative disposal techniques since landfills are no longer a suitable solution for such waste.
Currently, Malaysia faces problems in finding adequate disposal sites9, even though having over 165 active sites and 131 that have been decommissioned (PPSPPA, 2014). Landfills are largely utilized open dumps10.
Moreover, the sludge from the mosaic industry is rich in heavy metals such as Copper (Cu), Zinc (Zn), Iron (Fe), and Chromium (Cr). These metals can pose risk to both human health and the surrounding environment11,12. High concentrations of heavy metals present significant risks to human health, potentially leading problems such as anemia, digestive disturbances, lung cancer, bone conditions like osteoporosis, damage to the nervous system, and harm to the liver and kidneys13.
The reuse of textile mill sludge in fired clay bricks. The textile mill sludge was mixed in different proportions (5–35%) as a raw material in this study. The brick was fired at 600ºC to 800ºC and for 8, 16 and 24 h. Based on the results, textile sludge can be added up to 15% as it gives a compressive strength above 3.5 MPa and the water absorption ratio is also less than 20%14.
The author investigated the brick durability of cast brick with industrial sludge. The results showed that the earth brick can be replaced with sludge up to 40% by weight with satisfactory value in strength. The compressive strength of brick without sludge and 5% sludge were 11.7Â MPa and 17.6Â MPa respectively. The compressive strength decreased with addition of sludge beyond 5% from 17.6Â MPa to 10.5Â MPa. For water absorption, when the sludge added was more than 10% by weight, the water absorption gradually increases. In this study, the addition of sludge into brick gave dual benefits of safe disposal of sludge and also conservation of brick making15.
The author incorporation of water treatment sludge and Rice Husk Ash (RHA) in clay bricks. In this study 25%, 50% and 75% by weight of water treatment sludge were added to produce clay bricks. Each brick series was fired at 900ºC to 1200ºC. The compressive strength of brick value was 5.7 MPa to 6.8 MPa for the control brick and 2.82 MPa to 7.84 MPa for the Sludge-RHA brick. Meanwhile, for the water absorption test, the results were 9.94–11.18% of control brick and 17.41–73.33% for sludge-RHA brick respectively. From the obtained results, it was concluded that under the common temperature used in brick kilns, 75% addition was the optimum sludge to produce the bricks16.
The incorporation of three sludge percentages which are 6%, 8% and 10% shows that the compressive strength decreased to 20.22% but at the same time the flexural strength increased. The compressive strength of 10% of sewage sludge was 21.8Â MPa whereas the flexural strength was 4.6Â MPa. Autoclaved sludge fly ash was incorporated in brick when a pH of 6.9 was obtained which is close to normal pH. The heavy metals were solidified during the curing process so that they will not pollute the environment17.
The author used 5%, 10%, 15%, 20%, 25% and 30% of sewage sludge incorporated into soft mud bricks with 12 specimens for each sludge percentage. From the results obtained there was no sign of alteration in colour or odour. Bricks with 35% sludge are very brittle and there are some dimensional reductions between 1Â mm and 7Â mm. Based on the result, the brick mass reduced significantly according to the percentage of sludge18.
According to the results demonstrated that the appropriate percentage of ash sludge to produce good quality bricks is in the range of 20–40% by weight with 13–15% optimum moisture content prepared in the moulded mixture. Firing was conducted at 1000ºC for six hours. Utilization of 10% of sludge ash in bricks exhibited higher compressive strength than normal bricks19.
The study examined clay bricks incorporating 10%, 20%, 30%, 40%, 50% and 60% stone sludge waste and fired them at 1050ºC. The compressive strength ranged from 2.11 MPa to 4.2 MPa, with the water absorption ratio between 8% and 12%. The optimal mix was 30% stone sludge, yielding the highest compressive strength of 4.2 MPa. This approach not only enhances brick properties but also addresses stone sludge disposal, a byproduct of the mining industry. By integrating stone sludge with clay minerals, this method promotes eco-friendly and sustainable construction practices20.
The author investigated clay bricks incorporating 2–16% industrial sludge, fired at temperatures up to 1050 °C. The compressive strength of these bricks ranged from 12 MPa to 31 MPa, demonstrating strong mechanical performance. The study highlighted the reuse of marine clay-industrial sludge mixtures as a viable solution for waste disposal and resource recovery, supporting sustainable construction practices21.
Recently, numerous researchers have been effectively incorporated different kinds of sludges into fired clay bricks. These sludges include those from marble, stone20, water treatment processes15,22, sewage23,24, and textile industry, mining industry14,25. The use of waste in clay brick manufacturing often enhances the properties of the bricks, resulting in lighter, better stronger, and have improved shrinkage, porosity, and thermal characteristics. Lighter bricks are more desirable as they can decrease transportation and handling expenses. Additionally, incorporating waste into bricks lowers the clay requirement, which can in turn lower production costs26.
Many experts have researched the inclusion of mosaic sludge into fired clay bricks. Using various sludges in this manner can improve the bricks characteristics and provide an environmentally responsible way to dispose of the waste. However, the majority of researchers in earlier studies mainly paid attention to the physical and mechanical characteristics. There has been insufficient research conducted on how using sludge waste in terms of its effects on the environment.
So, in this research, a study was conducted to find the appropriate proportions of mosaic sludge may effectively incorporated into fired clay bricks. This research examines physical and mechanical characteristics like compressive strength, shrinkage, density, and initial suction rate, along with the environmental effects concerning leachability and indoor air quality.
Experimental procedures
Stage I: raw material formulation
Preparation and collection of mosaic sludge and clay
Mosaic sludge was sourced from Malaysian Mosaic Berhad (MMB) based in Kluang Johor. The sludge composed in a semisolid state. According to MMB the mosaic production and sludge evaluation remained the same and was not affected by the processing of mosaic. Clay soil used in the study was supplied by the Hap Seng Brick Company in Sedenak, Johor. The sludge and clay were dried at 105 ºC in an oven for 24 h. They were then manually pulverized and sifted using sieves with a size ranging of 3 to 5 mm. All these processes were done in the RECESS and Geotechnic laboratories.
Characterization of raw materials
The clay and sludge were cleaned up before being subjected to X-ray fluorescence analysis. Raw materials were subjected to 24 h of oven drying. Subsequently, the sludge was grounded to crush with appropriate apparatus. Before the XRF analysis, the sludge was formed in pellet shapes. The chemical content and heavy metal levels of the raw materials in sludge and clay were determined using XRF equipment in Environmental Analytical Laboratory. Samples should be in fine powder condition because XRF can penetrate only in few millimetres from the sample surface. Meanwhile, the soil’s moisture-density relationship is determined by the compaction test experiment, Atterberg limits are the basic method to measure critical water content in clay and silt soil, specific gravity analysis experiment. All the experiment was done in the RECESS and Geotechnic laboratories, UTHM.
Analytical analysis
Testing procedure was carried out according to the British standard BS3921 in order to determine the compressive strength, shrinkage, initial rate of suction and density. On the other hand, the heavy metals leachability testing was conducted by using TCLP, SPLP and SLT method according to the United States Environmental Protection Agency (USEPA, 1996) and Environmental Protection Agency Victoria (EPAV, 2005a). Table 1 illustrates the instruments and equipment used in the experimental procedures.
Stage II: brick manufacturing
Two types of bricks (control brick and sludge brick) were produced, control bricks made of clay and bricks incorporated with mosaic sludge. Bricks were made without sludge (0% or control bricks) and with varying sludge proportions (1%, 5%, 10%, 20%, and 30%) were manufactured in the RECESS Laboratory. The brick manufacturing process was carried out accordance with BS EN 771-1:2011 and BS 3921:1985.
The control brick was produced by blending soil and water in a specific proportion using a mechanical mixer. Once the soil was thoroughly mixed, it was placed in a mould and manually compacted at a pressure of 2500 psi. The bricks were produced with standard dimensions of 100 mm × 210 mm × 70 mm, in a rectangular shape, which is typical for conventional fired clay bricks. The curing process involved drying the bricks in an oven at 105 °C for 24 h to remove moisture before firing at temperature ranging from 0.7 ºC/min until 1050 °C27. The bricks were then cooled gradually to room temperature. The same procedure and process were done for the mosaic sludge bricks by incorporating the mosaic sludge (bodymill sludge and polishing sludge), clay soil and water in different percentages ratio by weight made based on specific gravity and optimum moisture content.
Stage III: physical and mechanical analysis
Fired shrinkage experiment
Shrinkage is the measure of any changes or variations occurred in the brick’s dimensions during drying and firing operation. Ten specimens were picked randomly and measured after the firing process in the furnace by using the following Eq. 1.
Density test
Density refers to the mass of a substance per its volume unit and it varies depending on the material’s temperature and pressure. Ten specimens were picked randomly for each percentage and density of the brick can be calculated using follow Eq. 2.
Compressive strength analysis
Compressive strength indicates the highest stress a brick can endure when subjected to a crushing load. The brick’s compressive strength is determined by dividing the load by its cross-sectional area. The bricks were tested for compressive strength to find out their strength until they fail. According to the BS3921:1985 test procedures, the strength must be between < 28 N/mm2 and > 42 N/mm2. Ten specimens were picked randomly to fulfil the BS3921:1985 requirements. Results from each specimen were divided with the area of the bed face can be measured with the follow Eq. 3.
Initial rate of suction analysis
The initial rate of suction (IRS) measures brick capacity to permit water flow through it. Several approaches were employed to evaluate water absorption. Based on BS3921:1985, the bricks have to be prepared accordingly before they could be tested. Based on BS3921:1985 requirements three specimens were picked randomly for every percentage. These procedures were repeated for other bricks of different percentages of sludge. Equation 4 was used to calculate the IRS based on the total immersion area which is expressed in in kg/m2.min.
Microstructure characteristic analysis
The Scanning Electron Microscopy (SEM) was employed to examine the microstructure of the bricks surface. SEM is an electron microscope that forms a three-dimensional visualization with focus on the electron beams and moves across the object. SEM instrument is made up of two components (electronic console and electron column) and enables to investigate samples at a nanometer-scale resolution. The important signal is by the interaction of the primary electrons (PE) of the electron beam and secondary electrons (SE) with the specimens. Specimens with different diameter consume different energies used.
Surface area characterization analysis
Brunauer Emmett Teller (BET) method is one of the techniques used to evaluate a material surface area by using nitrogen multilayer adsorption, which is measured in relation to pressure employed fully automated analyzer. It helps in the analysis of the effects of particle size and surface porosity in various applications. BET surface area measurements were conducted using a Micromeritics ASAP 2020 analyzer, with nitrogen adsorption at 77Â K, to evaluate the porosity and surface area characteristics.
Stage IV: leachability analysis
The TCLP and SPLP method are designed to evaluate the movement of both organic and inorganic constituents present in liquid, solid, and mixed-phase samples. The TCLP and SPLP analysis for this research was carried out in the Wastewater Laboratory at UTHM. Brick samples were divided into four segments and then pulverized to provide a suitable sample for the investigation. The static leachate test (SLT) was first defined by28, is designed to identify highest leachate concentration under static conditions without the need to replace or altering the leachate. Typically, SLT test was performed in long term duration, from over three-month period to one year and data was composed continuously.
Stage V: indoor air quality
The term “indoor air quality� (IAQ) pertains to the quality of air inside a building and way its impact on the occupant’s health and comfort of those inside. This encompasses concerns related to chemical, physical, and biological pollutants. Nowadays, ensuring a safe, healthy, and comfortable IAQ is not only a necessity but also a significant priority. Improved AIQ boosts focus, productivity and harmonies. The Walk-in Stability Chamber (WiSC) was used for IAQ testing for determining the area-specific emission rate of volatile organic compounds (VOCs) from newly manufactured building materials or furnishings under specified climatic conditions according to method (ISO-16000-9:2006). This method can also potentially be used for older products. WiSC was built in many sizes and depended on the purpose of the test. It is also designed to controlled temperature-humidity chamber29. The research was carried out at the Thermal Environment Laboratory (TEL) in the Faculty of Mechanical and Manufacturing Engineering at UTHM. The experiment used three different dimensions and the arrangement of samples was in cube, column and wall.
Result and discussion
Analysis of chemical constituents and their concentrations
The composition of clay and sludge resulting from both the BS and PS processes is significantly impacted by the type of raw materials used and the production method. The data provided in Table 2 demonstrates that silicon dioxide (SiO2) and aluminum oxide (Al2O3) make up the largest portions of the clay, with proportions varying between 55.77% and 24.40%. The analysis of the mosaic sludge showed that SiO2 and Al2O3 were the predominant elements, with concentrations between 61.83 and 62.37% and 15.50–20.55%, respectively. The Loss on Ignition (L.O.I) results indicated that both the BS and PS sludge had low organic content, ranging from 7.01 to 7.92%, classifying as inorganic sludges.
Table 3 displays the concentrations of heavy metals in the clay soil and mosaic sludge. The results indicate that both the clay soil and mosaic sludge generated from the BS and PS processes contain measurable quantities of heavy metals. Zr shown the highest concentration among the heavy metals, reaching 2738 ppm in PS sludge and 2507 ppm in BS sludge. Ba followed with levels of 1242 ppm in PS sludge and 1232 ppm in BS sludge. Furthermore, the concentrations of heavy metals such as Fe (ranging from 105 to 136 ppm), Cu (from 234 to 255 ppm), Zn (from 195 to 210 ppm), and Mn (from 89 to 97 ppm) were higher in the PS sludge compared to the BS sludge, except for Cr which showed levels of 915 to 971 ppm. Conversely, the concentrations of Fe and V were notably higher in clay soil compared to both PS and BS sludges.
Compaction test analysis
The compaction analysis was performed at the RECESS Laboratory, UTHM where the water content of each blend was determined. The optimal moisture content (OMC) is a critical parameter in the brick manufacturing process, as it directly affects the compaction and density of the bricks. Higher OMC values facilitate better particle arrangement, leading to improved mechanical strength and reduced porosity. However, excessive moisture can result in shrinkage and cracking during the drying and firing stages. In this study, OMC values ranged from 12 to 24%, with higher sludge percentages requiring higher moisture content due to the finer particle size and increased surface area of the sludge. OMC for both the control brick and mosaic sludge brick. The OMC which greatly influences brick properties, was determined using a combination and test method based on BS1377:1990.
Atterberg limits analysis
Atterberg limit was performed accordance with BS1377-2:1990. The result showed that the type of soil in this research was silty clay or clayey silt with 13.4% within the range of Plastic Index which is between 7 and 17%. The specific gravity (SG) result shows there was no significant different between clay soil and mosaic sludge with 2.6 kg/m³ and 2.4 kg/m³. Thus, the mosaic sludge could be replacing clay soil in terms of percentages by weight.
Firing shrinkage analysis
Shrinkage rate of bricks with 5% BS displayed the smallest shrinkage, measuring at 0.34%. This is succeeded by the bricks with 1%, 10%, 20%, and 30% BS, which showed shrinkage rates of 0.43%, 0.56%, 0.57%, and 0.69% respectively. Particularly, the brick with 30% BS had the highest shrinkage at 0.69%. The shrinkage rate for PS bricks is highest for the 30% PS brick at 0.60%. Subsequently, the shrinkage rates for the 20%, 1%, 10%, and 5% PS bricks are 0.56%, 0.50%, 0.49%, and 0.34%, respectively. Similar findings were documented by30,31, when they combined sludge into fired clay bricks. According to previous studies, in order to yield a good quality brick, the shrinkage value should not be more than 8%32,33.
Density test analysis
The density of BS bricks of 30% displays the least density, at 1665.24 kg/m3. There’s a gradual increase in density for the 20%, 10%, 5%, 1%, and 0% BS bricks, with values being 1677.43 kg/m3, 1679.89 kg/m3, 1683.28 kg/m3, 1688.06 kg/m3, and 1698.24 kg/m3 respectively. PS bricks findings reveal that the brick with 1% PS sludge recorded the maximum density of 1690.03 kg/m3. This is followed closely by the 5% sludge brick with a density of 1689.73 kg/m3. Bricks containing 10% and 20% sludge had a density of 1687.99 kg/m3 and 1678.52 kg/m3. The trend observed in PS brick that of BS brick, where increasing higher proportions of sludge to the fired clay brick leads to a reduction in density. The brick with the low density was the one combined with 30% PS sludge with1661.49 kg/m3. Overall, the density values typically fall within the range of 1500 kg/m3 to 2000 kg/m3. Consequently, the bricks’ densities fall within this range and adhere to the standard weight for common bricks34. Thus, the bricks align with the standard weight of common bricks. As per author35, bricks with a lighter weight are practicable, and such lightweight bricks can lead to reduced manufacturing and transportation expenses.
Compressive strength analysis
The outcomes of the compressive strength testing for BS brick are revealed the highest recorded compressive strength was achieved by the BS brick with 30% sludge content, with 26.58Â N/mm2. Following this, the strengths for the 20%, 10%, 5%, and 1% BS bricks were 26.17Â N/mm2, 25.81Â N/mm2, 24.80Â N/mm2, and 17.91Â N/mm2, respectively. On the other hand, the PS brick shows the highest compressive strength with 30% of PS brick incorporation with 23.45Â N/mm2 and followed by PS brick 20%, 10%, 5% and 1% with 21.91Â N/mm2, 19.81Â N/mm2 19.50Â N/mm2, and 15.43Â N/mm2 discretely. The control brick showed the lowest results compared to the other samples, with a measurement of 15.32Â N/mm2. This is because BS and PS are categorized as inorganic material compared to organic. clay soil is burned during the firing process, it results in weak inter-particle bonds within the manufacturing brick14,36. Other than that, the BS brick 30% obtained slightly higher compressive strength compared to PS brick 30%. This could happen due to the reaction of silicon dioxide and aluminum oxide that was higher in BS sludge that assisted good bonding37.
Initial rate of suction
Figure 1 illustrates that the initial rate of suction for the BS brick drops as sludge waste increases from 0 to 30%. The peak value is observed in the BS brick (1%) at 12.65 g/mm2, while the lowest average rate is seen in the BS brick (30%) at 3.94 g/mm2. The control brick results revealed an initial rate of suction highest at 12.96 g/mm2. Nevertheless, for PS brick, based on Fig. 1, the PS brick displayed its lowest value at PS brick (30%) averaging 3.75 g/mm2, succeeded by PS brick (20%) with an average of 4.35 g/mm2. The peak value was observed in (1%) PS brick with an average measurement of 11.64 g/mm2. This was categorized according to the initial rate as defined by BS3921:1985. The initial water rate for both the control brick and mosaic sludge (BS and PS) in the range of 1–10% were not satisfied. According to38,39, a lower IRS can build strong bonds in brick because the lower IRS will not allow moisture to infiltrate into a brick. From the results, it was observed that the initial value was high compared to the standard value.
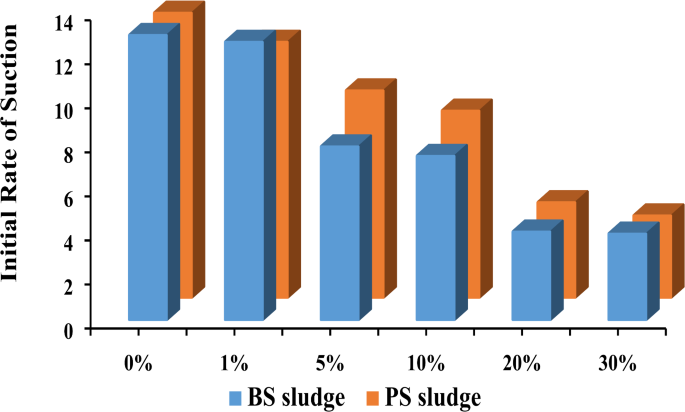
Initial rate of suction proportions of BS and PS brick.
Microstructure analysis
Figure 2a and l present the comparative views of the control brick and the brick with mosaic sludge (BS and PS). These images reveal that the bricks containing mosaic sludge have a more refined surface structure than the control brick. Additionally, the images depict rough surfaces for bricks containing 0%, 1%, 5%, and 10% sludge compared to those with 20% and 30% sludge. The pore sizes of the control brick ranged from 45 μm to 50 μm. Bricks with a sludge content of 1–10% exhibited pore sizes ranging from 18 μm to 44 μm. In contrast, bricks with 20% and 30% sludge had pore sizes between 1.9 μm and 3 μm. Conversely, PS bricks display a similar pattern, with bricks made of 1–10% sludge having bigger pore sizes than those with 20% and 30% sludge content. This occurs because the granularity of mosaic sludge powder is more refined than clay soil, allowing the mosaic sludge to fill the spaces between the clay particles in the mixture. Currently, the mosaic sludge bricks with 20% and 30% content possess a smooth texture, though they display a lighter texture and reduced soil cohesion. The author15 suggests that incorporating sludge can lead to variations in the plasticity and the filler properties of the sludge. Moreover, during the initial tests, BS and PS bricks with up to 40% incorporated showed noticeable affects. This observation aligns with the findings of18, who indicated that bricks with up to 35% sludge content were quite brittle and broke upon removal.
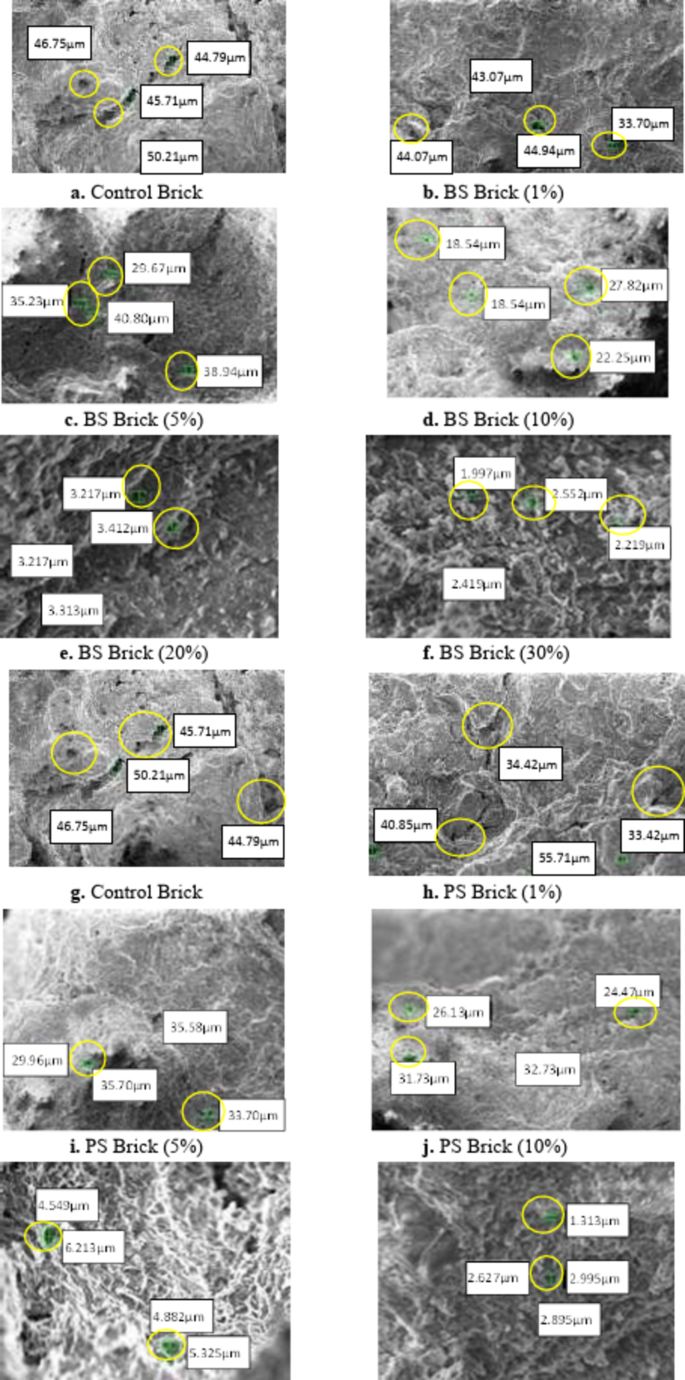
SEM result of (BS and PS) brick materials.
Surface area characterization
The BET experiment results revealed that mosaic sludge bricks had considerably smaller average pore sizes. Specifically, the BS brick 30% had a pore size of 13.40Â nm and the PS brick 30% had a size of 15.92Â nm, in contrast to the control brick which had a pore size of 123.22Â nm. The BS brick 30% and PS brick 30% fall into the mesoporous category with pore sizes ranging from 2Â nm to 50Â nm, as per40. On the other hand, the control brick is characterized as microporous with pore sizes exceeding 50Â nm. Nevertheless, the total pore volume in BS and PS bricks was greater at 0.005 cm3/g, while the control brick had a volume of just 0.002 cm3/g. The formation of mesopores makes the bricks lighter and when combined with 30% BS and PS sludge, they exhibit greater strength compared to the control brick.
Toxicity characteristics leaching Procedure (TCLP)
The concentration of heavy metals present in BS brick were Cd, Mn, Fe, Cr, Cu, Pb, Co, Ba, Ni, Zn, As and Vanadium. All heavy metal levels were below the permissible limits for example Fe for 10% BS brick was 0.65 mg/L, the highest among other heavy metals. Other metals like Mn, Ba, Zn, As and Vanadium also showed visible low concentration within acceptable range limits. The concentration of heavy metals for PS brick has low metal concentration such as Cd, Cr, Cu, Co, Ni, Hg compared to Mn, Fe, Ba, Zn, As and Vanadium. However, TCLP results were compared with the specific limits set by USEPA (e.g., Pb ≤ 5.0 mg/L, Cd ≤ 1.0 mg/L, Cr ≤ 5.0 mg/L) and EPAV guidelines (e.g., Pb ≤ 5.0 mg/L, Cd ≤ 0.5 mg/L, Cr ≤ 1.0 mg/L). Therefore, fired clay brick incorporated with mosaic sludge brick is safe to be discarded to landfill and no special caution is needed.
Synthetic precipitation leaching Procedure (SPLP)
Synthetic Precipitation Leaching Procedure (SPLP) is one of the leachate tests that haves been used to determine the potential for soil contamination leachability into groundwater. SPLP was designed for in-situ (ground surface of the landfill) purposes, which is exposed to rainfall with the assumption that the rainfall is slightly acidic. In the SPLP test, nitric acid and sulfuric acid (40/60) are used to simulate synthetic rain in order to depict the actual situation. The concentration of heavy metals in BS brick detected using SPLP. Lead, Pb element was the highest in BS brick (1%) with 2.307Â mg/L, followed by 5% and 10% with 2.173Â mg/L and 1.821Â mg/L respectively. Other elements like Cd, Mn, Fe, Cr, Co, and Ni showed lower concentration. However, V, Zn, As and Ba showed moderate concentration. The author41 found that bricks made from sludge produced lower amounts of leachate elements. However, the concentration of metals in these bricks comply USEPA guidelines which is 5Â mg/L.
Meanwhile, heavy metal leaching from the PS brick. The findings revealed that using SPLP resulted in an extremely low leaching of all heavy metals from the PS brick. Lead, Pb element was the highest in PS brick (1%) with 0.902Â mg/L, followed by 5% and 10% with 0.802Â mg/L and 0.194Â mg/L respectively and it comply USEPA guidelines which is 5Â mg/L. Other elements like V, Zn, As and Ba showed values between 0.113 and 0.229Â mg/L.
Static leachate test (SLT)
Figure 3 depicts the heavy metal concentration in the control brick between day-4 and day-95. The data indicates that iron (Fe) reached its peak level on day-16 at 2.07 mg/L. This was closely followed by V, which reached 1.790 mg/L on day-28, when compared to the other heavy metals. On day-16, Ba recorded its peak concentration at 1.73 mg/L and then gradually decreases to 0.25 mg/L by day-95. Other metals like Cr, Ni, Cu, Zn, As, Cd, and Pb were present in small quantities and met both USEPA and EPAV guidelines.
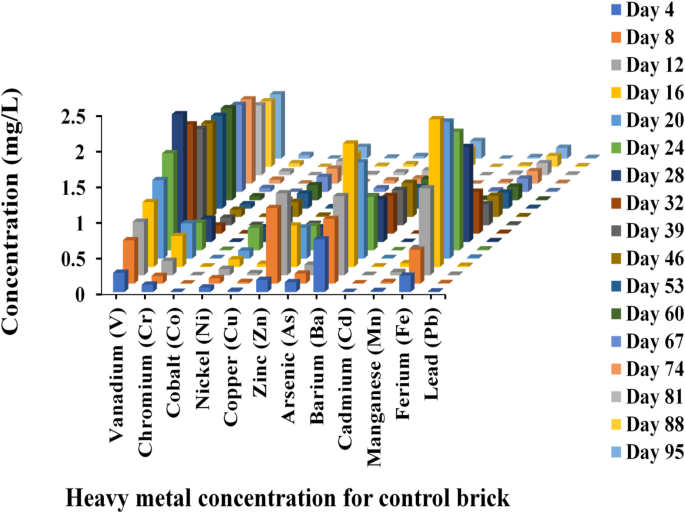
Heavy metal concentration for control brick.
Figure 4 presents the heavy metal concentration in a 1% BS brick. The data indicates that vanadium had the higher concentration at 2.14 mg/L on day-32. This was closely followed by Fe with 2.11 mg/L on day-28. Both of these metal concentrations remained unchanged from day-81 through day-95. Zn reached its highest level on day-8 and then rapidly declined until day-95. The concentrations of other heavy metals were consistently below 1 mg/L and far within acceptable boundaries. However, it’s important to note that all heavy metal concentrations within the 1% BS brick within the prescribed standard.
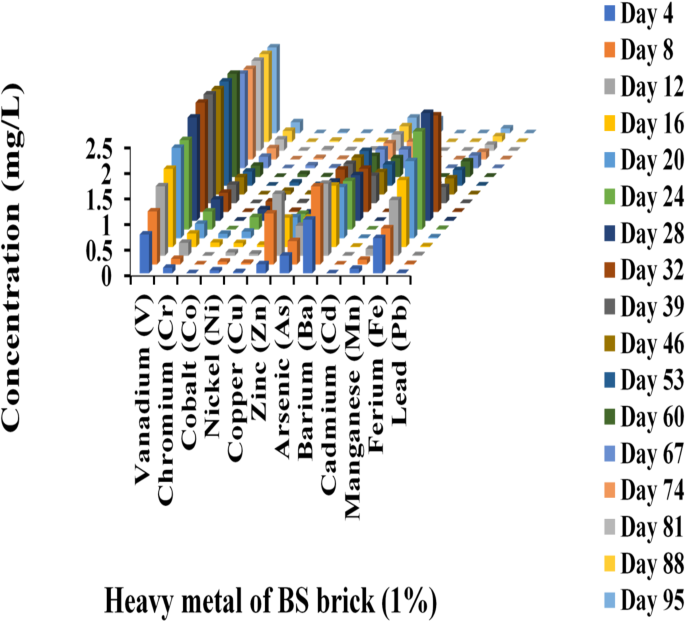
Heavy metal concentration for BS brick (1%).
Figure 5 illustrates the heavy metal concentration in a 5% BS brick. The data reveals that Fe concentration in the 5% BS brick peaked at 2.26 mg/L on day-20, then gradually dropped until day-74, remain constant at 0.52 mg/L by day-88. V concentration was observed at 1.99 mg/L on day-24, which then consistently decreased to 0.10 mg/L by day-95. All other heavy metals were detected at levels below 1 mg/L and were within acceptable standards.
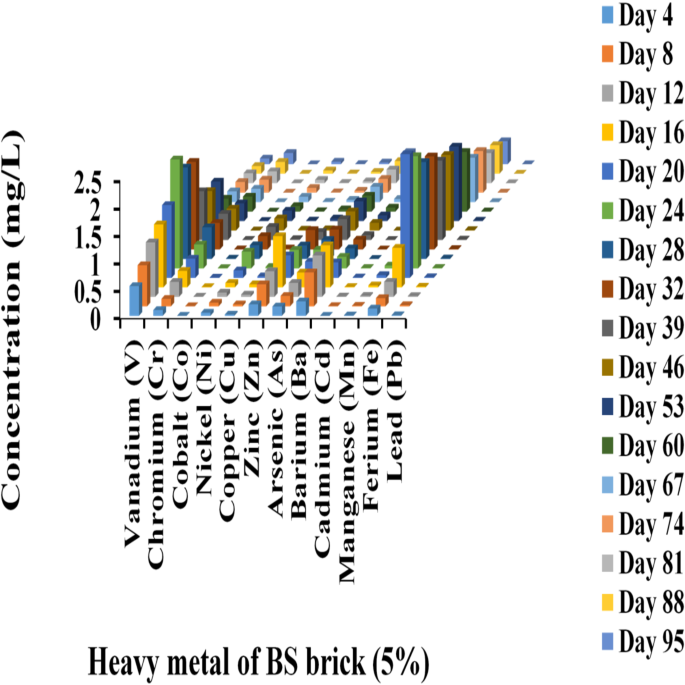
Heavy metal concentration for BS brick (5%).
Figure 6 displays the concentration of heavy metals in a 10% BS brick from day-4 to day-95. The data indicates that iron (Fe) concentration peaked at 2.34 mg/L on day-20, then dropped to 1.81 mg/L by day-24. However, from day 60 to day 95, the concentration remained constant. After Fe, V was observed to be the next most concentrated heavy metal, reaching 2.11 mg/L on day-32. By day-95, its level had reduced to 0.10 mg/L. All other heavy metals had values under 1 mg/L. Therefore, all the heavy metals were within and met the standard guidelines.
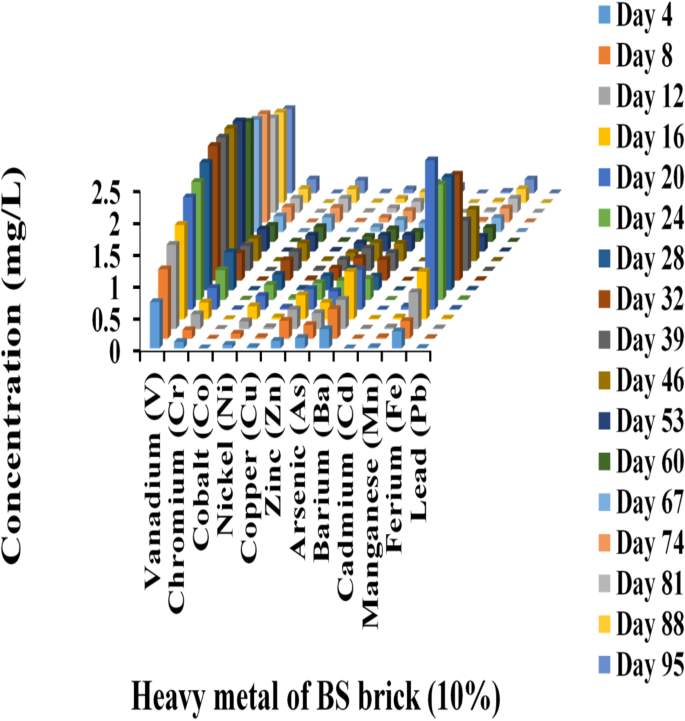
Heavy metal concentration for BS brick (10%).
Figure 7 displays the elevated levels of heavy metals in a 20% BS brick. On day-46, there was a significantly increased in V at 3.36 mg/L. But from day-53 to day-95, the concentration of V gradually decreased. On day-28, Fe showed a high level of 2.19 mg/L, but by day-95, its level had substantially decreased to 0.21 mg/L. Conversely, the Zn reading reached its highest point on day-12 at 1.28 mg/L, after which it remained constant from day-46 and above, at a level of 0.04 mg/L. Consequently, all the heavy metal concentrations remained low and within the limits.
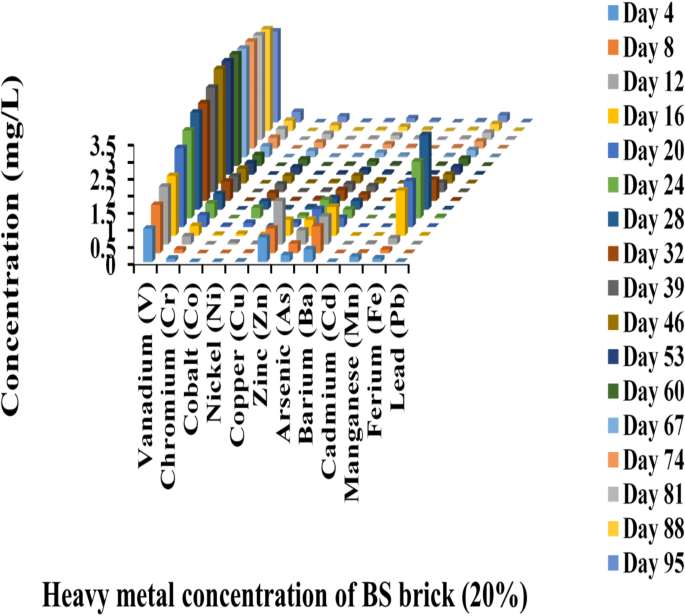
Heavy metal concentration for BS brick (20%).
Figure 8 depicts the heavy metal levels in 30% BS bricks. Fe illustrated the highest concentration among all metals on day-8 with 2.79 mg/L and then steadily decreased to 0.23 mg/L by day-95. V reached a higher value of 2.52 mg/L on day-60 and remained stable through day-95. On day-95, Pb had the lower concentration at 0.0008 mg/L, which is below the USEPA level of 5 mg/L. Nonetheless, all the other heavy metals tested met the USEPA standards.
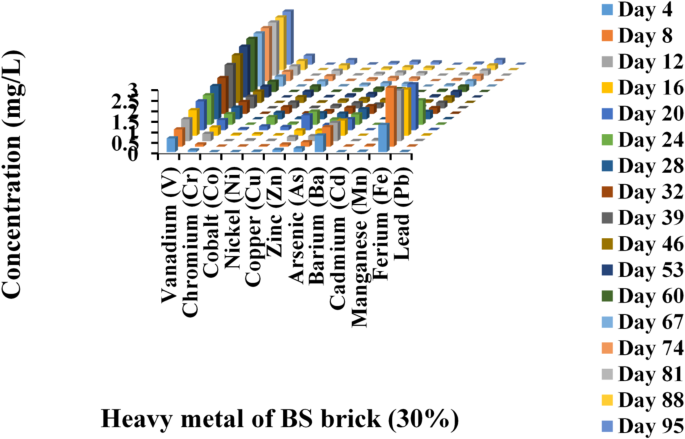
Heavy metal concentration for BS brick (30%).
Figure 9 displays the data for the 1% PS brick. Ba recorded the maximum level at 2.27 mg/L on day-12, but this level decreased, reaching 0.21 mg/L by day-95. Fe had a relatively high level at 2.15 mg/L on day-28 but decreased to 0.50 mg/L by day-95. Meanwhile, V was peaked at 2.06 mg/L on day-60 and then stabilized through day-95. Zn also showed a notable concentration of 1.71 mg/L on day-20. Consequently, all the heavy metal concentrations remained low and within the limits prescribed by the USEPA.
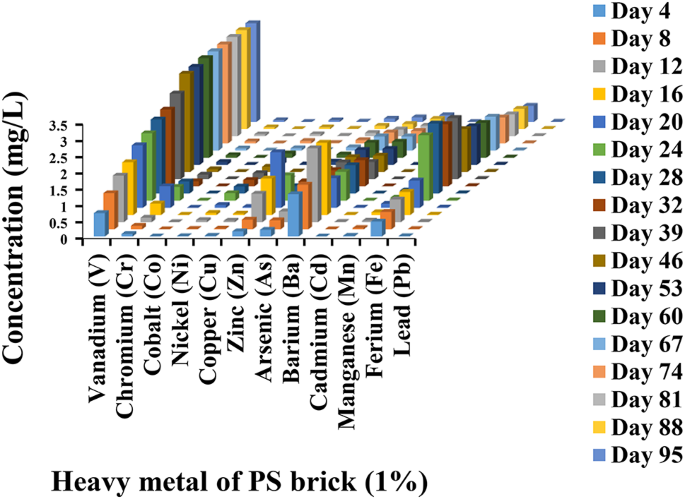
Heavy metal concentration for PS brick (1%).
Figure 10 presents the outcomes of heavy metal concentration in a 5% PS brick. The graph illustrates the variation in brick concentration from day-4 to day-95. The data revealed that V reached its highest concentration at 2.99 mg/L on day-46, while Fe followed at 1.88 mg/L on day-28. On day-20, Zn revealed a peak level of 1.17 mg/L, while Ba reached 0.88 mg/L on day-16. As the study progressed to day-95, all heavy metal levels declined and remained within the acceptable level.
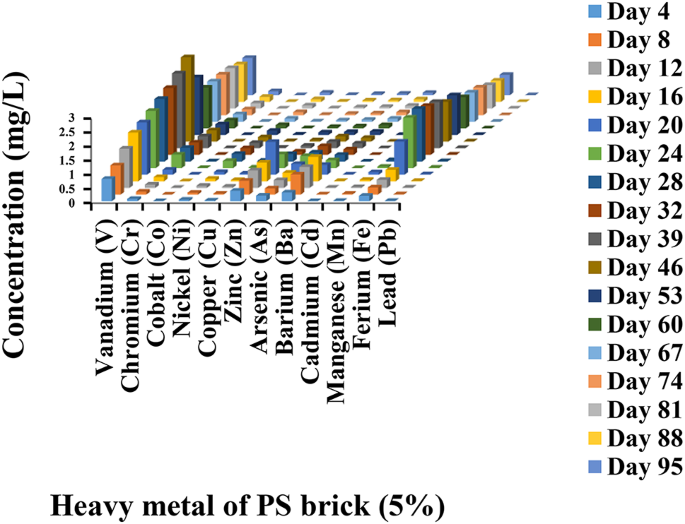
Heavy metal concentration for PS brick (5%).
Figure 11 depicts the concentration of heavy metals in a 10% PS brick, measured in mg/L, from day-4 to day-95. Fe reached a higher value of 3.29 mg/L on day-32. This began to decrease by day-39, and remain stable at 1.51 mg/L until day-95. V the second highest value of heavy metal with 2.13 mg/L on day-32. Ba, on the other hand, reached its highest value of 1.01 mg/L on day-16 and remained stabilized at 0.07 mg/L from day-67 to day-95. The concentrations of Cr and Zn ranged from 0.60 mg/L to 0.85 mg/L throughout the study period. All other heavy metals had values under 0.40 mg/L up to day-95. Therefore, all the heavy metals were within and met the standard guidelines.
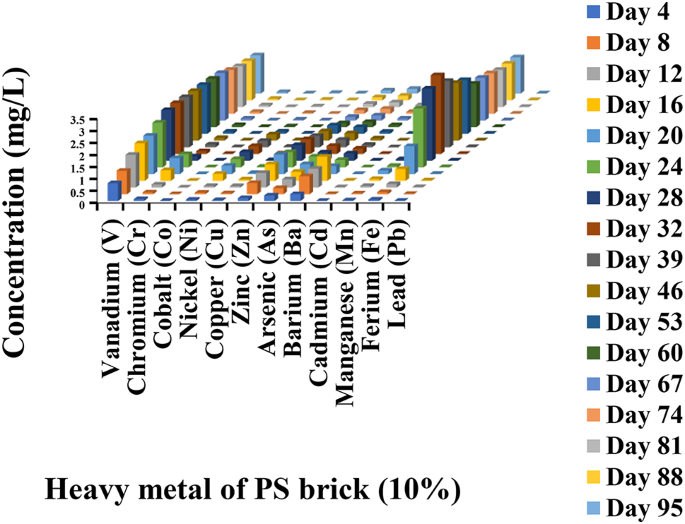
Heavy metal concentration for PS brick (10%).
Figure 12 displays the concentration of heavy metals in PS brick (20%). On day-24, Fe had the maximum concentration at 2.36 mg/L, while V was the next highest at 2.18 mg/L on day-67. By day-81, the concentrations of Fe and V remained stabilized at 0.12 mg/L and 2.16 mg/L, respectively. On day-28, Ba reached its highest concentration at 1.10 mg/L, but it decreased to 0.19 mg/L by day-95. Zn and Cr had higher levels on day-16 and day-46, with 0.91 mg/L and 0.89 mg/L, respectively. The remaining heavy metals stayed under 0.35 mg/L until day-95. Consequently, all the heavy metal concentrations remained within the limits prescribed by the USEPA.
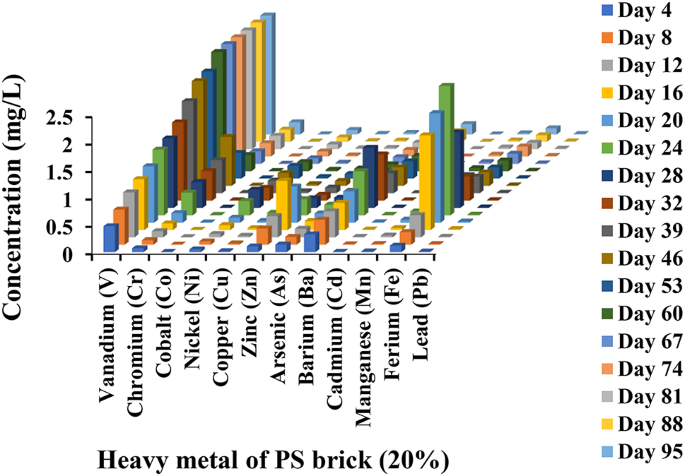
Heavy metal concentration for PS brick (20%).
Figure 13 data reveal the concentration of heavy metals in the PS brick (30%) from the day-4 to the day-95. The day-28 recorded the higher concentration of Fe at 3.64 mg/L, other heavy metals. This concentration began to decrease from the day-32 and continued to do so until the day-95. As for Vanadium, it reached a concentration of 1.78 mg/L on the day-53, but this level stabilized and remained constant from the day-88 to day-95. The concentrations of Zn and Ba peaked on the day-24, registering at 0.92 mg/L and 0.88 mg/L, respectively. However, all the concentrations of these heavy metals remained satisfied and followed to the standards limits.
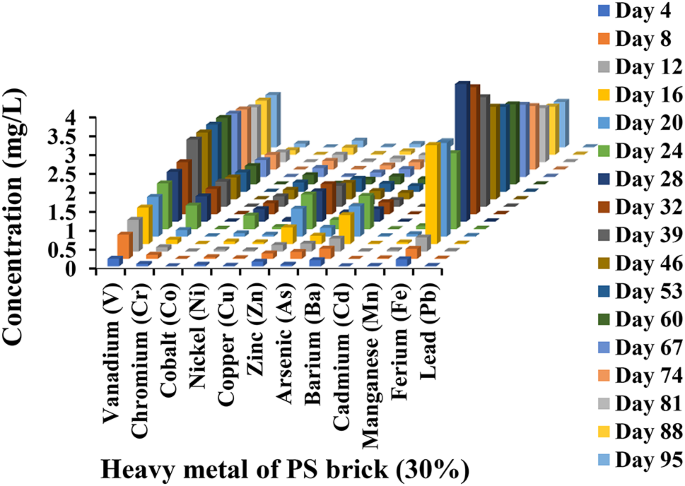
Heavy metal concentration for PS brick (30%).
Apart from that, the most appeared elements that were most frequently observed in both short- and long-term tests were Vanadium, Iron (Fe), Arsenic (As), Barium (Ba), and Zinc (Zn). Hence, by adding mosaic sludge to the fired clay bricks, all heavy metal results satisfied and followed to the standards set by the USEPA and EPAV.
Total volatile organic compound (TVOC)
Figure 14 shows the TVOC values against types of bricks. The findings indicated that the control brick recorded the lowest emissions when arranged in wall and column designs, with values of 0.667 ppm and 0.576 ppm respectively. In the cube design, control bricks emitted the maximum level at 0.917 ppm compared to other bricks. From the graph, the pattern appears to increase from 0 to 30% for wall and column pattern, while the cube form shows a decreasing trend from 0 to 30%.
The values for BS brick 5% and 30% for the wall are 0.715 ppm and 0.912 ppm, higher than the control brick. The values for column patterns were 0.675 ppm for BS (5%) and 0.800 ppm for BS (30%). PS brick also demonstrated an increasing pattern at 0.690 ppm for 5% and 0.819 ppm for 30% in the form of a wall. On the other hand, the cube form of PS brick showed very minimal differences in the comparison between 5% and 30% PS brick which is 0.002 ppm. Compared to the limit for Empty Room (ER), the TVOC level for control brick appeared to be slightly higher in every pattern except for the cube pattern.
In conclusion, the result shows that the amount of TVOC has no significant difference between control, BS and PS brick. This might happen as a result of the organic compounds present in the brick being removed during the firing process. Nevertheless, the increasing value of TVOC is still below the limit which is 3 ppm based on the standard and BS and PS bricks are safe to be used as an indoor brick in terms of the volatile organic compound.
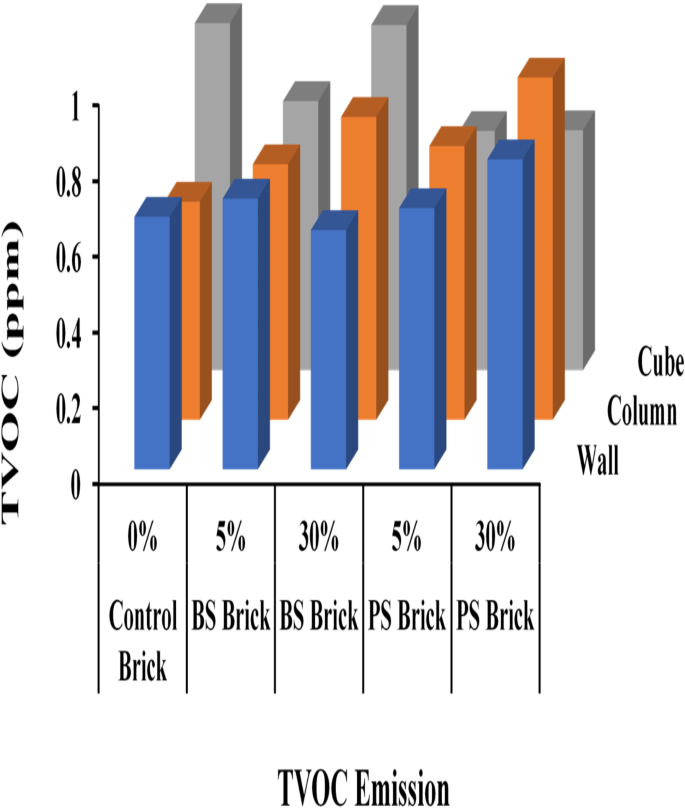
TVOC emissions from control, BS and PS bricks.
Carbon dioxide (CO2)
The emission of carbon dioxide (CO2) for both control bricks and mosaic sludge bricks (BS and PS) for 5% and 30%. The findings shows that control brick (0%) obtained the highest emissions compared to BS brick and PS brick. CO2 was measured in unit ppm by using Yes monitor, based on the standard for CO2 which is 1000 ppm according to the ICOP-IAQ (2010).
The results obtained showed that the control brick had highest emission of CO2 for the wall design at 381 ppm and trailed by column and cube design at 357 ppm and 349 ppm. For BS bricks, the 5% sludge had a higher emission compared to 30% sludge for wall design at 342 ppm and 323 ppm. Cube pattern for BS brick (5%) showed a higher reading at 342 ppm compared to BS brick (30%) at 340 ppm. For the column pattern, both BS bricks show equal readings of 330 ppm. On the other hand, PS brick with 5% sludge incorporation obtained the highest emission of CO2 compared to 30% sludge in the wall pattern (337 ppm and 329 ppm) and column (334 ppm and 329 ppm) pattern. The ER results indicated a lower value compared to the other bricks, confirming that all bricks released CO2 throughout the ER process.
From all the results, it was determined that control bricks emitted the maximum level of CO2 whereas the levels were lower for bricks incorporated with mosaic sludge. Thus, control bricks appeared to emit more CO2 than bricks with mosaic sludge (BS and PS). The BS brick with 30% composition is recommended, as it consistently displayed lower concentration values across all patterns when compared to other brick samples. Nevertheless, it is important to note that all the bricks produced in this study are considered safe for use as building materials within enclosed structures. They meet the requirement of being below the limit of 1000 ppm set by the ICOP-IAQ (2010).
Carbon monoxide (CO)
Overall, the findings indicated that control bricks emitted the most CO when compared to other types (BS and PS) of bricks in the form of wall, column, and cube. These phenomena occur when the control brick carries CO after the firing process. Other than that, the control brick was higher with the organic content compared to BS and PS brick.
Control brick for column shows the higher values 0.200 ppm while both wall and cube with the same result (0.180 ppm). In the meantime, BS brick (5%) showed a higher emission compared to BS brick (30%) for all wall patterns (0.080 ppm and 0.010 ppm), columns (0.010 ppm and 0.050 ppm) and cubes (0.080 ppm and 0.040 ppm). The results obtained for PS brick showed a similar trend with the BS brick. PS brick (5%) obtained higher emissions compared to PS brick (30%) in all forms of wall, column and cube. Empty Room (ER) findings was 0.005 ppm and slightly lower compared to BS brick and PS brick 30%.
Furthermore, the CO values were lower in BS brick and PS brick that have been incorporated with 30% sludge. Thus, the incorporation of mosaic sludge has the potential to reduce the CO content in fired clay bricks. Nonetheless, all the bricks followed to the CO standard, ensuring levels remained below the 10 ppm.
Ozone (O3)
The values of O3 were obtained from control bricks and mosaic sludge (BS and PS) bricks in wall, column and cube patterns. The result shows that control bricks have the lowest emission among the others with 0.009 ppm for wall, 0.011 ppm for column and 0.013 ppm for cube. Meanwhile, for BS bricks, the result for wall pattern showed that 30% of sludge had the highest emission at 0.012 ppm compared to 5% sludge at 0.011 ppm. The same trend was obtained for the column and cube which were 0.013 ppm and 0.023 ppm for BS brick (30%) compared to BS brick (5%) which are 0.012 ppm and 0.013 ppm respectively. The result measurements for PS brick also showed the same trend with PS brick (30%) having higher O3 emissions compared to PS brick (5%). On the other hand, PS brick (30%) showed that the cube pattern was the highest with 0.026 ppm, trailed by column and wall designs with 0.023 ppm and 0.019 ppm. In the experimental phase, the concentration of O3 value for ER appeared lower possibly because of the empty state of room conditions. Nonetheless, when the brick was placed inside the chamber, both types of fired clay bricks indicated a rise in the O3 concentration within the room.
The data revealed that incorporating sludge into fired clay bricks increases the release of ozone emissions. Among all brick samples tested, the BS brick with a 5% composition revealed the most favourable result, emitting the least amount of gases. However, all the bricks followed to the ICOP-IAQ (2010) standards, ensuring emissions stayed below the 0.050 ppm. Thus, mosaic sludge bricks are safe to be used.
Formaldehyde (HCHO)
Generally, there is no significant difference in the HCHO emission between control bricks and mosaic sludge bricks. The ER value was determined lower with 0.001 ppm as expected.
The control bricks show the lowest emission values compared to other bricks i.e., wall, column and cube (0.018, 0.013 and 0.015 ppm). BS brick showed that 5% sludge bricks showed lower HCHO emissions compared to 30% sludge bricks in all forms. The results showed that the HCHO emissions for BS brick (5%) for wall was 0.019 ppm for cube and column form at 0.016 ppm and 0.014 ppm. BS brick (30%) also showed similar results whereby the highest was obtained for wall (0.021 ppm), followed by cube (0.018 ppm) and column (0.017 ppm). On the other hands, PS brick (5%) has a lower value at 0.023 ppm (wall) compared to PS brick (30%) at 0.025 ppm, followed by cube at 0.016 ppm for PS brick (5%) and 0.017 ppm for PS brick (30%). Furthermore, PS brick for column pattern had a similar trend with PS brick (5%) which is 0.012 ppm compared to PS brick (30%) at 0.015 ppm.
However, the wall pattern utilizing BS brick (5%) emitted lower HCHO emissions in contrast to the other patterns. Nevertheless, all bricks adhered to the standards and can be considered suitable for use as indoor building materials. Other than that, the finding indicates that HCHO emission for all bricks did not exceed 0.100 ppm based on the ICOP-IAQ (2010) standards required.
Particulate matter (PM10)
PM10 levels of various types of fired clay bricks. While the ER result was at a lower level of 0.015 mg/m3, the measurements for the bricks (control, BS and PS) revealed slightly higher PM10 levels, but they still remained within the accepted standards. The results obtained showed that the wall, column and cube pattern values for BS brick increased with the increasing sludge percentages with 0.115 mg/m3 (0% sludge), 0.127 mg/m3 (5% sludge) and 0.133 mg/m3 (30% sludge) for wall, 0.111 mg/m3 (0% sludge), 0.124 mg/m3 (5% sludge) and 0.136 mg/m3 (30% sludge) respectively for column. As for cube it showed 0.1403 mg/m3 (0% sludge), 0.147 mg/m3 (5% sludge) and 0.149 mg/m3 (30% sludge) respectively. Meanwhile, for PS brick there was an increase for the wall pattern at 0.115 mg/m3 (0% sludge), 0.120 mg/m3 (5% sludge) and 0.127 mg/m3 (30% sludge) each.
However, for the column and cube pattern, the lowest PM10 value was shown by 5% sludge brick with column (0.104 mg/m3) and cube (0.129 mg/m3). Overall, this finding shows that PS (5%) emitted the lowest PM10 value for all patterns compared to other bricks. Nevertheless, all bricks satisfied the standard ICOP-IAQ (2010) limit which is below 0.150 mg/m3.
In terms of emission due to IAQ, the BS brick containing 5% sludge was considered safer and more suitable than other variants. Consequently, it is recommended to employ the BS brick (5%) as a building material since it released lower gases emission into the environment and adhered to the ICOP-IAQ standard. It also has lower emissions than the control brick. However, for full utilization of mosaic sludge as raw material it could use up to 30% mosaic sludge. As all parameters in each pattern closely aligned with the standards set by ICOP-IAQ, every pattern is considered suitable from a design perspective. However, based on the overall findings suggest that the wall pattern is the most advisable choice for construction purposes.
Nevertheless, the overall results obtained show that the wall pattern is most recommended to be used in construction work.
Conclusion
In conclusion, all the characteristics, sludge percentages, physical and mechanical properties, leachability, and indoor air quality of bricks incorporated with BS sludge and PS sludge waste were determined. The results from the XRF analysis revealed that the chemical properties of both clay soil and mosaic sludge were rich in SiO2 and Al2O3. The analysis indicated that the elements in clay were SiO2 and Al2O3, comprising between 55.77% and 24.40%. Similarly, the mosaic sludge waste revealed its highest proportion in SiO2 and Al2O3, ranging from 61.83 to 62.37% and 15.50–20.55% respectively.
The incorporation of mosaic sludge improved the physical and mechanical properties of bricks, achieving a compressive strength of up to 25 N/mm², reduced microporosity, and satisfactory density (1600 kg/m³) and shrinkage (< 8%) values. Leachability tests (TCLP, SPLP, SLT) confirmed compliance with USEPA and EPAV guidelines for heavy metals, ensuring environmental safety. While 5% sludge bricks offered the safest choice for indoor air quality under ICOP-IAQ standards, higher sludge content (up to 30%) effectively minimized environmental waste and enhanced material properties without exceeding IAQ limits. The TCLP employs acetic acid, which has a more acidic reagent, leading to a greater release of heavy metals than the SPLP. The results of the SLT test demonstrated that the inclusion of mosaic sludge in fired clay bricks, up to a 30% proportion, led to an initial increase in concentration up to 3 mg/L. Subsequently, the concentration decreased and remained constant until day 95. In summary, the integration of mosaic sludge into fired clay bricks ensured that heavy metal results complied both the USEPA and EPAV guidelines. It can be concluded that BS sludge and PS sludge can be effectively used up to 30% in the production of fired clay bricks, resulting in satisfactory physical and mechanical characteristics. These bricks meet the standard criteria for heavy metals and offer improved indoor air quality in line with ICOP-IAQ standards. Thus, these sludges present an eco-friendly and economical alternative for disposal.
Data availability
The datasets used and/or analyzed during the current study available from the corresponding author on reasonable request.
References
-
Henze, M., van Loosdrecht, M. C., Ekama, G. A. & Brdjanovic, D. Biological Wastewater Treatment (IWA Publishing, 2008).
-
Werle, S. & Dudziak, M. Analysis of organic and inorganic contaminants in dried sewage sludge and by-products of dried sewage sludge gasification. Energies 7 (1), 462–476 (2014).
-
Labrincha, J. A. et al. Novel inorganic products based on industrial wastes. Waste Biomass Valoriz. 5, 385–392 (2014).
-
Hashemi, H., Pourzamani, H. & Rahmani Samani, B. Comprehensive planning for classification and disposal of solid waste at the industrial parks regarding health and environmental impacts. J. Environ. Public. Health. 2014, 1–6 (2014).
-
Department of Environment, Malaysia. Malaysia Environmental Quality Report 2012 (OMR Press Sdn. Bhd, 2014).
-
Hamid, N. J. A., Kadir, A. A., Hashar, N. N. H., Pietrusiewicz, P., Nabiałek, M.,Wnuk, I. & Jez, B. Influence of gypsum waste utilization on properties and leachability of fired clay brick. Materials 14(11), 2800 (2021).
-
Latiff, A. A. A., Karim, A. T. A., Ahmad, A. S., Ridzuan, M. B. & Yung-Tse, H. Phytoremediation of metals in Industrial Sludge by Cyperus Kyllingia-Rasiga, Asystassia Intrusa and Scindapsus Pictus Var Argyaeus Plant species. Int. J. Integr. Eng. 4 (2), 1–8 (2012).
-
Lau, H. H., Whyte, A. & Law, P. L. Composition and Characteristic of Construction Waste Generated by residential Housing Project. Int. J. Environ. Res. 2 (3), 261–268 (2008).
-
Masirin, M. I. H. M., Ridzuan, M. B., Mustapha, S. & Don, R. A. M. An overview of landfill management and technologies: A Malaysian case study at Ampar Tenang. In 1st National Seminar on Environment, Development and Sustainability. 157–165 (2008).
-
Ngoc, U. N. & Schnitzer, H. Sustainable solutions for solid waste management in southeast Asian countries. Waste Manag. 29 (6), 1982–1995 (2009).
-
Kulkarni, A., Raje, S., Peerzada, J. & Rajgor, M. A miniscule endeavour for accomplishing hypo sludge fly ash brick in Indian context. Int. J. Eng. Trends Technol. 10 (7), 361–365 (2014).
-
Ismail, M., Ismail, M. E. & Lau, S. K. Fabrication of bricks from paper sludge and palm oil fuel ash. Concrete Res. Lett. 1 (2), 60–66 (2010).
-
Zaidi, A., Wani, P. A. & Khan, M. S. Toxicity of Heavy Metals to Legumes and Bioremediation. 248 (Springer, 2012).
-
Jahagirdar, S. S., Shrihari, S. & Manu, B. Utilization of textile mill sludge in burnt clay bricks. Int. J. Environ. Prot. 3 (5), 6–13 (2013).
-
Babu, G. R. & Ramana, V. N. Durability of bricks cast with industrial sludge. IOSR J. Mech. Civil Eng. 6 (4), 43–46 (2013).
-
Hegazy, B. E., Hanan, A. F. & Ahmed, M. H. Incorporation of water sludge, silica fume and Rice Husk Ash in Brick making. Adv. Environ. Res. 1 (1), 83–96 (2012).
-
Saijun, Z. Experiment on making Autoclaved Sludge bricks with Water-Treatment Plant Sludge. Science Research Fundamental Human Provincial Education Department IEEE. 6568–6571 (2011).
-
Ingunza, D. M. P., Anazsandra, C. L., Duarte & Nascimento, R. M. Use of sewage sludge as raw material in the manufacture of soft-mud bricks. J. Mater. Civ. Eng. 852–856 (2011).
-
Lin, D. F. & Weng, C. H. Use of sewage sludge ash as brick material. J. Environ. Eng. 127 (10), 922–927 (2001).
-
Rajgor, M. & Pitroda, J. Stone sludge: economical solution for manufacturing of bricks. Int. J. Innovative Technol. Exploring Eng. 2 (5), 16–20 (2013).
-
Tay, J. H., Show, K. Y. & Hong, S. Y. The application of industrial sludge and marine clay in brick-making. J. Chin. Inst. Environ. Eng. 11 (3), 203–208 (2001).
-
Victoria, A. N. Characterisation and performance evaluation of water works sludge as bricks material. Int. J. Eng. 3 (3), 69–79 (2013).
-
Kadir, A. A., Rahim, A. S. A., Hassan, M. I. H. & Abdullah, M. M. A. B. Physical and mechanical properties of bodymill sludge (BS) incorporated into fired clay brick. In IOP Conference Series: Materials Science and Engineering. Vol. 133(1). 012034 (2016).
-
Sidrak, F. G. Biofly brick-engineering reuse of fly ash and sewage sludge. Ph.D. Thesis. University of Wolonggong (Australia) (1996).
-
Herek, L. C. et al. Characterization of ceramic bricks incorporated with textile laundry sludge. Ceram. Int. 38 (2), 951–959 (2012).
-
Kadir, A. A. & Mohajerani, A. Bricks: An excellent building material for recycling wastes-a review. In Proceedings of the IASTED International Conference Environmental Management and Engineering. 108–115. (2011).
-
Detho, A. & Kadir, A. A. Evaluating Technical properties of fired clay Brick production with mosaic sludge: a comprehensive study on heavy metal leachability for sustainable environmental and economic benefits. J. Building Eng. 94, 110072 (2024).
-
Harwell, S. Overview of current approaches–Public meeting on waste leaching session iII-leaching science. In Proceedings of the Environment Protection Agency (1999).
-
Kim, H. B. Handbook of Stability Testing in Pharmaceutical Development (Springer, 2009).
-
Liu, B., Ray, A. S. & Thomas, P. Drying shrinkage of hydrothermally cured cements with reactive magnesia and clay brick waste. In International Inorganic-Bonded Fiber Composites Conference. 90–95 (2010).
-
Nwoye, C. I., Obidiegwu, E. O. & Mbah, C. N. Production of bricks for building construction and predictability of its post-fired volume shrinkage based on apparent porosity and water absorption capacity. Res. Reviews J. Mater. Sci. 2, 17–26 (2014).
-
Weng, C. H., Lin, D. F. & Chiang, P. C. Utilization of sludge as brick materials. Adv. Environ. Res. 7(3), 679–685 (2003).
-
ASTM (American Society of Testing Materials). ASTM C67 Standard Test Method for Sampling and Test Brick and Structural Clay Tile. Annual Book of ASTM Standards, Section 4, Construction, 04. 08, 04. 09, Soil and Rock (I) and (II) (ASTM, 1998).
-
Riza, F. V., Rahman, I. A. & Zaidi, A. M. A. A brief review of compressed stabilized earth brick (CSEB). International Conference on Science and Social Research, 2010. 999–1004 (2010).
-
Detho, A., Kadir, A. A. & Ahmad, S. Utilization of wastewater treatment sludge in the production of fired clay bricks: an approach towards sustainable development. Results Eng. 21, 101708 (2024).
-
Johari, I., Said, S., Hisham, B., Bakar, A. & Ahmad, Z. A. Effect of the change of firing temperature on microstructure and physical properties of clay bricks from Beruas (Malaysia). Sci. Sinter. 42 (2), 245–254 (2010).
-
Siefers, A. A novel and cost-effective hydrogen sulfide removal technology using tire derived rubber particles. Master Thesis. Iowa State University (2010).
-
PavÃa, S. & Hanley, R. Flexural bond strength of natural hydraulic lime mortar and clay brick. Mater. Struct. 43, 913–922 (2010).
-
Kayali, O. High performance bricks from fly ash. In Proceedings of the World of Coal Ash Conference. Vol. 11. 1–13. (2005).
-
Qiang, X. Nanoporous Materials: Synthesis and Applications (CRC Press, Taylor & Francais Group, 2013).
-
Gerić, M., Gajski, G., Oreš�anin, V., Kollar, R. & Garaj-Vrhovac, V. Chemical and toxicological characterization of the bricks produced from clay/sewage sludge mixture. J. Environ. Sci. Health Part. A. 47 (11), 1521–1527 (2012).
Acknowledgements
The authors extend their appreciation to the Deanship of Research and Graduate Studies at King Khalid University for funding this work through a Large Research Project under grant number RGP 2/163/45. The authors extend their appreciation to the Deanship of Scientific Research at Northern Border University, Arar, KSA for funding this research work through the project number NBU-FFMRA-2025-2105-02.
Author information
Authors and Affiliations
Contributions
Amir Detho: Conceptualization, Data curation, Formal analysis, Investigation, Methodology, Validation, Experimental work, Writing and original draft preparation.Aeslina Abdul Kadir, Ahmad Shayuti Bin Abdul Rahim, Nejib Ghazouani, Abdelkader Mabrouk, Ahmed Babeker Elhag, Hesham Hussein Rassem: Writing-Reviewing and Editing.
Corresponding authors
Ethics declarations
Competing interests
The authors declare no competing interests.
Consent to participate/consent to publish
All authors and participants consent to the publication of the paper and also to the publication of identifiable information/images in an online open access publication. All authors and participants have no conflict of interest.
Additional information
Publisher’s note
Springer Nature remains neutral with regard to jurisdictional claims in published maps and institutional affiliations.
Rights and permissions
Open Access This article is licensed under a Creative Commons Attribution-NonCommercial-NoDerivatives 4.0 International License, which permits any non-commercial use, sharing, distribution and reproduction in any medium or format, as long as you give appropriate credit to the original author(s) and the source, provide a link to the Creative Commons licence, and indicate if you modified the licensed material. You do not have permission under this licence to share adapted material derived from this article or parts of it. The images or other third party material in this article are included in the article’s Creative Commons licence, unless indicated otherwise in a credit line to the material. If material is not included in the article’s Creative Commons licence and your intended use is not permitted by statutory regulation or exceeds the permitted use, you will need to obtain permission directly from the copyright holder. To view a copy of this licence, visit http://creativecommons.org/licenses/by-nc-nd/4.0/.
About this article
Cite this article
Detho, A., Kadir, A.A., Shayuti, A. et al. Improvement of engineering properties and environmental impact of fired clay bricks utilizing industry sludge waste.
Sci Rep 15, 4820 (2025). https://doi.org/10.1038/s41598-025-89147-1
-
Received: 13 November 2024
-
Accepted: 03 February 2025
-
Published: 09 February 2025
-
DOI: https://doi.org/10.1038/s41598-025-89147-1
Keywords
Search
RECENT PRESS RELEASES
Related Post


