Incorporating genetic load contributes to predicting Arabidopsis thaliana’s response to climate change
March 20, 2025
Abstract
Understanding how species respond to climate change can facilitate species conservation and crop breeding. Current prediction frameworks about population vulnerability focused on predicting range shifts or local adaptation but ignored genetic load, which is also crucial for adaptation. By analyzing 1115 globally distributed Arabidopsis thaliana natural accessions, we find that effective population size (Ne) is the major contributor of genetic load variation, both along genome and among populations, and can explain 74-94% genetic load variation in natural populations. Intriguingly, Ne affects genetic load by changing both effectiveness of purifying selection and GC biased gene conversion strength. In particular, by incorporating genetic load, genetic offset and species distribution models (SDM), we predict that, the populations at species’ range edge are generally at higher risk. The populations at the eastern range perform poorer in all aspects, southern range have higher genetic offset and lower SDM suitability, while northern range have higher genetic load. Among the diverse natural populations, the Yangtze River basin population is the most vulnerable population under future climate change. Overall, here we deciphered the driving forces of genetic load in A. thaliana, and incorporated SDM, local adaptation and genetic load to predict the fate of populations under future climate change.
Introduction
Climate change deeply shapes the geographic range of diverse species, reduces biodiversity, and affects the survival of numerous species1,2. Understanding how species respond to climate change promotes species conservation and crop breeding.
Species distribution models (SDM) has been widely used to predict species range shift over time. However, SDM ignores evolutionary process. The evolutionary potential, namely, genetic diversity, affects the adaptation ability of natural populations to climate change3. Mutation facilitates the ability of species’ response to future climate change, but at the same time, could accumulate deleterious mutations and thus reduce fitness, which is called genetic load4,5. Accordingly, we can combine two strategies to study how species respond to climate change based on population genomics. One is to screen adaptive mutations, which is well-known and could speed up adaptation6,7,8. The other strategy is to evaluate genetic load (deleterious mutations) in the natural populations, in which high genetic load reduces fitness and adaptation potential9.
Many studies have revealed the genetic basis of local adaptation6,7,8, built the relationship of adaptive mutations and present climatic factors, and predicted the responses to future climate change based on the relationship10,11,12. Accordingly, one strategy of species conservation is to preserve functional genetic diversity associated with fitness13. However, adaptive mutations alone cannot determine the evolutionary fate of a population3,14. At genomic level, beneficial mutations are rare, and most mutations are neutral or deleterious5,15. The accumulation of deleterious mutations would reduce individual fitness, and accordingly, the potential for a population to respond to climate change would reduce if it had high genetic load3,16. Therefore, study of genetic load could benefit the prediction of species’ response to climate change and species’ resilience3,17. Nevertheless, most studies only focused on one aspect and ignored the other. Therefore, incorporating genetic load and other factors to predict climate change vulnerability is crucial for species conservation and crop breeding.
Knowing the driving forces of genetic load facilitates the assessment of population loss and species resilience. The accumulation of genetic load depends on selection coefficient, dominance coefficient and counts of deleterious mutations9. Given that selection coefficient and dominance coefficient estimation were still challenging, most studies focused on forces affecting deleterious allele counts. Deleterious allele counts was shaped by mutation, recombination, selection, genetic drift and GC biased gene conversion (gBGC)18,19. Effective population size (Ne) was demonstrated to affect genetic load via changing the effectiveness of selection relative to genetic drift20. Demographic history that reduces Ne, such as bottleneck effect21,22,23 or founder effect24, range expansion25, introgression from low Ne population26, mating system transition (from outcrossing to selfing)27 and polyploidization28, would induce relaxed purifying selection and increasing genetic load. gBGC mimic the effect of selection, lead to the fixation of G/C alleles, regardless of their fitness effect, thus possibly increasing the genetic load18,29,30. Recombination affects genetic load via two ways. On the one hand, Hill-Robertson effect would lead to the accumulation of deleterious mutations in low-recombination regions31,32. On the other hand, stronger gBGC strength in high recombination regions would increase genetic load29,33. However, the relative contribution of each factor in a single species is not clear.
Arabidopsis thaliana have a human commensal non-relict group spreading beyond its native range and become naturalized worldwide, and several relict groups, which reflects its success as a colonizing species34,35,36. It is generally interesting to reveal the mystery of its strong adaptation ability. The genetic basis of local adaptation has been explored in A. thaliana6,7,8 and used to predict the fate of different populations in response to future climate change11,12. In our study, we shifted our focus to genetic load to explore its variation and determinants along the genome and among diverse populations. We then integrated these findings with genetic offset and SDM to predict the vulnerability of different A. thaliana populations to climate change. Overall, our study highlights the driving forces of genetic load, and reveals how range shifts, adaptation and maladaptation jointly shaped the evolutionary fate of populations in response to climate change.
Results
Identification and characterization of deleterious mutations in natural populations
To study the genetic load of A. thaliana populations, we leveraged 1114 globally distributed non-reference natural accessions that had published resequencing data35,37,38,39,40,41. After SNP calling and quality control, we identified 8,678,999 homologous SNP sites with missing rate less than 10%. Using Arabidopsis lyrata and Capsella rubella as outgroups, we retained 2,958,899 SNP sites with determined ancestral and derived state for further analysis.
Because genetic load is hard to study based on fitness, here we measured with deleterious mutations derived from genomic sequences. We focused on SNPs in coding regions, and generated three datasets from the SNP datasets (Fig. 1A). The neutral datasets (fourfold degenerate sites) were used as control. Protein sequence conservation-based approaches were used to predict deleterious mutations from missense SNPs. For missense SNPs, we either grouped into tolerated missense SNPs (tnSNPs) and deleterious missense SNPs (dnSNPs) based on the prediction of PROVEAN or SIFT, or predicted the deleteriousness score of each SNP using LIST-S2, of which high score indicated high deleteriousness (Fig. 1A). Loss-of-function mutations (LoF), including stop-gain and splice site mutation, were included as the most deleterious SNP datasets (Fig. 1A).
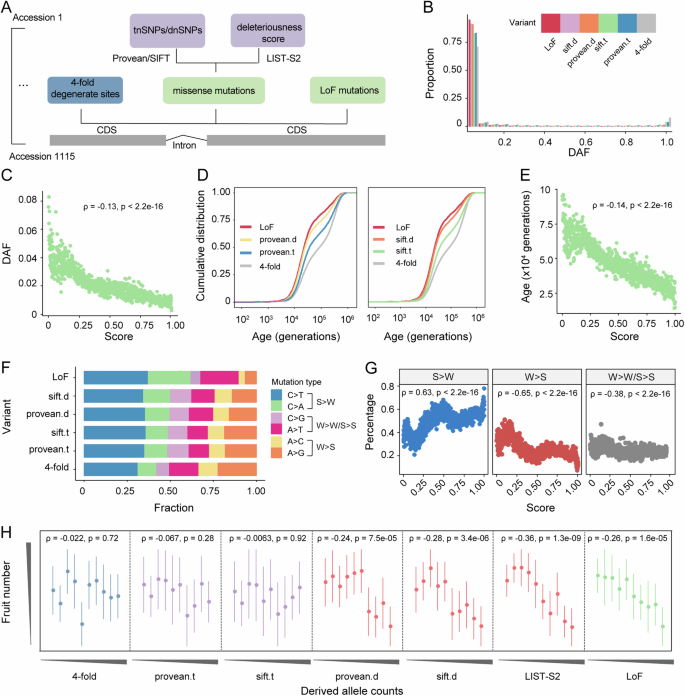
A Neutral and deleterious mutation datasets generated in this study. B The site frequency spectrum (SFS) of neutral and deleterious mutations. DAF, derived allele frequency. 4-fold, fourfold degenerate sites; provean.t, tolerated missense SNPs (tnSNPs) predicted by PROVEAN; provean.d, deleterious missense SNPs (dnSNPs) predicted by PROVEAN; sift.t, tnSNPs predicted by SIFT; sift.d, dnSNPs predicted by SIFT. C The Spearman’s correlation (two-sided) between deleteriousness score of missense mutations and derived allele frequency (DAF). Missense mutations were binned into 1000 equal sized bins according to their deleteriousness scores. D Age distribution of neutral and deleterious mutations. E The Spearman’s correlation between deleteriousness score of missense mutations and mutation age. Missense mutations were binned into 1000 equal sized bins according to their deleteriousness scores. F Mutation spectrum of neutral and deleterious mutations. G The Spearman’s correlation (two-sided) between deleteriousness score of missense mutations and mutation spectrum. S > W, strong (G/C) to weak (A/T) mutations; W > S, weak to strong mutations; W > W/S-S, weak to weak or strong to strong mutations. Missense mutations were binned into 1000 equal sized bins according to their deleteriousness scores. H The Spearman’s correlation (two-sided) between genetic load proxy and fitness related traits (fruit number). Genetic load proxy was calculated as the derived allele counts of dnSNPs or sum of deleteriousness score at individual level, as suggested by previous study62. Derived allele counts of neutral SNPs and tnSNPs were used as control. Derived allele counts increased from left to right, and fruit number increased from bottom to top. Accessions were binned into ten equal sized bins according to their derived allele count. n = 26 accessions for each bin, the last bin has 28 accessions. Error bars indicate mean +/−95% confidence intervals. Source data are provided as a Source Data file.
Consistent with the effects of purifying selection acting on deleterious mutations, the derived allele frequency (DAF) distribution suggested that LoF mutations and dnSNPs were more skewed toward low-frequency than neutral sites and tnSNPs, and the most deleterious LoF mutations had the rarest DAF (Fig. 1B). Similarly, the deleteriousness score of missense mutations were negatively correlated with DAF (Fig. 1C).
To reveal the age of deleterious mutations, we estimated their age using GEVA42, which could date variants based on the sequence divergence surrounding the variants. Due to the effect of purifying selection, deleterious mutations were eliminated quickly and were much younger than neutral sites and tnSNPs (Fig. 1D), which was consistent with that found in humans42,43. In addition, the most deleterious LoF mutations were much younger than dnSNPs (Fig. 1D), and the deleteriousness score of missense mutations were negatively correlated with the age (Fig. 1E).
The mutation spectrum (base composition) suggested that deleterious mutations had higher proportion of strong (G/C; indicating the three hydrogen bonds between bases) to weak (A/T; denoting the two hydrogen bonds between bases) alleles than weak to strong alleles, especially for the most deleterious LoF mutations (Fig. 1F). Similarly, missense mutations with higher deleteriousness score tended to be strong to weak (S > W) alleles rather than weak to strong (W > S) alleles (Fig. 1G). Given the mutation spectrum of de novo mutation in A. thaliana mutation accumulation (MA) lines is biased towards A/T alleles44,45, the enrichment of deleterious mutations in S > W mutations could be resulted from their relatively young age. While the enrichment of W > S mutations in neutral sites and tnSNPs probably reflect the effect of gBGC, which tend to fix G/C alleles and thus the older mutations would accumulate W > S alleles. gBGC is expected to cause a right-shifted site frequency spectrum of W > S mutations29. Accordingly, we observed an excess of high-frequency W > S mutations (Supplementary Fig. 1A), indicating the impact of gBGC. In addition, high-recombination regions were enriched with W > S mutations (Supplementary Fig. 1B), which probably result from gBGC or purging of deleterious mutations in high-recombination regions. Although gBGC was assumed to be weak or absent in selfing species, it was directly observed or reported in A. thaliana in previous studies30,46,47.
To explore the relationship between genome sequence derived genetic load proxy (the derived allele counts of deleterious mutations) and fitness consequences, we used published fruit number phenotype, which is cultivated and measured in greenhouse, and is a proxy for lifetime fitness in annual species48. There was a generally negative correlation between genetic load proxy and fruit number (Fig. 1H), even after implementing a control for population structure (p = 0.00471 for LIST-S2 and p = 0.01 for LoF mutations, Supplementary Table 1). While the correlation between derived allele counts of neutral sites or tnSNPs and fruit number were not significant (Fig. 1H). Overall, we identified a deleterious mutation dataset and bridged the gap between sequence based genetic load proxy and fitness consequences, which was rarely demonstrated in previous studies of deleterious mutations in natural populations9.
Determinants of genetic load variation along the genome
Although genetic load was much more extensively studied across populations, the variation, determinants and their relative contribution of genetic load along different genomic regions is largely unknown. In addition, parameters such as mutation rate and recombination rate were available at different genomic regions but not different populations. To study the determinants and their relative contribution to genetic load variation along genome, we split A. thaliana genome into multiple non-overlapping 50 kb windows, and estimated genetic load in each window. We scaled the derived allele count of deleterious mutations with that of fourfold degenerate sites, and used it as genetic load proxy, to exclude the confounding effects of linked selection, which makes the unscaled counts reflects polymorphisms rather than genetic load49,50.
The potential evolutionary forces that shape the genetic load variation include mutation, recombination, selection, genetic drift and gBGC18,19. Accordingly, mutation rate and recombination rate estimated from de novo mutations and crossover map could measure the strength of mutation and recombination44,51, Ne measured with fourfold degenerate sites diversity (πs) could reflect the effectiveness of purifying selection20, and the ratio of DAF of W > S mutations to that of S > W mutations (W > S/S > W) represent gBGC strength30. We estimated these four parameters in each window, and used as predictor variables to evaluate their impact on genetic load. To this end, we used 1,986 windows with all predictors and genetic load proxies available.
πs was negatively correlated with genetic load, except for LoF mutations (Fig. 2A), suggesting low selection efficiency in low-diversity region. Ne varies along genome, and depends on recombination rate and density of selected sites52. Accordingly, recombination rate was positively correlated with πs and negatively correlated with genetic load (Supplementary Fig. 1C and Fig. 2B). Recombination reduces genetic load via Hill-Robertson effect, but at the same time increases genetic load via gBGC29,31,32. The negative correlation between recombination rate and genetic load (except for LoF mutation) indicated that recombination affects genetic load mainly via Hill-Robertson effect rather than gBGC in A. thaliana. Similarly, several previous studies on other plants also found the negative correlation between recombination rate and genetic load53,54,55,56. In contrast to the intuition that high-mutation region would accumulate more mutations, regardless of fitness effects, we found that mutation rate was negatively correlated with genetic load (Fig. 2C). Given the positive relationship between mutation and recombination (Supplementary Fig. 1D), it probably results from the purging of deleterious mutations in high recombination regions.
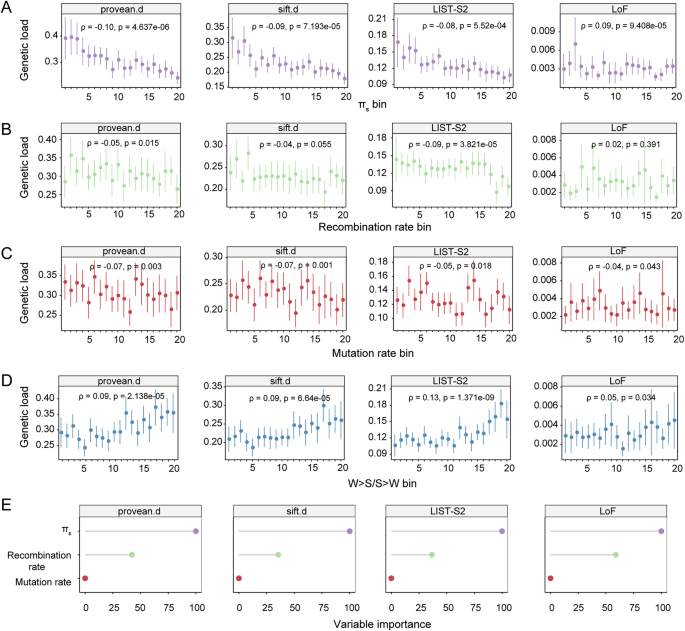
A Spearman’s correlation (two-sided) between πs and genetic load proxies. πs, the nucleotide diversity at fourfold degenerate sites, used as the proxy of effective population size. B Spearman’s correlation (two-sided) between recombination rate and genetic load proxies. C Spearman’s correlation (two-sided) between mutation rate and genetic load proxies. D Spearman’s correlation (two-sided) between W > S/S > W and genetic load proxies. W > S/S > W, ratio of derived allele frequency (DAF) of weak (A/T) to strong(G/C) (WS) alleles to the strong to weak (SW) alleles. E Variable importance of each predictor variable. Scaled permutation based variable importance from random forest model was used as the importance value. provean.d, deleterious missense SNPs (dnSNPs) predicted by PROVEAN; sift.d, dnSNPs predicted by SIFT; LIST-S2, missense mutations with deleteriousness score from LIST-S2. LoF, loss-of-function mutations. Error bars represent mean +/− 95% confidence intervals. Each predictor was grouped into 20 equal-sized bins (n = 100 windows for each bin, the last bin has 86 windows) in ascending order. Source data are provided as a Source Data file.
In terms of the effect of gBGC, W > S/S > W was positively correlated with genetic load (Fig. 2D), similar to the reported deleterious mutation accumulation in high W > S/S > W regions30. However, we found that W > S/S > W was higher in low-recombination rather than high-recombination regions as usually expected (Supplementary Fig. 1E). We also estimated gBGC strength using relative rate of fixation of W > S substitutions compared to W > W substitutions, as previously reported29, and also found that it was higher in low-recombination regions (Supplementary Fig. 1F). Accordingly, GC content was higher in low-recombination regions (Supplementary Fig. 1G), and the reason remains unclear.
Based on the non-linear relationship between most predictor variables and genetic load, we fitted a random forest regression model on genetic load proxy, and evaluated the relative contribution of each predictor variable based on the permutation based variable importance. W > S/S > W was not included in the model, considering its unresolved relationship with recombination. The random forest model suggested that πs was the most important contributor, and the second is recombination rate, while mutation rate has the least importance (Fig. 2E). Taken together, genomic regions with low πs and low recombination rate would accumulate much more deleterious mutations.
Determinants of genetic load variation among populations
To determine forces shaping genetic load variation among populations, we only consider Ne and gBGC, because it was difficult to estimate mutation rate and recombination rate variation among populations only based on population polymorphism data57,58. The impact of Ne on genetic load variation has been extensively studied under different demographical scenarios in diverse organisms21,22,23. In A. thaliana, a human commensal non-relict group originated near Balkans has experienced post-glacial range expansion and thus is a great model to study the effect of Ne on genetic load variation36,59. We mainly focused on the east-west expansion across Eurasia, and excluded North America population, which was introduced recently and admixture among introduced lineages increased haplotype diversity and reduced genetic load60.
The population history estimation using SMC++ suggested that populations at the expansion front, such as Yangtze River basin population (Yangtze), North Sweden population (N. Sweden) and Northwestern China and Central Asia population (NW. China & C. Asia) have undergone severe bottleneck effects and have smaller Ne compared to their origin population Balkans (Supplementary Fig. 2A). Consistently, the nucleotide diversity at fourfold degenerate sites (πs), which could reflect long-term Ne61, coincided with the population history estimation (Supplementary Fig. 2B). Therefore, πs was used as the Ne proxy in further analysis.
Using derived allele count of deleterious mutations as genetic load proxy, as suggested by a previous study62, both deleterious missense mutations and LoF mutations accumulated with elevated distance to the putative origin of non-relict expansion36, and the most distant Yangtze River basin population accumulated the highest genetic load (Fig. 3A). Previous studies based on small sets of accessions also found that marginal populations accumulated more deleterious mutations37,63. 1001 Genomes Project also found that populations in Sweden and Central Asia have more nonsynonymous mutations and LoF mutations35. Because genetic load estimates probably differs using different load proxies9,62, to validate the robustness of our results to different load proxies, we also used two other load proxies, ratio of derived allele count of deleterious mutations to that of neutral sites and RA/B. RA/B measures the relative derived allele counts of dnSNPs that occur more often in the expanded populations than that in Balkans55. The results suggested that our conclusion was robust (Supplementary Fig. 2C, D).
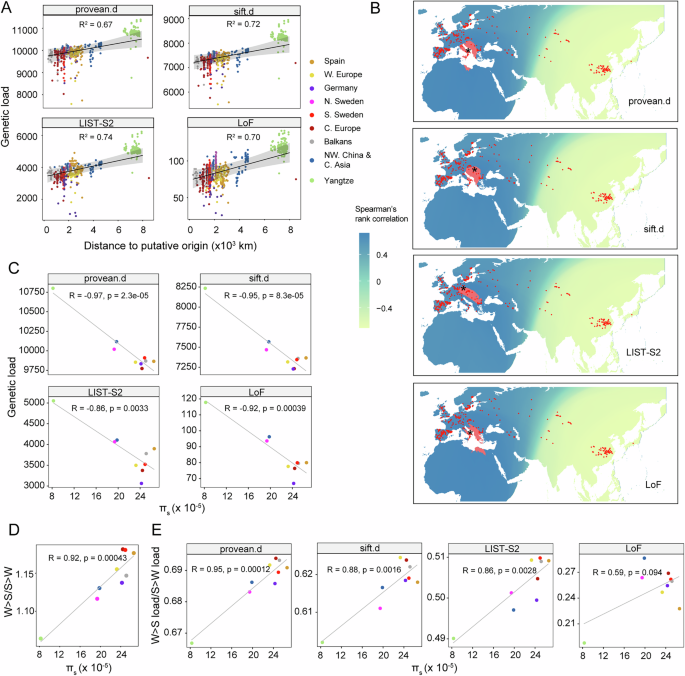
A Spatial regression between genetic load and distance to putative origin. The regression model was built with the “spaMM� (4.4.16) package of R96. The shaded area was 95% confidence intervals around predictions while controlling for spatial effects. B Prediction of the origin of non-relict populations based on genetic load. Red denotes areas with top 1% correlation. Black star is the most likely origin. Color scale represents Spearman’s rank correlation (two-sided) between distance to each tested putative origin and genetic load. Red dots represent the non-relict accessions used in this study. C Pearson’s correlation (two sided) between genetic load and πs. πs, the nucleotide diversity at fourfold degenerate sites, used as the proxy of effective population size (Ne). D Pearson’s correlation (two sided) between GC biased gene conversion (gBGC) strength and πs, gBGC strength (W > S/S > W) was calculated as the derived allele frequency of W > S mutations to that of S > W mutations. πs used as the proxies of Ne. E Pearson’s correlation (two sided) between the ratio of weak to strong (W > S) load to strong to weak (S > W) load and πs. provean.d, deleterious missense SNPs (dnSNPs) predicted by PROVEAN; sift.d, dnSNPs predicted by SIFT; LIST-S2, missense mutations with deleteriousness score from LIST-S2. Source data are provided as a Source Data file.
Because the origin of non-relict populations was putative based on polymorphism36, here we predicted the origin of non-relict populations based on expansion load, by maximizing the pattern in Fig. 3A. Briefly, genetic load increases with range expansion, and areas with high positive correlation between expansion distance and genetic load are more likely to be the origin. The results suggested that Balkans is the most likely origin for non-relict expansion (Fig. 3B), similar to the prediction based on polymorphism36.
In terms of the impact of Ne on genetic load, πs was negatively correlated with genetic load, and could explain 74–94% genetic load variation among populations, depending on deleterious mutation types (Fig. 3C). Since Yangtze River basin population appears as an outlier, we removed it to see if the correlation is still present. The results suggested that the correlation between πs and genetic load is robust, although to a lesser extent (Supplementary Fig. 2E). Consistently, previous study based on 80 accessions also found that Ne greatly affected deleterious mutation accumulation37. Populations at the expansion front, which also have the smallest Ne, such as Yangtze River basin population, N. Sweden population and NW. China & C. Asia population, accumulated the highest genetic load (Fig. 3C). Consistently, fixed load was higher in populations with more severer bottlenecks (Supplementary Fig. 3), indicating the less efficient purifying selection and the stronger genetic drift in these populations.
To explore the impact of gBGC on genetic load, we split genetic load into three types (W > S, S > W and W > W/S > S) based on base composition, and only the first two could be affected by gBGC. As a directional force, the strength of gBGC was counteracted by random drift. Therefore, Ne was expected to affect gBGC strength, which has been reported in human and mammals64,65. Consistently, we found the fraction of W > S load was positively correlated with πs, S > W load was negatively correlated with πs, while that of W > W/S > S load was not correlated with πs (Supplementary Fig. 4A–C). In addition, W > S/S > W was positively correlated with πs (the correlation is robust to Yangtze outlier, Supplementary Fig. 4D), indicating that larger populations would have stronger gBGC strength (Fig. 3D). To explore if Ne contributes to gBGC load variation across A. thaliana populations, we used the ratio of W > S load to S > W load as gBGC load, and found that πs was positively correlated with gBGC load (Fig. 3E), and the correlation is robust to Yangtze outlier (Supplementary Fig. 4E), suggesting that larger populations accumulated higher gBGC load. Taken together, Ne contributes to genetic load variation via regulating both the effectiveness of purifying selection and gBGC strength. Nevertheless, the purging of deleterious mutations by purifying selection overwhelms the fixation of deleterious mutations by gBGC in populations with large Ne, in terms of the overall negative correlation between πs and genetic load.
Incorporating genetic load to predict climate change vulnerability
To predict the fate of different A. thaliana populations under future climate change, we incorporated SDM, genetic offset and genetic load. SDM ignores evolutionary process, genetic offset is a measure of maladaptation based on adaptive alleles. However, the fate of a species depends on more than just adaptive alleles. Populations with same genetic offset might differ in genetic load3. By integrating the three factors, we could capture the complexities of evolutionary process and more precisely evaluate the climate change vulnerability.
To estimate the change of habitat, using MaxEnt implemented with ENMeval, we modeled present distribution of A. thaliana and projected into future based on future climate (2040–2060 and 2080–2100) under SSP245 emissions scenario, which is a realistic future scenario that aligns with the current global policies and the level of emission reduction efforts66. According to present distribution of A. thaliana, a suitability threshold 0.25 match the distribution of most accessions (Supplementary Fig. 5A), as suggested by a previous study67. Consistent with previous studies67,68, the modeling and projection suggested that future habitat suitability would become worse for southern region, while northern region would get much better (Fig. 4A and Supplementary Fig. 5B).
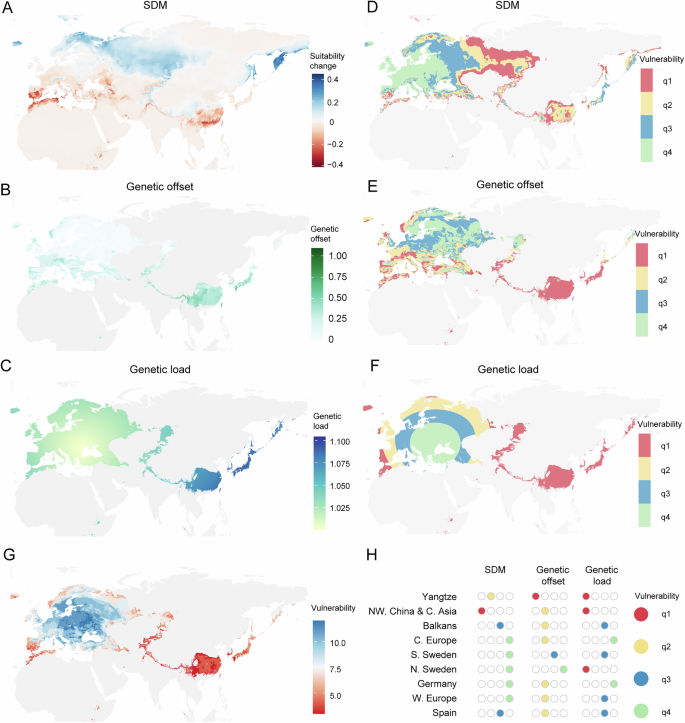
A Habitat suitability change (future-present) between future and present. Suitability was projected from species distribution models (SDM). B Genetic offset based on 2040–2060 SSP245 projections. We only showed regions with present suitability greater than 0.25, as the threshold matches the distribution of most accessions. C Genetic load projected with the spatial regression of genetic load and distance to putative origin. Genetic load was calculated using deleterious mutations predicted by PROVEAN, and normalized with the genetic load of putative origin. D Climate change vulnerability based on SDM. Vulnerability decreases from q1 to q4. E Climate change vulnerability based on genetic offset. Vulnerability decreases from q1 to q4. F Climate change vulnerability based on genetic load. Vulnerability decreases from q1 to q4. G Incorporating SDM, genetic offset and genetic load to predict the fate of different populations. We added the rank of each factor, low rank value indicates high risk, while high rank value indicates low risk. H Vulnerability of nine non-relict populations based on the integration of SDM, genetic offset and genetic load.
To incorporate local adaptation into prediction framework, we identified climate associated adaptive SNPs, built the correlations between allele frequency of adaptive SNPs and 19 bioclimatic variables using gradient forest, and projected allele frequency into future based on future climate (2040–2060 and 2080–2100) under SSP245 emissions scenario. The allele frequency shift between future and present, we termed genetic offset, varied along space and time, with southern range, especially the eastern range reached higher genetic offset, indicating higher vulnerability in these regions (Fig. 4B and Supplementary Fig. 5C).
It is challenging to predict future genetic load based on climate change, because genetic load accumulates over many generations, while climate shifts in a few generations. Therefore, we only incorporate current genetic load to assess the vulnerability of different populations. Based on the spatial regression between distance to putative origin and genetic load (Fig. 3A), we projected genetic load on the map. We also utilized Kriging interpolation method to predict load across the landscape, which allow greater flexibility to account for some of the variability in load estimated. The projection indicated that the eastern range accumulated much higher genetic load, regardless of the deleterious mutation types and projection methods used (Fig. 4C and Supplementary Fig. 5D–G). Consequently, for the following analysis, we used only deleterious mutations predicted by PROVEAN to project genetic load based on spatial regression.
To integrate SDM, genetic offset and genetic load into a prediction framework, we made a sensitivity analysis, by setting different thresholds of SDM suitability, genetic offset and genetic load. We only retained regions with present suitability greater than 0.25 to set different thresholds. For each factor, we used quartiles as the threshold, and divided each map into four vulnerability regions. The vulnerability map suggested that southern Spain, Central Asia and eastern range have higher vulnerability in terms of SDM (Fig. 4D and Supplementary Fig. 6A). Southern and eastern range have higher vulnerability in terms of genetic offset (Fig. 4E and Supplementary Fig. 6B). Northern and eastern range have higher vulnerability in terms of genetic load (Fig. 4F).
Taking these three factors together, we sequentially added the vulnerability rank, and predicted that the eastern range was the most vulnerable region, and populations at the range edge are more vulnerable to climate change (Fig. 4G and Supplementary Fig. 6C). In terms of the nine non-relict populations, Yangtze and NW. China & C. Asia population are the most vulnerable populations, Balkans and Spain are the second, N. Sweden and W. Europe are the third, while C. Europe, S. Sweden and Germany are the least concerned populations (Fig. 4H and Supplementary Fig. 6D).
Discussion
Climate change threatens biodiversity. Understanding how species respond to climate change paves the way to species conservation and crop breeding. In this study, we incorporated SDM, local adaptation and genetic load to predict the fate of different A. thaliana populations in response to climate change. In particular, we comprehensively dissected the driving forces of genetic load variation, both along different genomic regions and among populations, and integrated genetic load to predict the fate of different populations. Our study showed that the integration of SDM, local adaptation and genetic load, instead of only local adaptation or SDM, could add valuable insight on predicting the fate of natural populations, which will be important for the crop breeding and species conservation.
It is common to estimate genetic load via counting deleterious mutations, but there is a gap between sequence derived load proxy and fitness consequence9,69, although the negative correlation has been observed between deleterious mutation number and fitness related traits in crops70,71,72. Here we filled this gap by observing the significant negative correlation between load proxy and fruit number. Nevertheless, it remains unclear how much fraction of the fitness variation could be ascribed to genetic load. Some of the variation in fitness could also be related to environment adapted alleles and their match or mismatch to the greenhouse environment. In addition, we only focused on coding SNPs, noncoding SNPs and structural variations could also contribute substantially to total genetic load and phenotypic variation40,70,73. Therefore, future study incorporating all these variants are appreciated to improve our understanding of the role of genetic load in fitness and species conservation.
To decipher the driving forces of genetic load, we considered population genetic processes affecting genetic load and their relative contribution both along different genomic regions and among different populations, while most studies focused on only one or two of these processes and paid much attention to population level variation. At different genomic region level, we measured the relative contribution of each process and found that Ne was the major contributor. At population level, Ne could explain 74–94% genetic load variation among populations, depending on the deleterious mutation types. Previous studies conducted within species and among species also highlighted the important role of Ne on genetic load22,24,25,74. Particularly, we found that the impact of Ne on genetic load not only depends on the effectiveness of purifying selection, but also gBGC strength, which was in contrast to the traditional view that Ne affected genetic load only via effectiveness of purifying selection. Therefore, large populations purge drift load and meanwhile accumulate gBGC load, but purging was much stronger than accumulating. The positive correlation between Ne and gBGC strength was also reported in human and mammals64,65. However, the correlation between Ne and gBGC strength was not always monotonous in other species75.
Genetic load accumulated with the increased distance to putative origin, similar to the study in human25. Utilizing the relation between distance and genetic load, we speculated the origin of non-relict populations, which is similar to that predicted with population polymorphisms36. Accordingly, we projected genetic load across the map based on distance to origin, and leveraged this information to predict population loss, based on the assumption that populations with higher genetic load have less potential to respond to climate change. Due to the contrast between long-term accumulation of genetic load and rapid shift of climate, predicting future genetic load based on climate change is still a challenge. Although the distance to niche centroid has been utilized to predict genetic load3, it is just a gross approximation.
Incorporating SDM, local adaptation and genetic load could provide comprehensive insights on predicting the climate change vulnerability of A. thaliana populations. Focusing on only one of them, one would be biased in making conservation strategies13,14. In our study, predictions based solely on SDM or genetic offset might suggest that the N. Sweden population is safe, but when genetic load is considered, it may indicate an increased risk for this population. Nevertheless, except for SDM, local adaptation and genetic load, other factors, such as gene flow of adaptive or maladaptive alleles, the dispersal potential of populations, could also affect the response ability of populations to climate change3.
More importantly, systematic integration of all these factors is still a challenge. A previous study introduced the FOLDS model, which could integrate multiple factors and apply empirical thresholds to different factors3. Nevertheless, empirical thresholds were still much ambiguous, and determining the weight of each process is difficult. Here we assigned risk levels for each factor based on quartiles, and summed them to assess the relative risk of each population. Although in its early stages, it can be readily used in conservation and management, with the flexibility to incorporate additional processes. Future study systematically integrated all these factors would enable more precise prediction of the evolutionary fate of populations. Overall, our study highlighted the importance of integration of SDM, local adaptation and genetic load on species conservation and crop breeding.
Methods
Datasets and population structure
The whole genome resequencing data of 1,114 globally distributed A. thaliana non-reference accessions were retrieved from previous studies35,37,38,39,40,41. The 1114 non-reference accessions were composed of one relict group and ten non-relict populations40.
Paired end reads of the 1114 non-reference accession were first aligned to the reference genome using BWA (0.6.2)76. Following alignment, the “rmdup� function of Samtools (0.1.18)77 was employed to eliminate duplicate reads resulting from library preparation or sequencing. SNPs were called using Genome Analysis Toolkit (GATK 2.5)78. Additional filtering of raw SNPs was conducted using the “VariantFiltration�, applying criteria such as quality score (Q)  ≥  30, mapping quality (MQ)  ≥  20, quality-by-depth ratio (QD)  ≥  10, ReadPosRankSum ≥ −8.0, depth coverage (DP)  ≥  3, strand bias probability (FS)  ≤  10.0, and having no more than three SNPs within a 10 bp window. Only homozygous SNPs with missing rate less than 10% were used for further analysis. Allele state of each SNP site was determined based on the whole genome alignment of Col-0 (TAIR10) to Arabidopsis lyrata (MN47, v1)79 and Capsella rubella (MTE, v1)80 using LASTZ (1.04.00)81. Ancestral alleles were defined as those that matched in both A. lyrata and C. rubella, while derived alleles were those where A. lyrata and C. rubella had identical states, but A. thaliana did not match them.
Deleterious mutation identification
SNPs were annotated with SnpEff(v4.3t)82. PROVEAN (1.1.5)83, SIFT 4G84 and LIST-S2 (1.10)85 were used to predict deleterious missense SNPs. For each SNP site, the derived allele was submitted for prediction. NCBI nonredundant protein database86, Uniref9087 and UniProt TrEMBL/SwissProt were used as the reference database of PROVEAN, SIFT 4G and LIST-S2, respectively, as recommended by these softwares. In PROVEAN prediction, missense SNPs with score ≤ −2.5 were defined as deleterious SNPs (dnSNPs), while SNPs with score > −2.5 were defined as tolerated SNPs (tnSNPs). In SIFT 4G prediction, missense SNPs with score <0.05 were defined as deleterious SNPs (dnSNPs), while SNPs with score ≥0.05 were defined as tolerated SNPs (tnSNPs). In LIST-S2 prediction, the score ranges from 0 to 1, higher score indicates higher deleteriousness. Loss of function (LoF) mutations (including stop-gain and splice site mutation) were obtained from our previous study40.
SNP age estimation
For each non-singleton SNP site with determined ancestral state and passed our quality and missing rate control, GEVA (v1beta)42 was used to estimate age distribution. Although in human, a species level parameter of Ne and mutation rate was used42, different populations have varied Ne and mutation rate. In A. thaliana, Ne and mutation rate were estimated to be about 300,000 and 7e−9 per site per generation in previous studies37,44,45.
To test the impact of parameter setting on robustness of age estimation, we randomly selected 1000 SNP sites from the genome, and estimated their age with gradient Ne (from 100,000 to 500,000) and mutation rate (from 5e−9 to 9e−9) setting that fluctuating around the species level parameter. When we evaluated the impact of Ne, mutation rate was set as 7e−9, and for the impact of mutation rate, Ne was set as 300,000. The evaluation suggested that age estimation was robust to parameter setting, based on their high correlation under different parameter setting (Supplementary Fig. 7). Therefore, we used the species level parameter “–Ne 300000â€� and “–mut 7e-9â€� to estimate SNP age. The mean of the composite posterior distribution under joint model was used as the age estimates for a given SNP site.
Genetic load proxy calculation
For population level comparison, three genetic load proxies were calculated, derived allele count of deleterious mutations, ratio of derived allele count of deleterious mutations to that of neutral sites and RA/B (a relative measure of dnSNPs frequency enhancement). For PROVEAN and SIFT 4G predictions, derived allele count was calculated as the derived allele count of dnSNPs. For LIST-S2 predictions, derived allele count was calculated as the sum of deleteriousness scores. RA/B was calculated as previously described55 between the putative origin Balkans and other non-relict populations to measure the relative derived allele counts of dnSNPs that occur more often in the expanded populations than in Balkans.
Random forest modeling for determinants of genetic load variation along the genome
For comparison along different genomic regions, the reference genome was divided into non-overlapping 50 kb windows, and genetic load proxy was calculated in each window. The ratio of derived allele counts of deleterious mutations to that of fourfold degenerate sites, instead of derived allele count of deleterious mutations, was used as genetic load proxy, considering the varied strength of linked selection along genome.
Mutation rate in each window was calculated from the de novo mutations from 107 mutation accumulation lines44. Recombination rate at each window was estimated from a crossover map in 17 F2 populations derived from 18 A. thaliana lines51. Ne of each window was calculated as the nucleotide diversity of fourfold degenerate sites (πs)52. The strength of GC-biased gene conversion (gBGC) in each window was measured with the ratio of derived allele frequency of weak-to-strong (W > S) mutations to that of strong-to-weak (S > W) mutations (W > S/S > W), as previously suggested30.
To analyze the impact of four predictors (mutation rate, recombination rate, πs and W > S/S > W) on genetic load, 1986 windows with all these parameters were used. Each predictor was ranked and split into 20 equal sized bins, and Spearman’s rank correlation test was performed to test the relationship between these predictors and genetic load proxy.
Random forest model implemented with R package “caret� (6.0.94) (method = “ranger�) was fitted on genetic load proxies of each window to explore the relative contribution of mutation rate, recombination rate, and πs to genetic load variation along the genome88. A fivefold cross-validation procedure was used to evaluate the accuracy of model, by using 70% of the datasets as training data, and the remained 30% as testing data. The scaled permutation based variable importance for each predictor was obtained from the random forest model “varImp� function and used to measure their contribution.
Population history and N
e estimation
SMC++(v1.15.4)89 was used to estimate the historical population size in each population. As A. thaliana is a selfing species, for each population, 20 pseudo-diploid genotypes were generated by randomly selecting 40 individuals. Mutation rate was set to 7e−9 based on previous studies44,45, and the timepoints was set to “100 100000�. Composite likelihood was formed by create five distinct datasets, by varying the identity of the distinguished individual and treating the remaining samples as “undistinguished�.
Predicting the origin of non-relict expansion based on expansion load
A map with 10 arc-minutes geographic resolution was downloaded from worldclim v2, and the range was limited to 20 W to 160 E, and 0 to 69 N, based on the distribution of non-relicts. Each coordinate on the map was assumed to be the origin, and distances from the putative origin to non-relict accessions were calculated with ‘rdist.earth’ function in the “fields� (14.1) package of R. The Spearman’s rank correlation between distance and genetic load was calculated for each putative origin, and plotted on the map. The top 1% region with the highest correlation was defined as the putative origin area, and coordinates with the highest correlation was assigned as the most likely origin.
Species distribution modeling
To model the species distribution of A. thaliana, occurrence data from Global Biodiversity Information Facility (GBIF) and accessions used in this study were used. The occurrence data was further thinned to one sample per 50 km using the “poThin� function of “RSpatial� (0.3.0) package of R to reduce sampling bias.
19 bioclimate variables of present and future (2040–2060 and 2080–2100 under SSP245 emissions scenario) were downloaded from worldclim v2. To achieve a balance between reducing multicollinearity and retaining meaningful variability, we selected Bio3, Bio6, Bio7, Bio8, Bio10, Bio15, Bio16 and Bio17 for modeling. These variables were chosen based on their relatively low correlation (Pearson’s correlation coefficients among variables <0.75) and hypothesized importance, as previously described67. MaxEnt was used to model species distribution90. “ENMeval� (0.3.1) package of R91 was used to optimize parameters of MaxEnt, using “randomkfold� for cross validation. Model with the lowest Akaike information criterion (AIC) value was used to build and project species distribution under present and future climate.
Genetic offset calculation
“pcadapt� (4.3.3) package92, latent factor mixed models (LFMM) model from “LEA� (2.8.0) package93 and omegaplus (3.0.3)94 were used to scan adaptive SNPs (SNPs with top 5% score), respectively. SNPs identified as adaptive SNPs by all software were regarded as the adaptive SNP datasets. Random SNP datasets was generated by randomly sampling the same number of SNPs as the adaptive SNP datasets. The correlation between allele frequency and 19 bioclimate variables from worldclim v2 was built, and genetic offset, the Euclidean distance between present and future values, in future climate (2040–2060 and 2080–2100) under SSP245 emission scenarios was projected with the “gradientForest� (0.1.32) package95.
Statistical analyses
All statistical analyses were performed in R.
Data availability
The whole genome sequencing data used in this study are retrieved from the following database under these accession codes, NCBI SRP056687 (https://www.ncbi.nlm.nih.gov), ENA PRJEB19780 (https://www.ebi.ac.uk/ena/browser/home), NCBI SRP062811, GSA: CRA008569 (https://ngdc.cncb.ac.cn/gsa). Source data are provided as a Source Data file. Source data are provided with this paper.
Code availability
All code for analysis is available at https://github.com/juanj64/Genetic-load.
References
-
Parmesan, C. & Yohe, G. A globally coherent fingerprint of climate change impacts across natural systems. Nature 421, 37–42 (2003).
-
Urban, M. C. Accelerating extinction risk from climate change. Science 348, 571–573 (2015).
-
Aguirre-Liguori, J. A., Ramirez-Barahona, S. & Gaut, B. S. The evolutionary genomics of species’ responses to climate change. Nat. Ecol. Evol. 5, 1350–1360 (2021).
-
Haldane, J. B. S. The effect of variation on fitness. Am. Nat. 71, 337–349 (1937).
-
Ohta, T. Slightly deleterious mutant substitutions in evolution. Nature 246, 96–98 (1973).
-
Hancock, A. M. et al. Adaptation to climate across the Arabidopsis thaliana genome. Science 334, 83–86 (2011).
-
Fournier-Level, A. et al. A map of local adaptation in Arabidopsis thaliana. Science 334, 86–89 (2011).
-
Ferrero-Serrano, A. & Assmann, S. M. Phenotypic and genome-wide association with the local environment of Arabidopsis. Nat. Ecol. Evol. 3, 274–285 (2019).
-
Bertorelle, G. et al. Genetic load: genomic estimates and applications in non-model animals. Nat. Rev. Genet. 23, 429–503 (2022).
-
Bay, R. A. et al. Genomic signals of selection predict climate-driven population declines in a migratory bird. Science 359, 83–86 (2018).
-
Exposito-Alonso, M. et al. Genomic basis and evolutionary potential for extreme drought adaptation in Arabidopsis thaliana. Nat. Ecol. Evol. 2, 352–358 (2018).
-
Exposito-Alonso, M. et al. Natural selection on the Arabidopsis thaliana genome in present and future climates. Nature 573, 126–129 (2019).
-
Teixeira, J. C. & Huber, C. D. The inflated significance of neutral genetic diversity in conservation genetics. Proc. Natl Acad. Sci. USA 118, e2015096118 (2021).
-
Kardos, M. et al. The crucial role of genome-wide genetic variation in conservation. Proc. Natl Acad. Sci. USA 118, e2104642118 (2021).
-
Eyre-Walker, A. & Keightley, P. D. The distribution of fitness effects of new mutations. Nat. Rev. Genet. 8, 610–618 (2007).
-
Nadeau, C. P. & Urban, M. C. Eco-evolution on the edge during climate change. Ecography 42, 1280–1297 (2019).
-
Van Oosterhout, C. Mutation load is the spectre of species conservation. Nat. Ecol. Evol. 4, 1004–1006 (2020).
-
Glemin, S. Surprising fitness consequences of GC-biased gene conversion: I. Mutation load and inbreeding depression. Genetics 185, 939–959 (2010).
-
Hamilton M. B. Population genetics (John Wiley & Sons, 2021).
-
Charlesworth, B. Fundamental concepts in genetics: effective population size and patterns of molecular evolution and variation. Nat. Rev. Genet. 10, 195–205 (2009).
-
Marsden, C. D. et al. Bottlenecks and selective sweeps during domestication have increased deleterious genetic variation in dogs. Proc. Natl Acad. Sci. USA 113, 152–157 (2016).
-
Kleinman-Ruiz, D. et al. Purging of deleterious burden in the endangered Iberian lynx. Proc. Natl Acad. Sci. USA 119, e2110614119 (2022).
-
Gaut, B. S., Seymour, D. K., Liu, Q. & Zhou, Y. Demography and its effects on genomic variation in crop domestication. Nat. Plants 4, 512–520 (2018).
-
Wang, L. et al. The interplay of demography and selection during maize domestication and expansion. Genome Biol. 18, 215 (2017).
-
Henn, B. M. et al. Distance from sub-Saharan Africa predicts mutational load in diverse human genomes. Proc. Natl Acad. Sci. USA 113, E440–E449 (2016).
-
Harris, K. & Nielsen, R. The genetic cost of neanderthal introgression. Genetics 203, 881–891 (2016).
-
Laenen, B. et al. Demography and mating system shape the genome-wide impact of purifying selection in Arabis alpina. Proc. Natl Acad. Sci. USA 115, 816–821 (2018).
-
Conover, J. L. & Wendel, J. F. Deleterious mutations accumulate faster in allopolyploid than diploid cotton (Gossypium) and unequally between subgenomes. Mol. Biol. Evol. 39, msac074 (2022).
-
Lachance, J. & Tishkoff, S. A. Biased gene conversion skews allele frequencies in human populations, increasing the disease burden of recessive alleles. Am. J. Hum. Genet. 95, 408–420 (2014).
-
Hamala, T. & Tiffin, P. Biased gene conversion constrains adaptation in Arabidopsis thaliana. Genetics 215, 831–846 (2020).
-
Felsenstein, J. The evolutionary advantage of recombination. Genetics 78, 737–756 (1974).
-
Hartfield, M. & Otto, S. P. Recombination and hitchhiking of deleterious alleles. Evolution 65, 2421–2434 (2011).
-
Necsulea, A. et al. Meiotic recombination favors the spreading of deleterious mutations in human populations. Hum. Mutat. 32, 198–206 (2011).
-
Hamilton, J. A., Okada, M., Korves, T. & Schmitt, J. The role of climate adaptation in colonization success in Arabidopsis thaliana. Mol. Ecol. 24, 2253–2263 (2015).
-
1001 Genomes Consortium. 1,135 genomes reveal the global pattern of polymorphism in Arabidopsis thaliana. Cell 166, 481–491 (2016).
-
Lee, C. R. et al. On the post-glacial spread of human commensal Arabidopsis thaliana. Nat. Commun. 8, 14458 (2017).
-
Cao, J. et al. Whole-genome sequencing of multiple Arabidopsis thaliana populations. Nat. Genet. 43, 956–963 (2011).
-
Durvasula, A. et al. African genomes illuminate the early history and transition to selfing in Arabidopsis thaliana. Proc. Natl Acad. Sci. USA 114, 5213–5218 (2017).
-
Zou, Y. P. et al. Adaptation of Arabidopsis thaliana to the Yangtze River basin. Genome Biol. 18, 239 (2017).
-
Jiang, J. et al. Forces driving transposable element load variation during Arabidopsis range expansion. Plant Cell 36, 840–862 (2024).
-
Long, Q. et al. Massive genomic variation and strong selection in lines from Sweden. Nat. Genet. 45, 884–890 (2013).
-
Albers, P. K. & McVean, G. Dating genomic variants and shared ancestry in population-scale sequencing data. PLoS Biol. 18, e3000586 (2020).
-
Kiezun, A. et al. Deleterious alleles in the human genome are on average younger than neutral alleles of the same frequency. PLoS Genet. 9, e1003301 (2013).
-
Weng, M. L. et al. Fine-grained analysis of spontaneous mutation spectrum and frequency in Arabidopsis thaliana. Genetics 211, 703–714 (2019).
-
Ossowski, S. et al. The rate and molecular spectrum of spontaneous mutations in Arabidopsis thaliana. Science 327, 92–94 (2010).
-
Gunther, T., Lampei, C. & Schmid, K. J. Mutational bias and gene conversion affect the intraspecific nitrogen stoichiometry of the Arabidopsis thaliana transcriptome. Mol. Biol. Evol. 30, 561–568 (2013).
-
Yang, S. H. et al. Great majority of recombination events in Arabidopsis are gene conversion events. Proc. Natl Acad. Sci. USA 109, 20992–20997 (2012).
-
Vasseur, F. et al. Adaptive diversification of growth allometry in the plant Arabidopsis thaliana. Proc. Natl Acad. Sci. USA 115, 3416–3421 (2018).
-
Pouyet, F., Aeschbacher, S., Thiery, A. & Excoffier, L. Background selection and biased gene conversion affect more than 95% of the human genome and bias demographic inferences. Elife 7, e36317 (2018).
-
Ellegren, H. & Galtier, N. Determinants of genetic diversity. Nat. Rev. Genet. 17, 422–433 (2016).
-
Salomé, P. A. et al. The recombination landscape in Arabidopsis thaliana F2 populations. Heredity 108, 447–455 (2012).
-
Gossmann, T. I., Woolfit, M. & Eyre-Walker, A. Quantifying the variation in the effective population size within a genome. Genetics 189, 1389–1402 (2011).
-
Zhang, M., Zhou, L., Bawa, R., Suren, H. & Holliday, J. A. Recombination rate variation, hitchhiking, and demographic history shape deleterious load in poplar. Mol. Biol. Evol. 33, 2899–2910 (2016).
-
Kono, T. J. Y. et al. The role of deleterious substitutions in crop genomes. Mol. Biol. Evol. 33, 2307–2317 (2016).
-
Liu, Q., Zhou, Y., Morrell, P. L. & Gaut, B. S. Deleterious variants in Asian rice and the potential cost of domestication. Mol. Biol. Evol. 34, 908–924 (2017).
-
Huang, K. C. et al. Mutation load in sunflower inversions is negatively correlated with inversion heterozygosity. Mol. Biol. Evol. 39, msac101 (2022).
-
Penalba, J. V. & Wolf, J. B. W. From molecules to populations: appreciating and estimating recombination rate variation. Nat. Rev. Genet. 21, 476–492 (2020).
-
Carlson, J., DeWitt, W. S. & Harris, K. Inferring evolutionary dynamics of mutation rates through the lens of mutation spectrum variation. Curr. Opin. Genet. Dev. 62, 50–57 (2020).
-
Hsu, C. W., Lo, C. Y. & Lee, C. R. On the postglacial spread of human commensal Arabidopsis thaliana: journey to the East. New. Phytol. 222, 1447–1457 (2019).
-
Shirsekar, G. et al. Multiple sources of introduction of North American Arabidopsis thaliana from across Eurasia. Mol. Biol. Evol. 38, 5328–5344 (2021).
-
Lynch, M. & Conery, J. S. The origins of genome complexity. Science 302, 1401–1404 (2003).
-
Simons, Y. B. & Sella, G. The impact of recent population history on the deleterious mutation load in humans and close evolutionary relatives. Curr. Opin. Genet. Dev. 41, 150–158 (2016).
-
Gunther, T. & Schmid, K. J. Deleterious amino acid polymorphisms in Arabidopsis thaliana and rice. Theor. Appl. Genet. 121, 157–168 (2010).
-
Glemin, S. et al. Quantification of GC-biased gene conversion in the human genome. Genome Res. 25, 1215–1228 (2015).
-
Galtier, N. Fine-scale quantification of GC-biased gene conversion intensity in mammals. Peer Community J. 1, e17 (2021).
-
Brad Plumer, N. P. Yes, There Has Been Progress on Climate. No, It’s Not Nearly Enough (The New York Times, 2021).
-
Yim, C. et al. Climate biogeography of: Linking distribution models and individual variation. J. Biogeogr. 51, 560–574 (2023).
-
Exposito-Alonso, M. Understanding local plant extinctions before it is too late: bridging evolutionary genomics with global ecology. N. Phytologist 237, 2005–2011 (2023).
-
Charlesworth, B. Causes of natural variation in fitness: Evidence from studies of Drosophila populations. Proc. Natl Acad. Sci. USA 112, 1662–1669 (2015).
-
Wu, Y. et al. Phylogenomic discovery of deleterious mutations facilitates hybrid potato breeding. Cell 186, 2313–2328 e2315 (2023).
-
Yang, J. et al. Incomplete dominance of deleterious alleles contributes substantially to trait variation and heterosis in maize. PLoS Genet. 13, e1007019 (2017).
-
Valluru, R. et al. Deleterious mutation burden and its association with complex traits in sorghum (Sorghum bicolor). Genetics 211, 1075–1087 (2019).
-
Zhou, Y. et al. The population genetics of structural variants in grapevine domestication. Nat. Plants 5, 965–979 (2019).
-
Wilder, A. P. et al. The contribution of historical processes to contemporary extinction risk in placental mammals. Science 380, eabn5856 (2023).
-
Clement, Y. et al. Evolutionary forces affecting synonymous variations in plant genomes. Plos Genet. 13, e1006799 (2017).
-
Li, H. & Durbin, R. Fast and accurate short read alignment with Burrows-Wheeler transform. Bioinformatics 25, 1754–1760 (2009).
-
Li, H. et al. The Sequence Alignment/Map format and SAMtools. Bioinformatics 25, 2078–2079 (2009).
-
DePristo, M. A. et al. A framework for variation discovery and genotyping using next-generation DNA sequencing data. Nat. Genet. 43, 491–498 (2011).
-
Hu, T. T. et al. The Arabidopsis lyrata genome sequence and the basis of rapid genome size change. Nat. Genet 43, 476–481 (2011).
-
Slotte, T. et al. The Capsella rubella genome and the genomic consequences of rapid mating system evolution. Nat. Genet. 45, 831–835 (2013).
-
Harris, R. S. Improved pairwise alignment of genomic DNA (The Pennsylvania State University, 2007).
-
Cingolani, P. et al. A program for annotating and predicting the effects of single nucleotide polymorphisms, SnpEff: SNPs in the genome of Drosophila melanogaster strain w1118; iso-2; iso-3. Fly 6, 80–92 (2012).
-
Choi, Y., Sims, G. E., Murphy, S., Miller, J. R. & Chan, A. P. Predicting the functional effect of amino acid substitutions and indels. PLoS One 7, e46688 (2012).
-
Vaser, R., Adusumalli, S., Leng, S. N., Sikic, M. & Ng, P. C. SIFT missense predictions for genomes. Nat. Protoc. 11, 1–9 (2016).
-
Malhis, N., Jacobson, M., Jones, S. J. M. & Gsponer, J. LIST-S2: taxonomy based sorting of deleterious missense mutations across species. Nucleic Acids Res. 48, W154–W161 (2020).
-
Pruitt, K. D., Tatusova, T. & Maglott, D. R. NCBI reference sequences (RefSeq): a curated non-redundant sequence database of genomes, transcripts and proteins. Nucleic Acids Res. 35, D61–D65 (2007).
-
Suzek, B. E., Huang, H., McGarvey, P., Mazumder, R. & Wu, C. H. UniRef: comprehensive and non-redundant UniProt reference clusters. Bioinformatics 23, 1282–1288 (2007).
-
Kuhn, M. Building predictive models in R using the caret package. J. Stat. Softw. 28, 1–26 (2008).
-
Terhorst, J., Kamm, J. A. & Song, Y. S. Robust and scalable inference of population history from hundreds of unphased whole genomes. Nat. Genet 49, 303–309 (2017).
-
Phillips, S. J., Anderson, R. P. & Schapire, R. E. Maximum entropy modeling of species geographic distributions. Ecol. Model 190, 231–259 (2006).
-
Muscarella, R. et al. ENMeval: An R package for conducting spatially independent evaluations and estimating optimal model complexity for MAXENT ecological niche models. Methods Ecol. Evol. 5, 1198–1205 (2014).
-
Luu, K., Bazin, E. & Blum, M. G. pcadapt: an R package to perform genome scans for selection based on principal component analysis. Mol. Ecol. Resour. 17, 67–77 (2017).
-
Frichot, E. & Francois, O. LEA: An R package for landscape and ecological association studies. Methods Ecol. Evol. 6, 925–929 (2015).
-
Alachiotis, N., Stamatakis, A. & Pavlidis, P. OmegaPlus: a scalable tool for rapid detection of selective sweeps in whole-genome datasets. Bioinformatics 28, 2274–2275 (2012).
-
Ellis, N., Smith, S. J. & Pitcher, C. R. Gradient forests: calculating importance gradients on physical predictors. Ecology 93, 156–168 (2012).
-
Rousset, F. & Ferdy, J. B. Testing environmental and genetic effects in the presence of spatial autocorrelation. Ecography 37, 781–790 (2014).
Acknowledgements
We would like to thank Guo lab members for helpful suggestions about the analyses and manuscript. This work was supported by the National Natural Science Foundation of China (31925004 and 32430008) and Biological Breeding-National Science and Technology Major Project (2023ZD040680405) to Y.-L.G.
Author information
Authors and Affiliations
Contributions
Y.-L.G. conceived the study; J.J., J.-F.C., X.-T.L., L.W., J.-F.M., B.-S.W., and Y.-L.G. analyzed and interpreted the data; J.J. and Y.-L.G. wrote the paper with contribution from all authors.
Corresponding author
Ethics declarations
Competing interests
The authors declare no competing interests.
Peer review
Peer review information
Nature Communications thanks the anonymous reviewer(s) for their contribution to the peer review of this work. A peer review file is available.
Additional information
Publisher’s note Springer Nature remains neutral with regard to jurisdictional claims in published maps and institutional affiliations.
Supplementary information
Source data
Rights and permissions
Open Access This article is licensed under a Creative Commons Attribution-NonCommercial-NoDerivatives 4.0 International License, which permits any non-commercial use, sharing, distribution and reproduction in any medium or format, as long as you give appropriate credit to the original author(s) and the source, provide a link to the Creative Commons licence, and indicate if you modified the licensed material. You do not have permission under this licence to share adapted material derived from this article or parts of it. The images or other third party material in this article are included in the article’s Creative Commons licence, unless indicated otherwise in a credit line to the material. If material is not included in the article’s Creative Commons licence and your intended use is not permitted by statutory regulation or exceeds the permitted use, you will need to obtain permission directly from the copyright holder. To view a copy of this licence, visit http://creativecommons.org/licenses/by-nc-nd/4.0/.
About this article
Cite this article
Jiang, J., Chen, JF., Li, XT. et al. Incorporating genetic load contributes to predicting Arabidopsis thaliana’s response to climate change.
Nat Commun 16, 2752 (2025). https://doi.org/10.1038/s41467-025-58021-z
-
Received: 30 October 2023
-
Accepted: 06 March 2025
-
Published: 20 March 2025
-
DOI: https://doi.org/10.1038/s41467-025-58021-z
Search
RECENT PRESS RELEASES
Related Post


