Is Bitcoin going to $65K? Traders explain why they’re still bearish
March 21, 2025
Bitcoin ![]() BTCUSD rebounded by as much as 14% after plunging to a four-month low near $76,600 on March 11. But BTC price is down approximately 25% from its record high of around $110,000, which is normal for a “bull market correction.”
BTCUSD rebounded by as much as 14% after plunging to a four-month low near $76,600 on March 11. But BTC price is down approximately 25% from its record high of around $110,000, which is normal for a “bull market correction.”
Still, some analysts anticipate the Bitcoin price declines to continue in the future.
“Dark cloud” hints Bitcoin is topping out
Bitcoin faces renewed bearish pressure after rejecting at $87,470, the descending channel resistance, with a “dark cloud cover” pattern reinforcing the downtrend, according to an analysis shared by GDXTrader on X.

The dark cloud cover pattern occurs when a strong green candle is followed by a red candle that opens above the previous close but closes below the midpoint of the first candle’s body.

Such a shift in sentiment indicates that buyers attempted to push higher but were overpowered by sellers, often leading to further downside.
Bitcoin’s failure to close within the $90,000-$93,000 resistance zone suggests a lack of buying conviction, GDXTrader noted, saying the cryptocurrency will remain under bearish pressure unless it decisively breaks above the said range.
BTC price “perfect rejection” risks $65,000
Bitcoin’s potential to decline further arises from its “perfect rejection” after testing the $86,000-88,000 zone as resistance, according to analysis from popular trader CrediBULL Crypto.
Notably, Bitcoin attempted to break toward the local supply zone marked in red but failed to sustain above the said resistance zone, illustrated by the orange circle in the chart below.

Failure to reclaim the supply zone has increased the probability of a drop toward lower support levels around $77,000-79,000 (highlighted in green) by March. Testing this area as support has led to sharp price rebounds in March.
Nonetheless, if this support zone breaks, a deeper move below the $77,000-79,000 region could extend toward the $65,000-74,000 area—the larger green liquidity zone in the chart above—by April.
Analyst George shared a similar outlook, as shown below.

“Hard to stay bullish” with a bear flag pattern
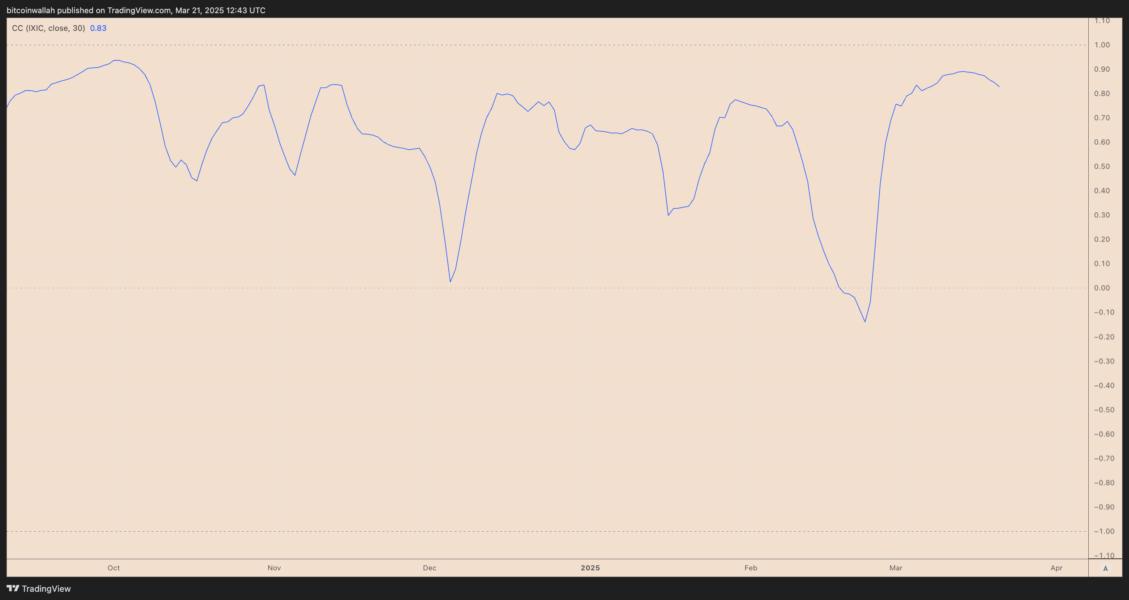
According to analyst CryptOpus, Bitcoin remains tightly correlated with traditional equity markets, particularly the S&P 500 (SPX) and Nasdaq 100 (NDX), both of which are displaying bear flag patterns on the charts.
A bear flag forms when the price consolidates higher inside an ascending parallel channel. It resolves if the price breaks below the lower trendline and drops by as much as the previous downtrend’s height.

BTC is following a similar bear flag structure, with $84,000 acting as the lower trendline support. A break below this threshold could trigger a deeper sell-off toward $72,000 per the technical rule explained above.
Moreover, Bitcoin’s correlation with equities has grown due to a broader decline in risk-on sentiment, led by the US President Donald Trump’s global trade war.
Arthur Breitman, the co-founder of Tezos, has called US recession one of the crypto market’s biggest external risks.
This article does not contain investment advice or recommendations. Every investment and trading move involves risk, and readers should conduct their own research when making a decision.
Search
RECENT PRESS RELEASES
Related Post


