Is It Time To Reassess Amazon.com (AMZN) After Its Recent DCF Valuation Gap?
April 1, 2026
- For investors wondering whether Amazon.com is fairly priced at around US$208 per share or if the market is missing something, this article explains what the current valuation signals may be indicating.
- The stock has been relatively flat over the past month with a 0.1% decline. It still shows a 6.3% return over the last year and a 106.0% return over three years, which may raise questions about whether the recent share price reflects its longer term performance.
- Recent headlines have focused on Amazon.com’s continued push across e commerce, cloud services and advertising, along with ongoing investments in logistics and technology. These developments keep the company in focus for many investors and often shape expectations about future cash flows and risk, which in turn influence how the market values the stock.
- Simply Wall St currently assigns Amazon.com a valuation score of 4 out of 6. The sections ahead compare this with traditional methods such as discounted cash flow models and valuation multiples, then introduce a more holistic way to think about value that brings these perspectives together.
Advertisement
Approach 1: Amazon.com Discounted Cash Flow (DCF) Analysis
A Discounted Cash Flow, or DCF, model estimates what a company could be worth today by projecting its future cash flows and discounting them back to the present.
For Amazon.com, the model used is a 2 Stage Free Cash Flow to Equity approach, based on cash flow projections in $. The latest twelve month free cash flow is about $40.1b. Analysts provide explicit forecasts for the next few years, and Simply Wall St extrapolates beyond that, with projected free cash flow reaching about $173.4b in 2030 and continuing further in the following years.
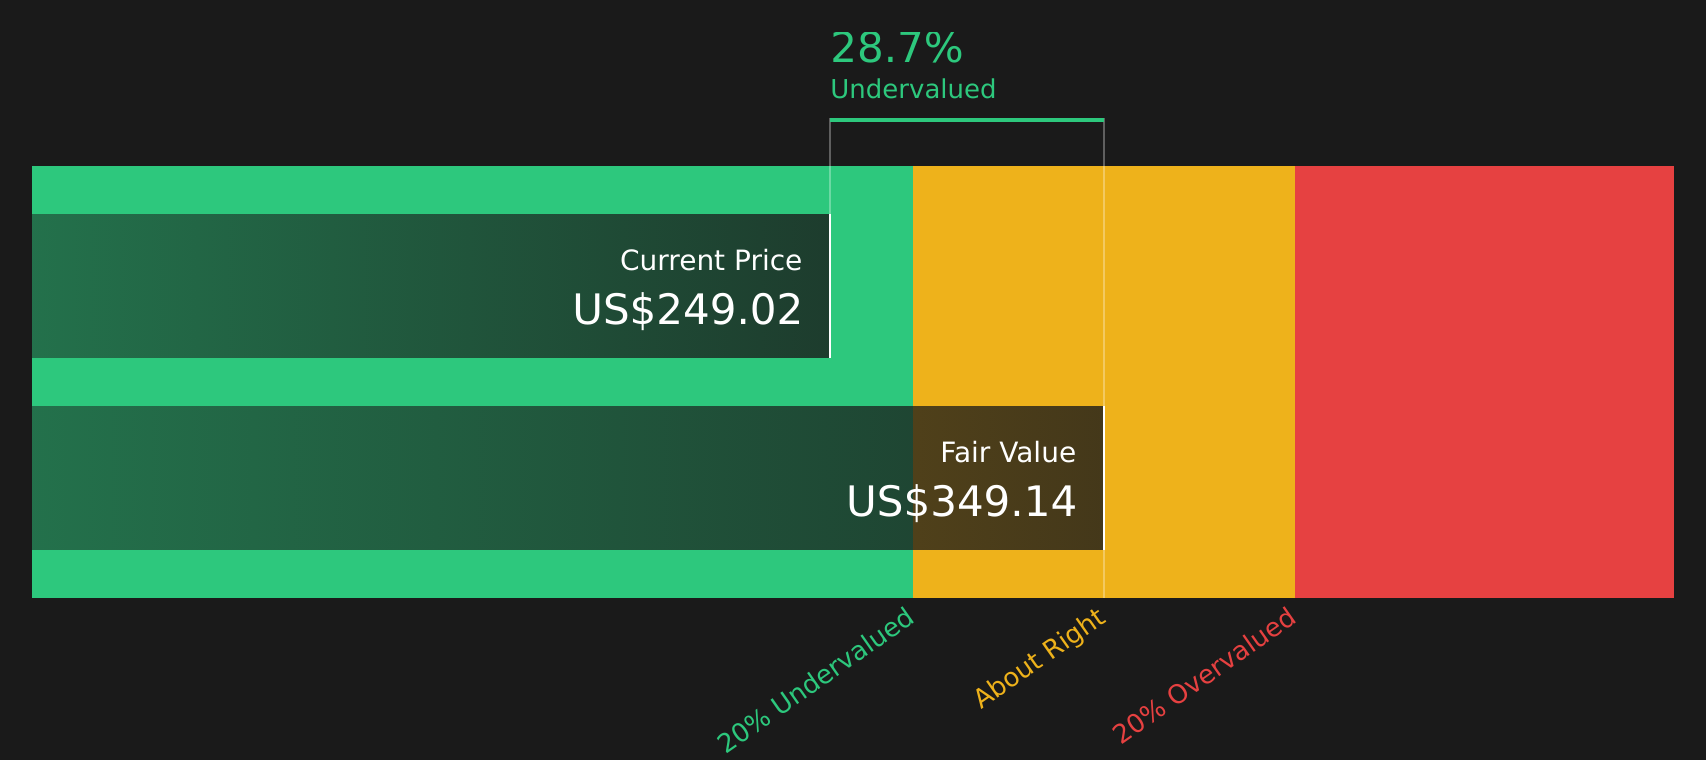
Bringing all those projected cash flows back to today, the DCF model suggests an estimated intrinsic value of about $346.72 per share. Against the current share price of around $208, this implies a 39.9% discount, which indicates that the shares may be trading materially below this cash flow based estimate of value.
Result: UNDERVALUED
Our Discounted Cash Flow (DCF) analysis suggests Amazon.com is undervalued by 39.9%. Track this in your watchlist or portfolio, or discover 58 more high quality undervalued stocks.
Approach 2: Amazon.com Price vs Earnings (P/E)
For profitable companies, the P/E ratio is a widely used way to gauge how much investors are paying for each dollar of earnings, because it ties the share price directly to current profitability.
What counts as a normal or fair P/E depends on how the market views a company’s growth prospects and risk. Higher expected earnings growth or lower perceived risk can support a higher P/E, while slower growth or higher risk tends to align with a lower P/E.
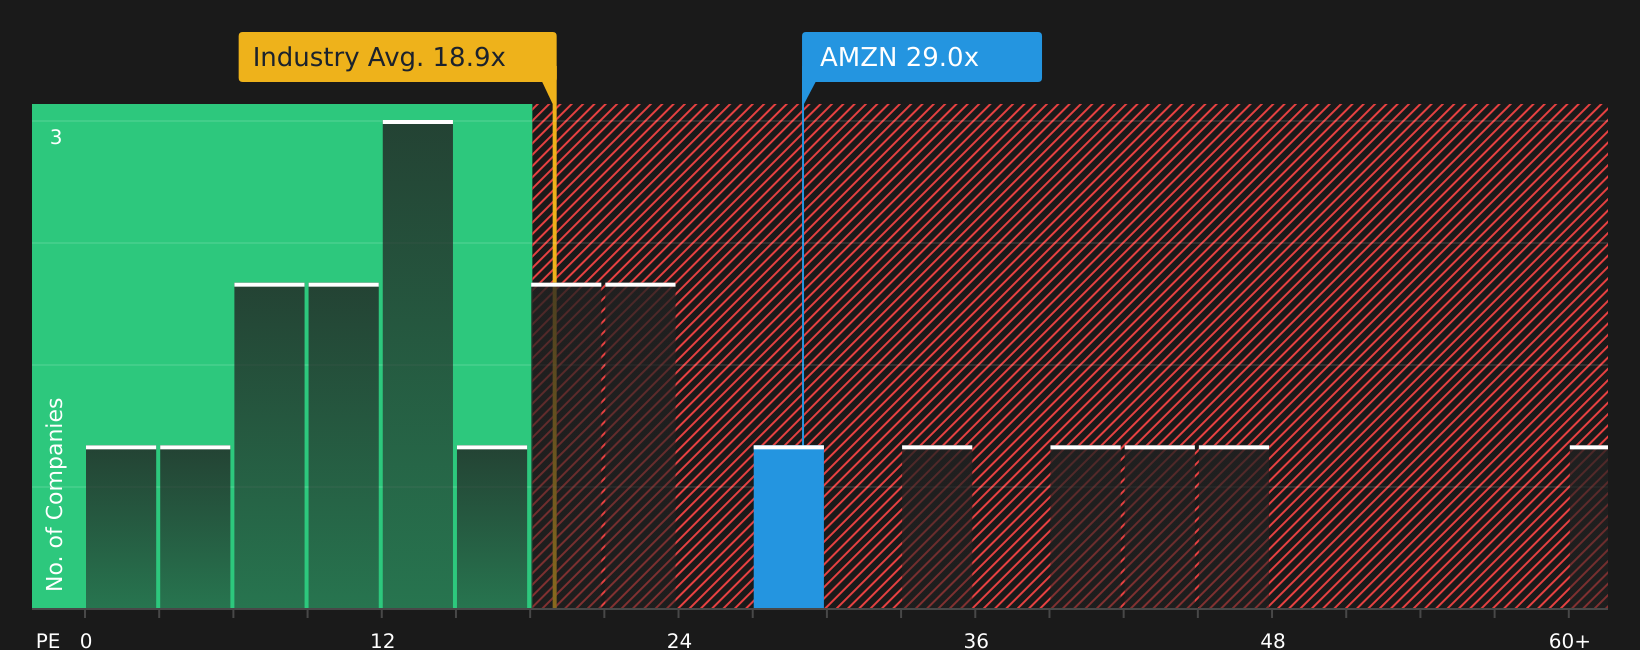
Amazon.com currently trades on a P/E of 28.79x. This is above the Multiline Retail industry average P/E of 19.91x and above the peer group average of 22.26x. Simply Wall St’s proprietary Fair Ratio model, which looks at factors such as earnings growth, profit margins, industry, market cap and company specific risks, suggests a Fair P/E Ratio of 38.45x for Amazon.com.
This Fair Ratio is more tailored than a simple comparison with peers or the industry, because it adjusts for company specific characteristics rather than assuming all firms should trade on similar multiples. Comparing the current P/E of 28.79x with the Fair Ratio of 38.45x shows that the shares are trading below this model-based assessment of a fair earnings multiple.
Result: UNDERVALUED (based on this model)
P/E ratios tell one story, but what if the real opportunity lies elsewhere? Start investing in legacies, not executives. Discover our 20 top founder-led companies.
Earlier it was mentioned that there is an even better way to think about valuation. This is where Narratives come in, a simple way for you to attach a clear story to your numbers by linking your view of Amazon.com’s business to specific assumptions for fair value, future revenue, earnings and margins.
A Narrative on Simply Wall St takes your view of what drives Amazon.com, for example how important AWS, advertising or logistics automation are, turns that into a forecast, then connects it to a fair value estimate that you can compare directly with today’s share price to help you assess whether the stock looks expensive or reasonable on your terms.
These Narratives sit inside the Community section of the platform, are used by many investors, and update automatically when new data arrives. If fresh earnings or news change AWS expectations or margin assumptions, the fair value in that Narrative adjusts for you rather than staying static.
Looking at Amazon.com on Simply Wall St right now, one Narrative assumes higher long term profit margins and arrives at a fair value of about US$500 per share. A more cautious Narrative that uses lower margin and growth assumptions lands closer to US$151 per share. This illustrates how people can look at the same company, apply different stories, and reach different yet transparent conclusions.
For Amazon.com however we will make it really easy for you with previews of two leading Amazon.com Narratives:
On Simply Wall St these sit alongside many other community views, so you can see how different assumptions on growth, profitability and risk translate into fair value estimates you can compare with today’s price.
Start with a bullish view that sees more upside from Amazon.com’s mix of retail, AWS and advertising, then contrast it with a more cautious take that focuses on capital intensity, competition and valuation limits.
Fair value in this Narrative: US$222.55 per share
Implied discount to this fair value at US$208.27: about 6.4% undervalued
Revenue growth assumption: 15.19%
- Frames Amazon.com as having higher underlying earnings power than reported profits, with 3P sellers, advertising and AWS doing most of the heavy lifting.
- Emphasises heavy reinvestment in fulfilment, AWS capacity and global expansion, which keeps free cash flow muted while aiming to build a larger, more efficient platform.
- Assumes operating leverage over time, with online retail, AWS and advertising each contributing to rising margins and larger operating cash flows, while regulation and recessions are treated as key watchpoints.
Fair value in this Narrative: US$151.21 per share
Implied premium to this fair value at US$208.27: about 37.8% overvalued
Revenue growth assumption: 7.2%
- Argues that core retail and 3P seller revenues already represent a large share of U.S. discretionary spending, so room for further retail expansion is more limited.
- Sees AWS and advertising as important profit drivers but factors in slower growth as the cloud market matures, competition increases and capital intensity remains high.
- Highlights risks around stock based compensation, rising competition in e commerce, streaming and gaming, as well as macro and trade headwinds that could cap long term margins and earnings.
If you prefer to compare a range of bullish and cautious stories side by side, you can also review what other investors are publishing on Amazon.com through Community Narratives, then decide which assumptions feel closest to your own view.
Do you think there’s more to the story for Amazon.com? Head over to our Community to see what others are saying!

This article by Simply Wall St is general in nature. We provide commentary based on historical data
and analyst forecasts only using an unbiased methodology and our articles are not intended to be financial advice. It does not constitute a recommendation to buy or sell any stock, and does not take account of your objectives, or your
financial situation. We aim to bring you long-term focused analysis driven by fundamental data.
Note that our analysis may not factor in the latest price-sensitive company announcements or qualitative material.
Simply Wall St has no position in any stocks mentioned.
New: Manage All Your Stock Portfolios in One Place
We’ve created the ultimate portfolio companion for stock investors, and it’s free.
• Connect an unlimited number of Portfolios and see your total in one currency
• Be alerted to new Warning Signs or Risks via email or mobile
• Track the Fair Value of your stocks
Have feedback on this article? Concerned about the content? Get in touch with us directly. Alternatively, email editorial-team@simplywallst.com
Search
RECENT PRESS RELEASES
Related Post


