Is Meta Platforms (META) Still Attractive After AI Push And Multi‑Year Share Price Surge?
January 7, 2026
- If you are wondering whether Meta Platforms is still a good deal at around US$660 a share, the key question is how that price lines up with the company’s underlying value.
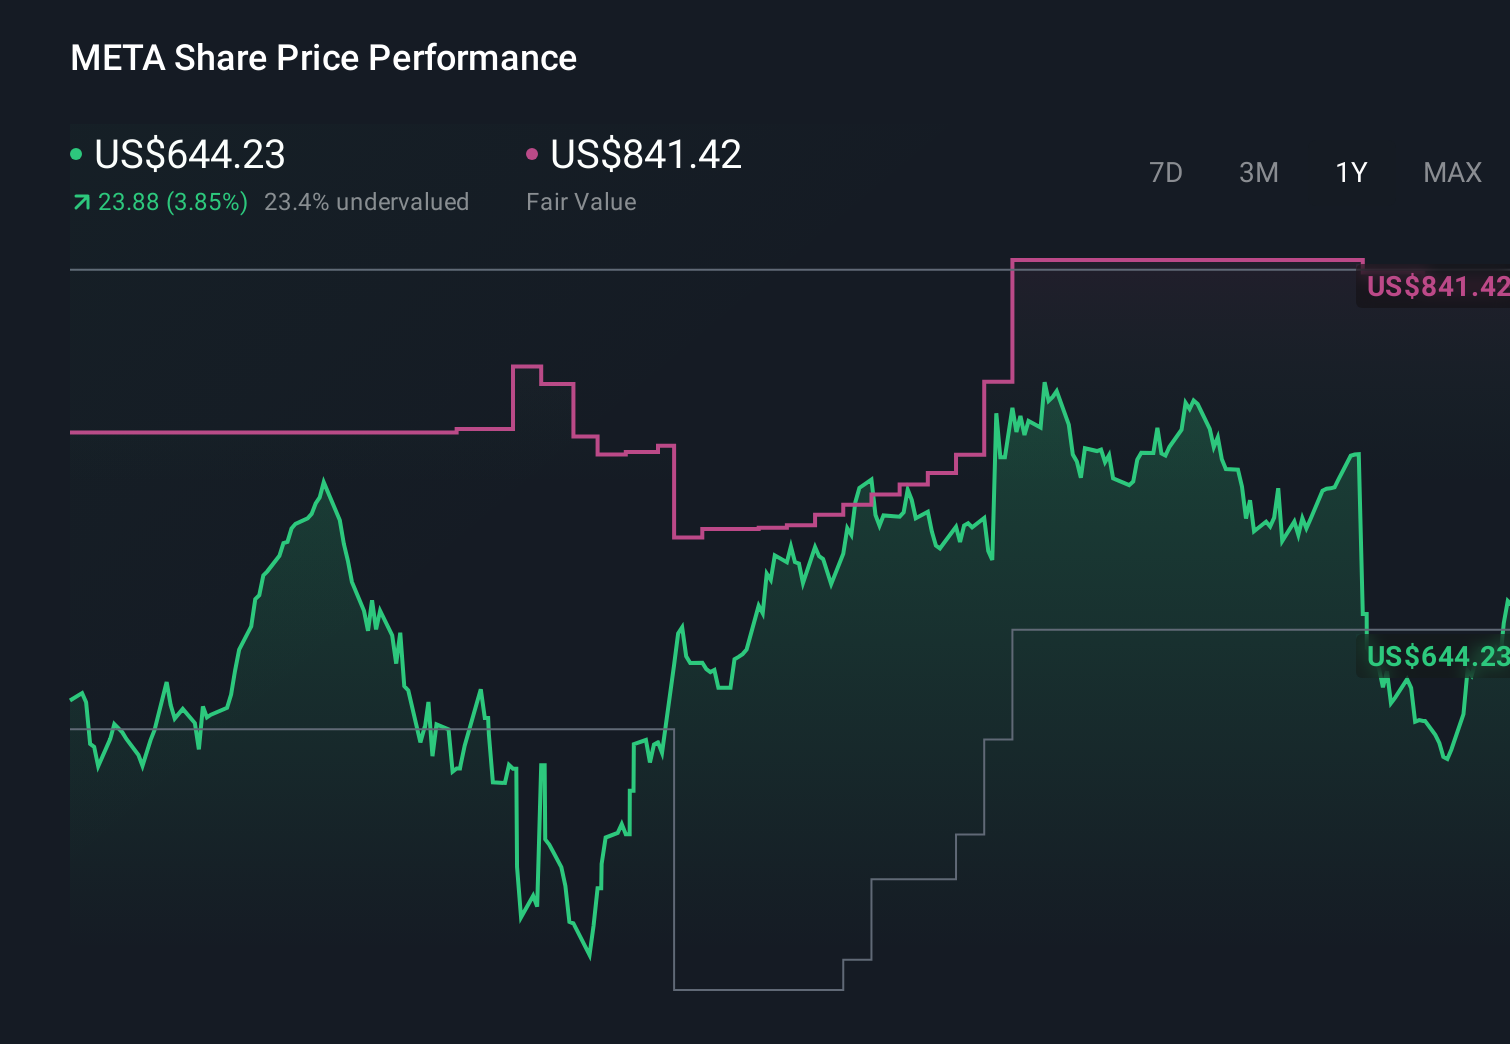
- The stock is up 7.3% over the last year and 164.9% over five years, even though the recent 7 day and 30 day returns of 0.8% decline and 1.9% decline show that the ride has not been perfectly smooth.
- Recent headlines have focused on Meta Platforms pushing further into artificial intelligence, expanding its family of apps, and continuing to invest heavily in its longer term metaverse ambitions. These themes have shaped how investors think about the balance between growth potential and risk, which can influence how they are willing to price the stock.
- Simply Wall St currently gives Meta Platforms a valuation score of 5/6, based on how often it screens as undervalued across six separate checks. Next we will look at what those methods say about the current share price and why there may be an even better way to think about fair value by the end of this article.
Find out why Meta Platforms’s 7.3% return over the last year is lagging behind its peers.
Advertisement
Approach 1: Meta Platforms Discounted Cash Flow (DCF) Analysis
A Discounted Cash Flow, or DCF, model takes a series of projected future cash flows and discounts them back to today, aiming to estimate what the entire stream of cash is worth in present terms.
For Meta Platforms, the model uses last twelve months Free Cash Flow of about $58.8b as a starting point, then applies analyst forecasts for the next few years and extrapolates further out to 2035. By 2030, projected Free Cash Flow is $119.7b, with each year between 2026 and 2035 contributing a discounted cash flow amount in the tens of billions of dollars.
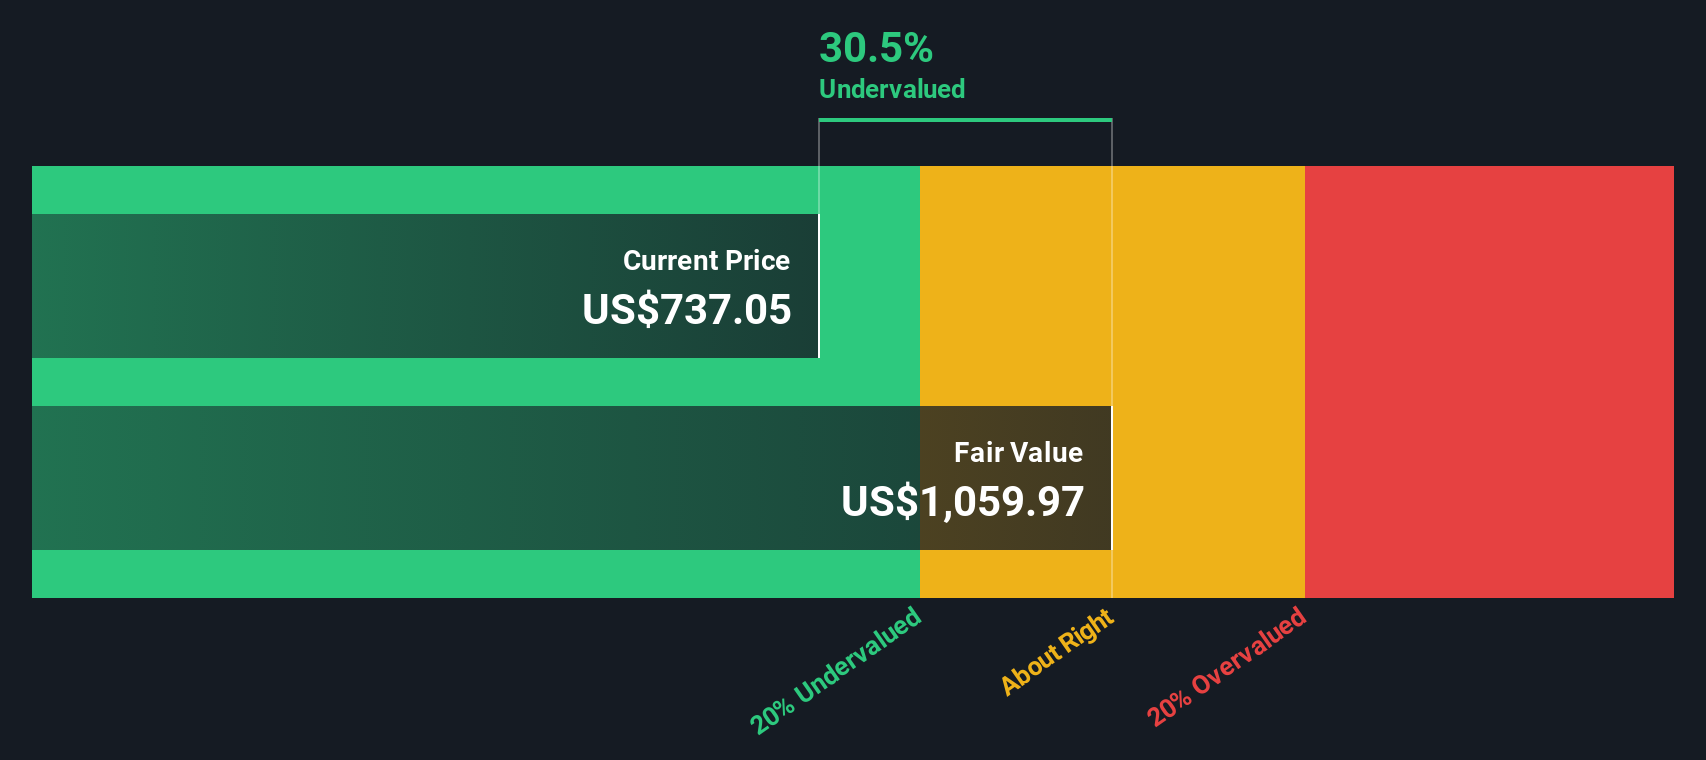
Adding these discounted cash flows together gives an estimated intrinsic value of about $1,052.72 per share. Compared with the current share price of around $660, the DCF output suggests the shares trade at roughly a 37.2% discount to that intrinsic estimate, which indicates that on this cash flow view the stock screens as undervalued.
Result: UNDERVALUED
Our Discounted Cash Flow (DCF) analysis suggests Meta Platforms is undervalued by 37.2%. Track this in your watchlist or portfolio, or discover 877 more undervalued stocks based on cash flows.
Approach 2: Meta Platforms Price vs Earnings
For profitable companies like Meta Platforms, the P/E ratio is a useful shorthand because it links what you pay today to the earnings the business is already generating. It gives you a simple way to compare how the market is pricing each dollar of profit.
What counts as a “normal” or “fair” P/E depends on how investors view a company’s growth potential and risk. Higher expected growth and lower perceived risk can support a higher P/E, while slower expected growth or higher risk usually point to a lower one.
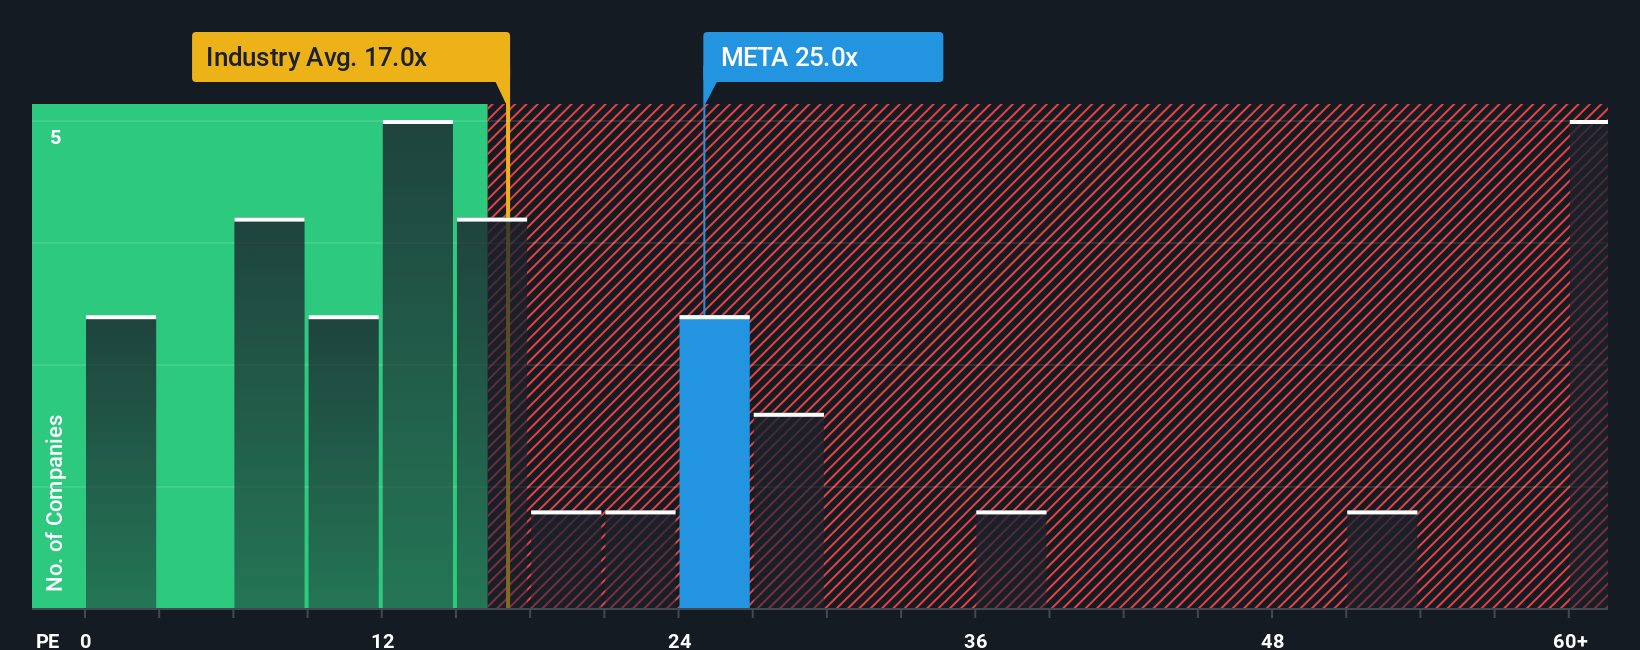
Meta Platforms currently trades on a P/E of 28.45x. That sits above the Interactive Media and Services industry average of 15.44x, but below the peer group average of 34.68x. Simply Wall St’s Fair Ratio metric for Meta Platforms is 39.14x. This Fair Ratio is a proprietary view of what the P/E could be, after factoring in elements like earnings growth, profit margins, the company’s industry, market cap and specific risks.
Because it blends these company specific factors, the Fair Ratio can be more informative than a simple comparison with peers or the broad industry. With the current P/E of 28.45x below the Fair Ratio of 39.14x, this approach suggests the shares screen as undervalued on an earnings multiple basis.
Result: UNDERVALUED
P/E ratios tell one story, but what if the real opportunity lies elsewhere? Discover 1449 companies where insiders are betting big on explosive growth.
Upgrade Your Decision Making: Choose your Meta Platforms Narrative
Earlier we mentioned that there is an even better way to understand valuation, so let us introduce you to Narratives, a simple way to attach your own story about Meta Platforms to the numbers you care about, such as fair value, future revenue, earnings and margins.
A Narrative on Simply Wall St is your written view of the business that is tied directly to a forecast and a fair value. Instead of only looking at ratios, you are spelling out why you think the company looks the way it does on paper.
Because Narratives live inside the Community page on Simply Wall St, where millions of investors share their views, they are easy to access and compare. The platform also keeps them updated when new information such as earnings or news is added.
Each Narrative links a story to a full set of assumptions and a resulting fair value. You can then compare this to the current share price to help decide whether you think the stock looks expensive or cheap for your purposes.
For example, one Meta Platforms Narrative on Simply Wall St currently assigns a fair value of about US$538.09 per share, while another assigns about US$837.15 per share. This shows how two investors looking at the same company can reasonably land in very different places once they write down their assumptions and story.
For Meta Platforms however we’ll make it really easy for you with previews of two leading Meta Platforms Narratives:
Both are looking at the same company and the same share price, but they land in very different places on fair value and future growth. That contrast can help you pressure test your own view.
Fair value: US$837.15
Implied discount to this fair value: about 21.1% based on the recent price of US$660.62
Revenue growth assumption: 16.67% a year
- Analysts in this camp see AI driven personalization, new ad formats and messaging monetization supporting higher revenue and the ability to keep investing heavily in infrastructure.
- They model earnings rising with revenue, even after assuming profit margins soften from 40.0% today to 33.4% in three years and factor in ongoing regulatory and spending risks.
- The fair value of about US$837 per share reflects confidence that Meta can keep scaling its AI and app ecosystem while managing the costs and legal headwinds that come with it.
Fair value: US$538.09
Implied premium to this fair value: about 22.8% based on the recent price of US$660.62
Revenue growth assumption: 10.5% a year
- This view sees Meta growing, but with more modest revenue expectations and a fair amount of uncertainty around AR, VR and the metaverse ever becoming large, profitable businesses.
- The author highlights regulatory pressure, dependence on advertising and heavy AI and Reality Labs spending as key risks that could weigh on margins and cash generation.
- The lower fair value of about US$538 per share reflects a more cautious stance on how much investors should pay today given those execution, regulatory and spending questions.
You do not have to agree fully with either story, but lining up the numbers, assumptions and risks on both sides can make it clearer where your own view sits and what would have to change for you to rethink it.
Curious how numbers become stories that shape markets? Explore Community Narratives
Do you think there’s more to the story for Meta Platforms? Head over to our Community to see what others are saying!
This article by Simply Wall St is general in nature. We provide commentary based on historical data
and analyst forecasts only using an unbiased methodology and our articles are not intended to be financial advice. It does not constitute a recommendation to buy or sell any stock, and does not take account of your objectives, or your
financial situation. We aim to bring you long-term focused analysis driven by fundamental data.
Note that our analysis may not factor in the latest price-sensitive company announcements or qualitative material.
Simply Wall St has no position in any stocks mentioned.
New: Manage All Your Stock Portfolios in One Place
We’ve created the ultimate portfolio companion for stock investors, and it’s free.
• Connect an unlimited number of Portfolios and see your total in one currency
• Be alerted to new Warning Signs or Risks via email or mobile
• Track the Fair Value of your stocks
Have feedback on this article? Concerned about the content? Get in touch with us directly. Alternatively, email editorial-team@simplywallst.com
Search
RECENT PRESS RELEASES
Related Post


