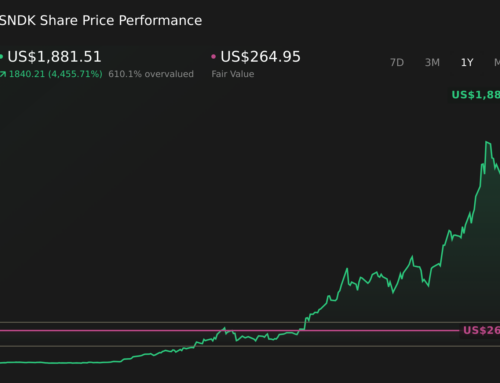
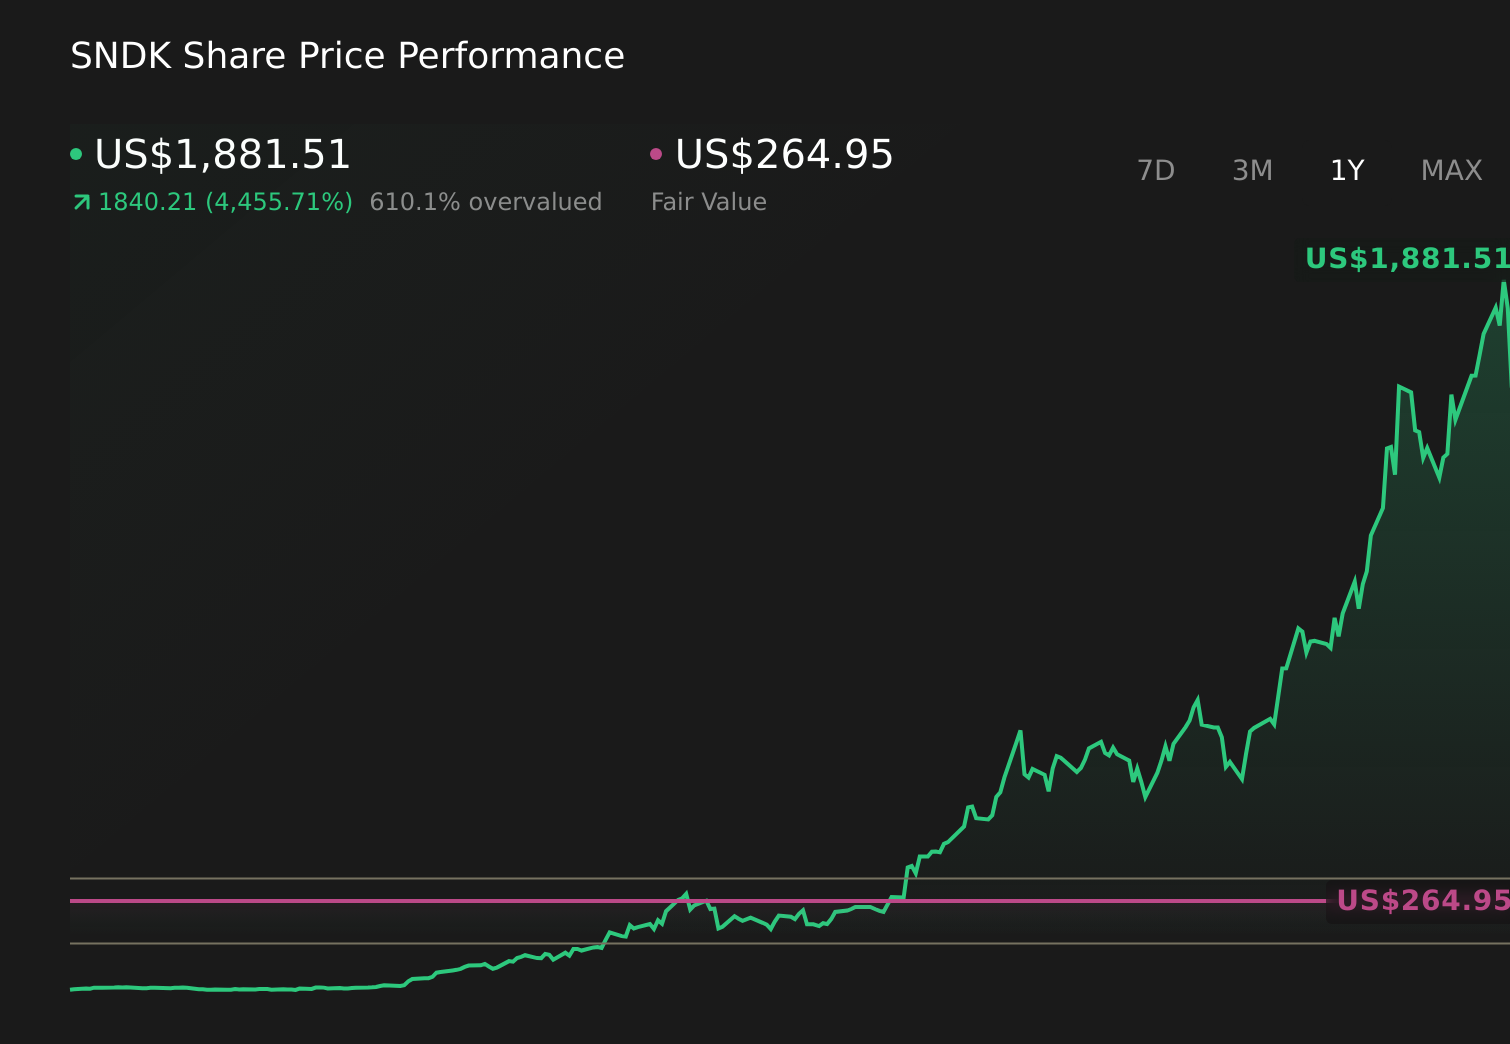
Kinder Morgan (KMI) Stock After Big Three-Year Run Is There Value Left?
June 11, 2026
Track your investments for FREE with Simply Wall St, the portfolio command center trusted by over 7 million individual investors worldwide.
-
If you are wondering whether Kinder Morgan’s current share price still offers value or has already done the heavy lifting, the next sections walk through what the numbers are saying about the stock.
-
The share price closed at US$31.36, with returns over the last week and month slipping by 1.1% and 3.4% respectively. The year-to-date return sits at 13.2% and the 1-year return at 18.1%, alongside a very large 3-year gain of around 7x and a 5-year gain of around 7x.
-
Recent coverage of Kinder Morgan has focused on its role as a large North American energy infrastructure company and on how its pipeline and storage assets fit into long-term demand for natural gas and related products. Other commentary has discussed how changes in energy policy and project approvals could affect large midstream operators, giving context to how investors may be thinking about future cash flows and risk for the stock.
-
Kinder Morgan currently has a valuation score of 3/6, reflecting that it screens as undervalued on half of the six checks. The next parts of this article will compare different valuation approaches before finishing with a way to put those valuation results into a broader investment story.
Find out why Kinder Morgan’s 18.1% return over the last year is lagging behind its peers.
Approach 1: Kinder Morgan Discounted Cash Flow (DCF) Analysis
A Discounted Cash Flow, or DCF, model takes projected future cash flows and discounts them back into today’s dollars, giving you an estimate of what the business may be worth based purely on those cash flows.
For Kinder Morgan, the model uses a 2 Stage Free Cash Flow to Equity approach. The latest twelve month free cash flow is about $2.32b. Analysts provide explicit forecasts for several years, and Simply Wall St then extends the projections further out, with free cash flow for 2030 estimated at $3.35b. Ten year projections are discounted back using the DCF framework so that cash generated further in the future counts less than cash expected sooner.
When all those discounted cash flows are added up, the intrinsic value for Kinder Morgan is calculated at about $41.63 per share. Compared with the recent share price of $31.36, this result suggests the stock screens as around 24.7% undervalued under this model. That gap is meaningful for investors who mainly focus on cash generation.
Result: UNDERVALUED
Our Discounted Cash Flow (DCF) analysis suggests Kinder Morgan is undervalued by 24.7%. Track this in your watchlist or portfolio, or discover 46 more high quality undervalued stocks.
Approach 2: Kinder Morgan Price vs Earnings
For a profitable company, the P/E ratio is a useful way to link what you pay for the stock to the earnings it generates. It gives you a quick sense of how many dollars investors are currently paying for each dollar of earnings.
What counts as a “normal” or “fair” P/E depends on what the market expects for future growth and how risky those earnings are perceived to be. Higher expected growth or lower perceived risk can support a higher P/E, while lower expected growth or higher perceived risk usually points to a lower P/E.
Kinder Morgan currently trades on a P/E of 21.16x. This is above the Oil and Gas industry average of 13.78x and also above the peer group average of 17.25x. Simply Wall St’s Fair Ratio for Kinder Morgan is 22.10x, which is a proprietary estimate of what the P/E might be given the company’s earnings profile, industry, profit margins, market cap and risk factors. Because it adjusts for these company specific drivers, the Fair Ratio can often be more informative than a simple comparison with peers or the wider industry. On this basis, Kinder Morgan’s current P/E is slightly below the Fair Ratio, which indicates that the stock screens as undervalued on this metric.
Result: UNDERVALUED
Wall Street’s queuing for one rocket. While SpaceX counts down to its IPO, other companies tied to the new space race are already in orbit. → 20 Compelling Space Companies watchlist · Global Space Race Investing Ideas screener · Scan the sector by valuation on Rocket Lab’s valuation page.
Upgrade Your Decision Making: Choose your Kinder Morgan Narrative
Earlier it was mentioned that there is an even better way to understand valuation. Meet Narratives, which let you attach a clear story about Kinder Morgan’s future revenue, earnings and margins to a forecast and a fair value. You can then compare that fair value to today’s price in an easy tool on Simply Wall St’s Community page that millions of investors use. Each Narrative updates automatically when fresh news or earnings arrive. One investor might build a Kinder Morgan view that lines up with the higher analyst fair value near US$43.00 based on confidence in long term gas demand and contract stability. Another might anchor on the lower US$31.00 end because they are more cautious about leverage, competition and energy transition risks. Both can see in one place how their story, numbers and the market price fit together to help them decide whether the stock currently looks expensive or cheap against their own assumptions.
Do you think there’s more to the story for Kinder Morgan? Head over to our Community to see what others are saying!
This article by Simply Wall St is general in nature. We provide commentary based on historical data and analyst forecasts only using an unbiased methodology and our articles are not intended to be financial advice. It does not constitute a recommendation to buy or sell any stock, and does not take account of your objectives, or your financial situation. We aim to bring you long-term focused analysis driven by fundamental data. Note that our analysis may not factor in the latest price-sensitive company announcements or qualitative material. Simply Wall St has no position in any stocks mentioned.
Companies discussed in this article include KMI.
Have feedback on this article? Concerned about the content? Get in touch with us directly. Alternatively, email editorial-team@simplywallst.com
Terms and Privacy Policy
Search
RECENT PRESS RELEASES
Related Post


