Meta Platforms (META) Just Flashed a Super-Rare Quant Signal Ahead of Earnings
October 28, 2025
/Facebookname%20backlite%20by%20Alex%20Haney%20via%20Unsplash.jpg)
Facebookname backlite by Alex Haney via Unsplash
As Denzel Washington might say, “There are two kinds of analysis in this world. Analysis that hurts. Analysis that alters.” Today, we’ll be looking at the latter.
Meta Platforms (META) will be releasing its third-quarter earnings report on Wednesday after the closing bell. Analysts anticipate adjusted earnings per share to land at $6.66 on revenue of $49.41 billion. While there have been some patchy performances in 2022 and 2023, for the most part, Meta has been firing on all cylinders.
As such, fundamental analysts would have a difficult time assessing META stock, which trades at 26.57-times trailing-year earnings. That’s a bit lower than the multiple of almost 28 times seen during the final quarter of last year. However, valuation ratios must be taken into context; they are not universal truth claims.
On the technical front, there’s no real pattern that would lead to a probabilistic assessment of META’s forward trajectory. Sure, the price action popped above the 50-day moving average but so what? Moving averages merely represent an arithmetic description; again, rising above them do not represent universal truth claims.
Drilling into the options market, total derivatives volume reached 314,345 contracts, falling 18.47% below the trailing one-month average. However, call volume stood at 197,413 contracts, yielding a put/call ratio of 0.59. Moreover, options flow — which focuses exclusively on big block transactions — showed net trade sentiment at more than $44 million, thus firmly favoring the bulls.
Still, it’s difficult to know what the big dogs are truly thinking. For example, on Oct. 16, net trade sentiment was about $85.6 million in the red.
In other words, traditional methodologies such as fundamental and technical analysis, along with surface-level interpretations of options market transactions, are examples of analyses that hurt — they hurt because you’re not really sure where you stand with the facts.
There is an analysis that alters and that is the quantitative methodology.
Going Quant for META Stock
At the core, quantitative analysis is the study of market behavior for the end goal of extracting a potentially favorable trading idea. This approach sounds like technical analysis except that quants use actual data science to establish forward probabilities of empirical signals whereas “technicians” merely assert their hypotheses with pareidolia and tautologies.
Fundamental analysis also falls into the same trap, along with other surface-level interpretations of market dynamics, whether that be unusual options or short interest or whatever. In all these cases, both the premise and the conclusion stem from the author making the claim. Therefore, what most people consider fundamental, technical or options-related analysis is actually a spotlight of the analyst, not the analysis.
That’s okay but if the analyst’s interpretation is off, typically, the whole narrative crumbles. You also don’t know the probability of whether the analyst is going to be interpretively off or not.
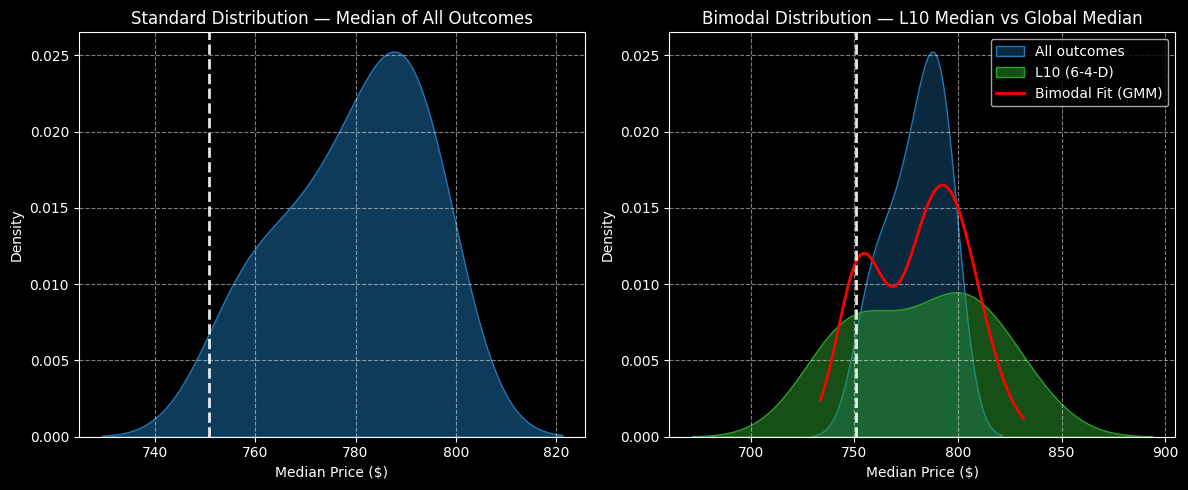
The quantitative approach is different because the premise is falsifiable. For example, we factually know that META stock is currently (through Monday’s close) structured in a 6-4-D sequence: six up weeks, four down weeks, with an overall downward slope. The pattern itself isn’t important per se. Rather, the critical aspect is that we can measure the probabilistic impact of this sequence relative to baseline conditions.
Let’s use a football example. If the baseline impact is a hit from a defensive lineman, then a hard tackle by the fast-charting strong safety can be defined as an aberrant stimulus. What I’m trying to convey is that the market is the same thing. If META stock gets hit by the strong safety, so to speak, the impact is going to be different than if it got hit by a defensive lineman.
Even better, if the market is anticipating a standard hit but is actually going to be taken out by the safety, we can wager on the latter outcome.
Specifically, under 6-4-D conditions, we would expect price clustering to be most prominent at $800 over the next ten weeks. Under baseline conditions, the clustering would be prominent at around $790. Therefore, we can potentially exploit a 1.27% positive delta in price density dynamics that the rest of the market is ignoring.
Letting the Data Do the Trading
Part of the beauty of the quantitative approach is we just let the data guide us to sensible trading ideas. Since we know that price clustering under 6-4-D conditions is most prominent at $800, we may focus on the 790/800 bull call spread expiring Dec. 19.
This trade will require META stock to rise through the second-leg strike at expiration. Ordinarily, that would be considered ambitious but past analogs suggest that META can make it to this threshold. If it happens, the speculator will receive a payout of over 170%.
If that’s too aggressive, traders can always opt for a lower-paying spread in exchange for higher odds. For example, the 770/780 bull spread (also expiring Dec. 19) could be a compromise, which features a max payout of nearly 113%.
Still, if you want to take a bold bet and go for the $800 target, past statistical data suggests the wager isn’t unreasonable.
On the date of publication,
Josh Enomoto
did not have (either directly or indirectly) positions in any of the securities mentioned in this article. All information and data in this article is solely for informational purposes.
For more information please view the Barchart Disclosure Policy
here.
Search
RECENT PRESS RELEASES
Related Post


