Meta Platforms (META) Valuation Check After Recent Share Price Pullback And Strong Q3 Resu
January 6, 2026
Advertisement
Meta Platforms: recent performance snapshot
Meta Platforms (META) has been drawing attention after recent share price moves, with the stock last closing at US$658.79. For investors, the mix of short term pullback and longer term gains invites closer scrutiny.
See our latest analysis for Meta Platforms.
That recent pullback leaves Meta’s 30 day share price return at a 2.17% decline and its 90 day move at an 8.23% decline, while the 1 year total shareholder return of 6.96% and 3 year total shareholder return of almost 4x show that longer term momentum has cooled but remains substantial.
If you are reassessing big tech after Meta’s latest moves, it could be a good moment to see how other names in high growth tech and AI stocks compare on growth and price action.
Meta’s share price pullback sits alongside double digit annual revenue and net income growth and a flagged intrinsic discount of about 37%. So is the market being too cautious here, or already pricing in future growth?
Most Popular Narrative: 8.9% Undervalued
According to yiannisz, the narrative fair value of US$723.11 sits above Meta’s last close at US$658.79, framing the stock as modestly discounted.
Meta Platforms, Inc. (META) announced very strong Q3 2024 results underlined by revenue growth and a strong commitment to AI and the metaverse. Revenue for the quarter grew 19% year-over-year to $40.6 billion, led by strong ad revenue, progress in AI, and strong user engagement across Meta’s platforms. Let’s dive into Meta’s earnings performance in key areas: revenue drivers, investments in AI, and the struggling Reality Labs segment. Meta’s Ad Revenue Soars 19% in Q3, Driven by AI-Powered Targeting and Global Growth. Most of Meta’s Q3 revenue came from the ad business within the segment known as Family of Apps: Facebook, Instagram, and WhatsApp. Advertising revenue increased to $39.9 billion, up 19% year over year. That was partly because of higher prices for ads and partly because of more ad impressions.
Curious what earnings growth path, revenue trajectory and profit margin Meta would need to justify that valuation, all under a discount rate near 7%? The full narrative lays it out step by step.
Result: Fair Value of $723.11 (UNDERVALUED)
Have a read of the narrative in full and understand what’s behind the forecasts.
However, this story could shift if Meta’s heavy AI and Reality Labs spending starts to weigh on profitability, or if regulators tighten rules around data and advertising.
Find out about the key risks to this Meta Platforms narrative.
Another lens on valuation
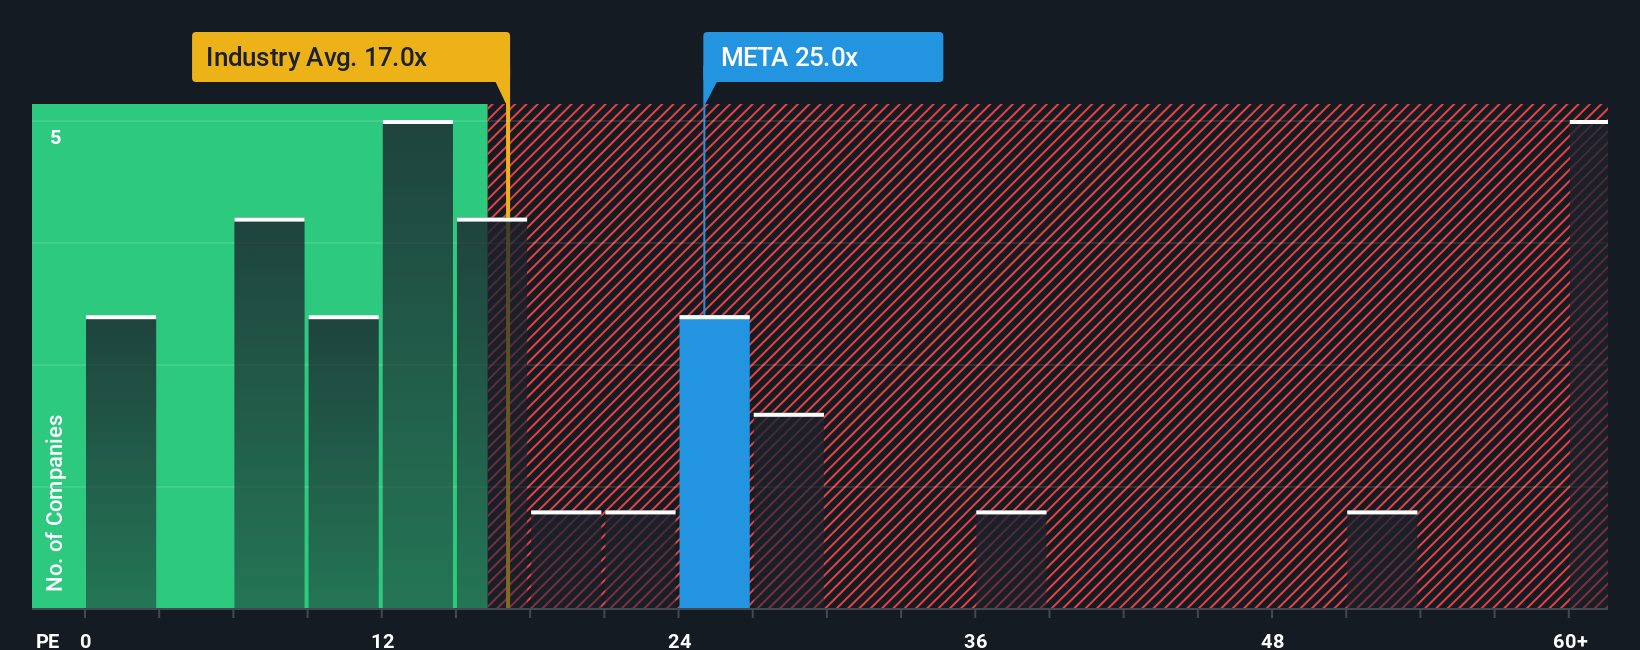
While the user narrative points to Meta as modestly undervalued, the market is telling a more mixed story when you look at the P/E ratio. Meta trades on 28.4x earnings, which is far higher than the US Interactive Media and Services industry at 15.2x.
At the same time, that 28.4x sits below both the peer average of 34.9x and the fair ratio estimate of 39.1x. So you have a company priced richer than its wider industry, yet cheaper than close peers and where the fair ratio suggests the market could move higher. Is that a cushion, or a sign expectations are already loaded into the price?
See what the numbers say about this price — find out in our valuation breakdown.
Build Your Own Meta Platforms Narrative
If you look at the numbers and come to a different conclusion, or simply prefer your own research, you can build a custom view in minutes, starting with Do it your way.
A good starting point is our analysis highlighting 4 key rewards investors are optimistic about regarding Meta Platforms.
Ready to uncover more investing angles?
If Meta has you thinking more broadly about opportunities, do not stop here. Use focused stock ideas to stress test your thesis and spark fresh research.
- Spot potential bargains by checking out these 878 undervalued stocks based on cash flows where prices and cash flows are put side by side for quick comparison.
- Tap into the AI theme through these 25 AI penny stocks and see which companies line up with your view on data, automation and future demand.
- Add income ideas to your watchlist using these 14 dividend stocks with yields > 3% and weigh those yields against business quality and payout strength.
This article by Simply Wall St is general in nature. We provide commentary based on historical data
and analyst forecasts only using an unbiased methodology and our articles are not intended to be financial advice. It does not constitute a recommendation to buy or sell any stock, and does not take account of your objectives, or your
financial situation. We aim to bring you long-term focused analysis driven by fundamental data.
Note that our analysis may not factor in the latest price-sensitive company announcements or qualitative material.
Simply Wall St has no position in any stocks mentioned.
New: Manage All Your Stock Portfolios in One Place
We’ve created the ultimate portfolio companion for stock investors, and it’s free.
• Connect an unlimited number of Portfolios and see your total in one currency
• Be alerted to new Warning Signs or Risks via email or mobile
• Track the Fair Value of your stocks
Have feedback on this article? Concerned about the content? Get in touch with us directly. Alternatively, email editorial-team@simplywallst.com
Search
RECENT PRESS RELEASES
Related Post

