Optimizing energy and load management in island microgrids for enhancing resilience agains
May 10, 2025
Abstract
The increasing integration of distributed renewable energy sources (RES), energy storage systems (ESS), electric vehicle (EV) charging stations, and demand response (DR) mechanisms has significantly enhanced microgrid deployment. However, the operational complexity and vulnerability of islanded microgrids to disruptions, especially during renewable energy fluctuations, pose critical challenges. Existing approaches primarily focus on minimizing operational costs or emissions but fail to simultaneously address load curtailment, voltage stability, and resilience under uncertain conditions. In this paper, we propose a novel resilience-oriented energy and load management framework for island microgrids, integrating a multi-objective optimization function that explicitly minimizes load curtailment, energy losses, voltage deviations, emissions, and energy procurement costs while maximizing the utilization of renewable energy sources. Unlike conventional models that separately optimize demand-side management (DSM), distributed generation (DG), EV charging/discharging, and ESS scheduling, our approach incorporates a coordinated control strategy that jointly optimizes these elements alongside reactive power compensation devices such as capacitors and shunt reactors. To effectively solve this high-dimensional, nonlinear problem, we employ the Multi-objective Moth Flame Algorithm (MOMFA), an enhanced metaheuristic evolutionary algorithm designed to handle complex trade-offs between cost, reliability, and resilience. The superiority of MOMFA over conventional optimization techniques such as Genetic Algorithm (GA), Particle Swarm Optimization (PSO), and Grey Wolf Optimization (GWO) is validated through simulations on a realistic 33-node microgrid under various renewable energy outage scenarios. The results demonstrate that the proposed framework achieves a 60% reduction in voltage deviation, an 81% decrease in energy losses, and an 86% reduction in COâ‚‚ emissions, while ensuring zero load curtailment, even under severe outage conditions. The proposed method offers a scalable, real-time implementable solution for microgrid operators seeking to enhance resilience against renewable energy intermittency and optimize energy utilization. This work significantly advances state-of-the-art microgrid energy management by providing a holistic, multi-objective, and resilience-driven optimization strategy.
Introduction
The rapid advancement of microgrid technologies and the increasing integration of renewable energy, storage systems, and EV charging infrastructure necessitate an efficient strategy for optimizing microgrid operations, especially during weather-induced disruptions. A key challenge in island microgrids is preventing load curtailment when renewable generation fluctuates1. This paper proposes an innovative optimization approach to enhance microgrid resilience during distributed generation outages. Considering distributed resources, storage, EV charging, demand-side management, and power compensation devices, our model ensures uninterrupted power supply and strengthens system reliability, offering a sustainable solution for secure energy management in a dynamic landscape.
Research motivation
This paper addresses the critical challenges faced by modern microgrids with high renewable energy integration, energy storage, and EV charging infrastructure. Intermittent disconnections due to unpredictable weather pose a significant threat to system stability. Our primary goal is to develop a robust optimization approach that minimizes vulnerability in such scenarios, ensuring seamless power supply. Preventing load curtailment is essential to maintaining microgrid stability and customer reliability. To achieve this, we propose a comprehensive operation model that integrates distributed generation, energy storage, EV charging, demand-side management, capacitors, and shunt reactors. By enhancing resilience during renewable outages, our research contributes to the reliability, sustainability, and long-term viability of microgrid energy systems.
Background
In reference1, the authors introduced a nonlinear framework addressing energy management challenges aimed at minimizing both operational expenses and environmental impact within smart grid systems, employing the particle swarm optimization (PSO) evolutionary algorithm. The work in2 proposed a multi-regional energy management approach, utilizing a stochastic evolutionary algorithm to lower fuel costs and emissions. Reference2 featured a linear model designed to decrease the locational marginal price (LMP) and optimize resource expenses through a decomposition strategy tailored for multi-regional energy management. Meanwhile, reference3 discussed a targeted heuristic strategy for energy management that aims to mitigate fuel costs and emissions by incorporating demand-side management techniques. In4, the authors presented a multi-zone energy management framework utilizing an evolutionary algorithm to decrease fuel, operational, and fixed costs associated with resources. Reference5 employed the particle swarm optimization algorithm to address a nonlinear multi-zone energy management model, focusing on reducing both fuel expenses and pollution levels. The work in reference6 introduced the differential evolution (DE) algorithm as a solution for energy management challenges. Lastly, reference7 showcased a nonlinear KKT optimality model alongside an evolutionary algorithm aimed at minimizing resource costs in the context of multi-regional energy management. In reference8, the authors explored the efficient functioning of various renewable energy sources and fossil combined heat and power (CHP) units, which include two wind turbines, two photovoltaic systems, two fuel cell units, and a microturbine, within a small microgrid that incorporates demand-side management. The study emphasizes optimal load allocation, utilizing a stochastic evolutionary algorithm aimed at reducing operational costs while also addressing the uncertainties associated with renewable energy sources and load variations. In9, energy management by considering the uncertainty of production in 24 h to reduce the cost of fuel and load is presented by the evolutionary algorithm of the stock market. In reference10, a strategy for economic load distribution is introduced to achieve the dual objectives of reducing fuel costs and greenhouse gas emissions through the differential evolution algorithm, with the modeling conducted statically for a duration of one hour. Reference11 outlines a framework for optimal energy management that focuses on minimizing the operational costs of energy units by incorporating the charging and discharging capabilities of small electric vehicles within demand response programs. In12 presented a two-level model for the optimal scheduling of energy resources for the leading day in smart grids to reduce the operating costs by considering the load demand from connecting electric vehicles to the grid (V2G) with distributed generation sources. In reference13, a two-tier optimization framework employing the Benders decomposition technique is introduced to minimize the overall operational costs in extensive multi-area distribution systems, taking into account electric vehicle integration. Reference14 details a solution for a multi-zone energy management challenge, utilizing a hybrid approach that combines differential evolution with the decomposition method. In15, the authors propose an energy management strategy aimed at cost reduction, which incorporates resource reservation constraints through two problem-solving scenarios: dynamic and static, utilizing the Lagrange decomposition method. Lastly, reference16 presents a novel evolutionary algorithm designed to address the multi-area energy management issue with the goal of minimizing a bi-objective function. In ref17, the trade-off between resilience and cost in island microgrids is investigated. This work introduces specialized models for evaluating resilience and cost within these microgrids. The study emphasizes the importance of redundancy in generative sources for enhanced resilience at a comparable cost level. Ref18 introduces a novel Nested Restoration Decision System (NRDS) aimed at optimizing Distributed Generation (DG) utilization during islanded microgrid service restoration. The approach employs a layered structure for network control, demonstrating improved DG utilization through experimental evaluations. Ref19 introduces a resource coordination strategy for a hydro-diesel-battery islanded microgrid, prioritizing resiliency during adverse events over economic considerations. The strategy’s effectiveness is quantified using resiliency metrics and integrated into the Real-Time Resilience Management System (RT-RMS), validated on both a 14-node isolated power system and a real-world 55-node islanded microgrid. Ref20 presents a resilience-driven operational model for a hybrid AC/DC microgrid, focusing on grid-connected and islanded modes with voltage-related constraints. The proposed strategy employs preventive power importing and demand response, validated through extensive case studies, and introduces a modified multi-phase curve to address the impact of limited resources and event duration on resilience, offering insights into effective event uncertainty management. Ref21 presents a novel frequency regulation strategy for islanded microgrids, leveraging distribution-level phasor measurement units (D-PMUs) to enhance resilience. The method incorporates measurement-based control modules for arresting, rebounding, and recovering from frequency deviations, demonstrating superior performance in addressing disturbances and improving economic benefits. Ref22 presents an efficient bi-level framework to bolster microgrid (MG) resilience against low probability-high impact islanding events, utilizing battery swapping stations (BSSs). The model facilitates dynamic energy transactions, offering improved MG resilience during emergencies, and proposes a more concise BSS operation formulation with simulations conducted on an MG with two BSSs for validation. Ref23 presents a resilience-focused optimization strategy for microgrids, emphasizing normal operation islanding and critical load survivability during emergencies. The proposed approach incorporates a novel resilience index, robust optimization for handling uncertainties, and adaptive power bounds, offering a comprehensive solution for microgrid resilience enhancement. Ref24 presents a comprehensive method for enhancing distribution system resilience against extreme events. The approach integrates proactive islanding and RCS-based fault isolation and restoration, modeling the multi-stage recovery process and demonstrating its efficacy in case studies. In28, a stochastic multi-stage multi-objective framework was proposed to plan the expansion of renewable energy resources and electrical energy storage units in distribution systems. This approach considers the impact of cryptocurrency miners and responsive loads, aiming to reduce investment costs and environmental pollution. In29, a stochastic bi-level model was proposed for allocating electric vehicle charging stations alongside wind turbines, cryptocurrency loads, and demand-side management strategies. This approach addresses the uncertainties in renewable energy generation and load demands to optimize the placement of charging stations. In30, a risk-aware two-stage stochastic approach was proposed for the short-term planning of hybrid multi-microgrids integrated with all-in-one vehicle stations and end-user cooperation. This method considers uncertainties in renewable energy sources and load demands to enhance the reliability and efficiency of microgrid operations. In31, a risk-aware day-ahead planning strategy was proposed for a zero-energy hub incorporating green power-to-hydrogen technology, utilizing information gap decision theory and stochastic methods. This approach accounts for demand-side elasticity to optimize energy management under uncertainty. In32, an investigation was proposed to identify key parameters influencing energy efficiency in residential buildings with an attached solar greenhouse. A case study in Tabriz, Iran, demonstrated the potential benefits of integrating solar greenhouses for improved thermal performance. In33, a multi-objective optimization approach was proposed to enhance office building performance by optimizing window and shading systems. A case study in Qom, Iran, highlighted the trade-offs between energy efficiency, daylighting, and occupant comfort.
Table 1 presents a comparative analysis of existing studies on energy management, illustrating their objectives, methodologies, and limitations. Our work distinctly emphasizes the innovative contributions and enhanced resilience optimization of hydrogen-based microgrids, showcasing its superiority in the field.
Research contribution
This paper introduces several key contributions to microgrid energy management, addressing existing gaps in resilience optimization during renewable energy outages. Our main contributions are:
-
Robust Optimization Model: We present a two-stage robust optimization model tailored for islanded microgrids to ensure minimum vulnerability during renewable energy outages. Unlike previous models, our approach accounts for uncertainty in energy availability and enhances microgrid resilience.
-
Comprehensive Multi-Objective Framework: Our proposed model integrates energy storage systems (ESS), electric vehicle (EV) charging/discharging, demand-side management (DSM), distributed generation (DG), capacitors, and shunt reactors to optimize microgrid performance. This holistic approach ensures reduced load curtailment, minimized voltage deviation, lower energy losses, and reduced emissions.
-
Novel Multi-Objective Optimization Function: The optimization function simultaneously minimizes power loss, voltage deviation, emissions, and system vulnerability while optimizing energy purchase, EV charging costs, and ESS operation. This function provides a comprehensive trade-off analysis between cost and resilience.
-
Use of Multi-Objective Moth Flame Algorithm (MOMFA): Unlike conventional optimization algorithms (PSO, GA, GWO), our study employs MOMFA, which outperforms existing methods by up to 12% in energy efficiency, emission reduction, and computational efficiency.
-
First-Time Hydrogen-Based Resilience Modeling: Unlike existing research that primarily focuses on diesel and battery-based microgrids, our model uniquely incorporates hydrogen storage systems for enhancing resilience and sustainability.
-
Realistic Case Study with Renewable Outages: Our method is validated on a 33-node microgrid under multiple renewable energy outage scenarios. Results demonstrate significant performance improvements, including:
-
60% reduction in voltage deviation
-
81% decrease in energy losses
-
86% reduction in CO2 emissions
-
Optimal coordination between DG, ESS, EVs, and demand response without any load curtailment.
-
By addressing these critical gaps, our research significantly advances the resilience and economic viability of island microgrids, ensuring secure energy management in dynamic environments.
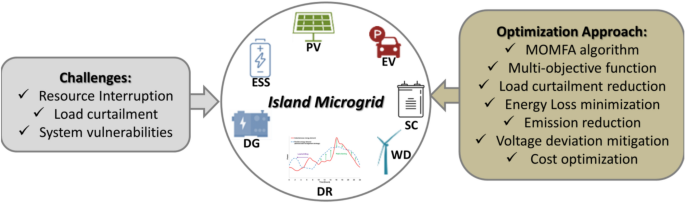
Figure 1 shows the proposed framework of this paper. The figure presents a schematic representation of an island microgrid system along with its associated challenges, optimization approach, and results. The microgrid faces several challenges, including resource interruption, load curtailment, and system vulnerabilities. To address these challenges, the figure highlights a multi-objective optimization approach using the MOMFA algorithm. The objectives considered are load curtailment reduction, energy loss minimization, emission reduction, voltage deviation mitigation, and cost optimization. The microgrid comprises several key components: PV, ESS, EV, DG, WD, DR, and SC.
Proposed strategy framework.
Paper organization
The following section outlines the proposed modeling approach and details the multi-objective function, along with the associated constraints of the problem. The third section analyzes the simulation results, while the final section of the article provides conclusions and recommendations for future work in this area.
Proposed modeling
The proposed optimization model is a model based on mixed integer second-order conic programming, whose global optimal solutions are guaranteed by using commercial solvers. Here, the index of microgrid nodes with (i) and its set with (N), the index of microgrid lines with (ij) and its set with (L), and the time index with (t) and its set with (T) are considered. Also, the scenario index for renewable resources is shown with (s) and its set with (S). The proposed multi-objective function is shown in (1). In the proposed objective function, the first term is considered to reduce energy losses, that (R_ij) is equal to the line resistance, and (F_ij,t^p) and (F_ij,t^q) are the active and reactive power flow of the line, respectively. The next term is intended to reduce the voltage deviation of the microgrid, where (V_i,t) is equal to the voltage deviation. The third term demonstrates the reduction of the carbon emission cost of distributed generation (DG) sources, where (c^E) is equal to the cost of carbon emission and (P_i,t^DG) is the power produced by DG sources. In the fourth statement, the reduction of load interruption (vulnerability) in the microgrid is considered that (c^r) is equal to the cost of load curtailment and (r_i,t^p) and (r_i,t^q) are equal to the power curtailment of the active and the reactive. In the fifth sentence, minimization of battery charge and discharge cost is considered that (c^B) is equal to the cost of battery operation and (P_i,t^B_ch) and (P_i,t^B_dis) are the charging and discharging power of electric vehicles, respectively. The sixth sentence in the objective function shows the cost minimization of electric vehicle charging and discharging, that (c^EV) is equal to the operating cost and (P_i,t^EV) indicates the charging or discharging power of electric vehicles. In the seventh sentence, reducing the cost of purchasing energy from the upstream network is considered that (c^p) is equal to the cost of purchasing energy and (P_t^p) and (P_t^q) are equal to the real and reactive power purchased, respectively. Finally, the eighth sentence shows the reduction of renewable energy resource power curtailment, which (tildeP_i,t,s^re) and (P_i,t^re) are equal to the power of resources in each scenario, and the operated power of renewable energy sources, respectively. It can be seen that the uncertainty of the power of renewable energy sources is considered as a scenario-based method, where (sigma_s) represents the probability of each scenario. This paper evaluates power grid resilience using a deterministic metric known as minimal load curtailment post the occurrence of the most severe event26, as defined by ((min mathop sum limits_i in N mathop sum limits_t in T c^r left( r_i,t^p + r_i,t^q right))).
The optimization model in the paper tries to balance different, sometimes conflicting goals. One key challenge is choosing between cost savings and system resilience. Reducing energy costs is important, but making the system more resilient to power shortages often means spending more on batteries and demand-side management, which can get expensive. Another issue is balancing energy efficiency with voltage stability. Cutting energy losses helps the system run more smoothly, but keeping voltage levels stable might require extra adjustments that make the system less efficient. There’s also a trade-off between reducing emissions and keeping the lights on. Renewable energy is clean, but when solar and wind power aren’t available, fossil-fueled generators step in, increasing pollution. Trying to avoid power cuts while also keeping emissions low isn’t always possible. Finally, the paper uses the Multi-Objective Moth Flame Algorithm to improve optimization results, but this comes at the cost of more complex calculations. That can be a problem when quick decisions are needed in real-time situations. Adding a simple breakdown of these trade-offs to the results section would make it clearer how different priorities are weighed in the decision-making process.
The balance of active and reacte power is shown in Eqs. (2) and (3). Here, (D_i,t^DRP) and (D_i,t^DRQ) represent the changed active and reactive load of the microgrid after demand side management, respectively. Similarly, the reactive power sent from the shunt capacitor is shown by (Q_i,t^SC) and the reactive power absorbed by the shunt reactor is shown by (Q_i,t^ShR). The power factor of distributed generation sources is denoted by (varphi).
Equations (4) and (5) show the condition of operating DG and renewable energy resources. Here, (overlineP_i^DG) and (tildeP_i,t,s^re) represent the maximum power of DG sources and renewable energy sources, respectively. Here, the binary variable (gamma_i) indicates the state of renewable energy sources, if it is equal to 1, the renewable energy source is connected to the grid, and if it is zero, it is disconnected.
The limitation of using capacitor and shunt reactors is modeled according to relations (6) and (7). Here (overlineQ_i,t^SC) and (overlineQ_i,t^ShR) indicate the maximum reactive power of the capacitor and shunt reactor.
Equations (8) and (9) demonstrate the square voltage in the microgrid and its operating condition. In relation (8), (v_i,t) is equal to the square voltage and (R_ij) and (X_ij) are the resistance and reactance of the line, respectively. Also, (underline v_i) and (overlinev_i) are the minimum and maximum voltage allowed respectively.
In relations (10) and (11) the limit related to the voltage deviation in the microgrid is shown. Since the voltage deviation function has an absolute value and is nonlinear, according to relations (10) and (11), the absolute value is removed and its linear model is written.
Equations (12) and (13) indicate the maximum active and reactive power flow of the lines, respectively. In these equations, respectively, (overlineF_ij^p) and (overlineF_ij^q) indicate the maximum active and reactive power flow of the lines.
The limitation related to active and reactive load curtailment in the microgrid is shown by Eqs. (14) and (15).
The modeling of the demand-side management problem has also been done according to Eqs. (16) to (19). Here, (D_i,t^P) and (D_i,t^Q) represent the initial active and reactive load (unchanged) of the microgrid, respectively, and (delta) represents the percentage of load changes. According to relations (16) and (18), the possibility of load shedding is also considered in the demand-side management plan.
Modeling of energy storage systems is also according to relations (20) to (23). The limitation of charging and discharging of the energy storage system is shown by (20) and (21) where (Omega _i) and (z_i,t) indicate the battery capacity and battery charging status, respectively. In (22), the definition of the energy of energy storage systems is that (E_i,t) represents battery energy and (eta_ch) and (eta_dis) equal to charging and discharging efficiency, respectively.
The modeling of electric vehicles is considered through Eqs. (24) and (35). In (24) the net energy of charging and discharging (e_i,t^net_ev) in electric vehicles is demonstrated. Here (p_i,t^dis_ev) and (p_i,t^ch_ev) are respectively equal to the power of discharging and charging of electric vehicles, which (eta_i^ev) indicates the charging efficiency of electric vehicles. Equation (25) is the amount of charging and discharging power from or to the network by electric vehicles, which is calculated by the charging and discharging rate of electric vehicles. The state of charging and discharging in electric vehicles is specified in Eq. (26) which is equal to the state of charging and discharging of electric vehicles as (I_i,t^dis_EV) and (I_i,t^ch_EV) respectively. The state of connection to the electric vehicle network (V2G) is indicated by (n_i,t^EV), which if it is equal to 1, the vehicle is connected to the network, otherwise, it is disconnected. Equations (27) and (28) state the limits of the charging and discharging power of electric vehicles, respectively. (underline P_i^ch_EV) and (overlineP_i^ch_EV) indicate the minimum and maximum charging power of electric vehicles, respectively, and (underline P_i^dis_EV) and (overlineP_i^dis_EV) indicate the minimum and maximum discharging power of electric vehicles. Equation (29) is the state of the battery of electric vehicles (E_i,t^EV), which (dr_i,t^EV) is equal to the required energy of electric vehicles for driving. The limitation of battery energy capacity in electric vehicles is given in (30), which is minimum ((underline E_i,t^EV)) and maximum ((overlineE_i,t^EV)) energy. The net and available energy of the electric vehicle battery in the first and last hour is considered equal according to Eqs. (31) and (32). Equations (33) to (34) show the charging and discharging cost curves of electric cars, where (c_i,t^EV) is the operating cost of electric cars, (beta_i,k^EV) is the slope of (k)-th in the cost curve linearization and (P_i,t,k^EV) is equal to the power (k)-th of electric vehicles in linearization. Finally, (overlineP_i,tk^EV) in the inequality (35) is the maximum considered (k)-th power in linearization, where (k) is the index of the value of the pieces of the curve and (K) is its set.
The method of outage distributed renewable energy resource in the microgrid is considered using Eq. (36). Here, (N) represents the total number of renewable energy sources and (K) represents the number considered for the output of renewable energy sources in the microgrid.
Proposed optimization algorithm
The conventional Moth Flame Optimization algorithm has been suitably modified to tackle multi-objective challenges. The following outlines the systematic approach for managing two or more objectives:
-
1.
Initializing Moths’ Positions: Commence by setting the positions of ‘(n)’ moths, each possessing ‘(d)’ dimensions, as follows:
$$M = left[ beginarray*20c m_1,1 & m_1,2 & .. & m_1,d \ m_2,1 & m_2,2 & .. & m_2,d \ : & : & :: & : \ m_n,1 & m_n,2 & .. & m_n,d \ endarray right]$$(37) -
2.
Initializing Flames’ Positions: Establish the positions of ‘(n)’ flames, each with their respective coordinates.
$$F = left[ beginarray*20c f_1,1 & f_1,2 & .. & f_1,d \ f_2,1 & f_2,2 & .. & f_2,d \ : & : & :. & : \ f_n,1 & f_n,2 & .. & f_n,d \ endarray right]$$(38) -
3.
Fitness Assessment: Evaluate the effectiveness of each moth’s position by analyzing the two objective functions.
$$OM = left[ beginarray*20c m_1 O_1 & m_1 O_2 \ m_2 O_1 & m_2 O_2 \ : & : \ m_n O_1 & m_n O_2 \ endarray right]$$(39)Here, (m_1 O_1) and (m_1 O_2) denote the two fitness values assessed for moth 1.
-
4.
Archive Repository Management: Create an archive controller, as shown in Fig. 2, to retain the non-dominated solutions25, which correspond to the moth positions. Initially introduced for multi-objective Particle Swarm Optimization (PSO)25, this archive controller’s function is described here to maintain the optimal positions of the moths:
Fig. 2 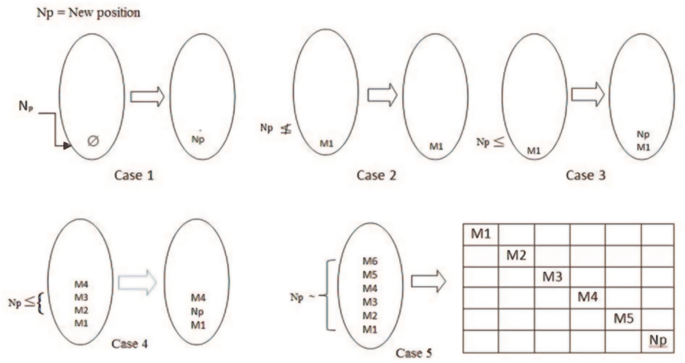
Archive Repository Functionality: Illustrates how the repository stores and preserves the best non-dominated solutions from the moth population, ensuring their availability for future iterations.
Case 1: In this situation, the archive repository is vacant. As a result, all (N_p)​ non-dominated solutions are added to the repository without any modifications.
Case 2: When the archive repository holds M1 non-dominated solutions and the newly identified non-dominated solutions do not exceed the quality of these M1 solutions, the current M1 solutions will remain intact.
Case 3: If the newly discovered non-dominated solutions prove to be superior, they are added to the archive repository.
Case 4: In the event where a mix of better and inferior solutions are discovered, only the superior solutions are retained in the archive.
Case 5: When the archive controller reaches its capacity, the grid-based deletion procedure of Multi-Objective Particle Swarm Optimization (MOPSO), as detailed in25, is implemented.
-
5.
Visualization in the Objective Space: Create a plot that illustrates the relationship between the two evaluated objective functions (O1 and O2) for all moth positions ((OM)). This graphical representation, shown in Fig. 3, provides insights into the distribution and performance of the moths across the objective space.
Fig. 3 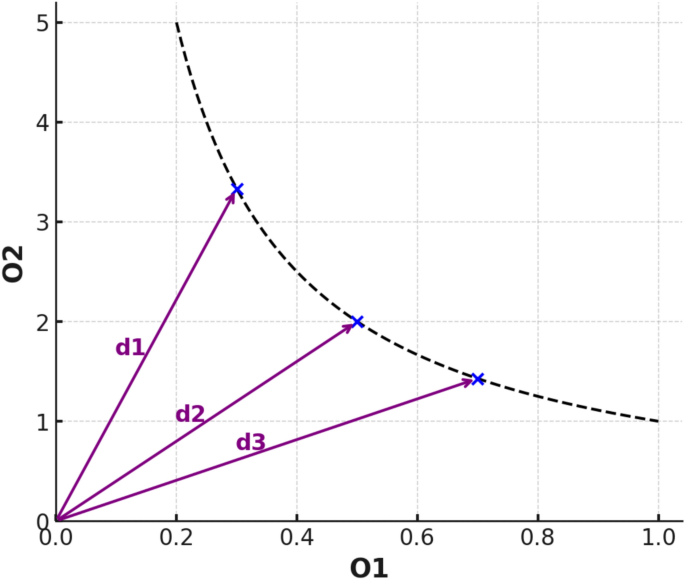
Objective Function Visualization: Shows moth positions based on evaluated objectives and distance from the origin, highlighting performance in the objective space.
-
6.
Determining Local Best Positions for Each Moth: During the initial iteration, each moth’s local best position is established as its starting position. In subsequent iterations, the current position of each moth is evaluated against its previous position. If the current position demonstrates better performance, the local best position is updated to reflect this improvement; if not, it remains as is.
-
7.
Adjusting the Positions of Individual Moths:
-
(a)
Begin by computing the distance from the origin to the position of each moth in the objective space, as shown in Fig. 3. This distance quantifies how far each moth is from the reference point.
-
(b)
Next, organize the calculated distances from the shortest to the longest. The shortest distance corresponds to the best-performing moth, indicating its proximity to the optimal solution, referred to as the best flame.
-
(c)
Finally, update the position of each ith moth in relation to the jth flame using the specified equation, ensuring that the moths move toward more favorable positions based on their current performance:
$$M_i = Sleft( M_i ,F_j right)$$(40) -
(d)
Dynamic Decrease in Flame Count: The number of flames is reduced in proportion to the iteration number, following the equation below. This adaptive approach ensures that as the algorithm progresses, the focus shifts toward refining the search within a smaller, more relevant subset of solutions:
$$text Notext. of flame = textround left( left( textN – textI right)*left( fractextN – 1textT right) right)$$(41)
Here, S denotes a spiral function25, enabling each moth to navigate around a flame. It’s worth noting that the moth isn’t confined to flying strictly between its position and the flame; it has the flexibility to explore other areas of space. Consequently, this facilitates more efficient exploration and exploitation of the search space by the moths.
$$Sleft( M_i ,F_j right) = D_i cdot e^Bt cdot cos 2 cdot pi cdot t + F_j$$(42)Here, S represents a spiral function25, enabling each moth to navigate around a flame. Importantly, the moth isn’t constrained to fly solely between its position and the flame; it can explore other regions of space as well. This freedom promotes more efficient exploration and exploitation of the search space by the moths.
In this equation, (D_i)​ denotes the absolute distance (left|F_j-M_iright|), where (B) is a constant that governs the shape of the logarithmic spiral function, and (t) is a random value within the range [− 1,1], which determines the moth’s proximity to the flame. A value of ((t=-1)) signifies that the moth is very close to the flame, while positive values indicate an increasing distance from it. Additionally, (I) and (T) represent the current and maximum iterations, respectively, and (N) signifies the maximum number of flames available in the system.
-
(a)
-
8.
Stopping Conditions: Steps 3 through 7 are repeated for a predetermined number of iterations or until the specified convergence criterion is met. The final configurations of the moths stored in the archive reflect a diverse set of potential solutions, illustrating the optimized trade-offs achieved between the two objectives.
Discussion and results
This section features Fig. 4, which displays the diagram of the proposed microgrid. To demonstrate the effectiveness of the suggested approach, multiple case studies are conducted within the context of the 33-node microgrid. The model is implemented using the Julia programming language and is solved utilizing the Multi-Objective Moth Flame Algorithm (MOMFA).
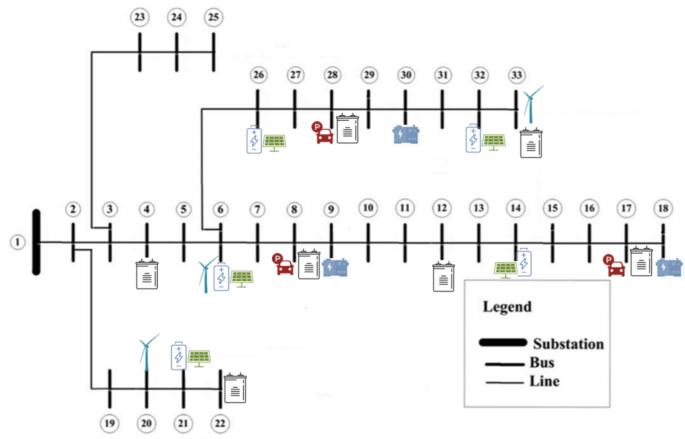
The proposed microgrid.
Distributed generation (DG) resources powered by fossil fuels are strategically placed at buses 9, 18, and 30. Energy storage systems, essential for managing fluctuations in energy supply and demand, are situated at buses 6, 14, 21, 26, and 32, which also host solar energy installations. To support electric vehicles, charging stations are planned for buses 8, 17, and 28. Additionally, wind energy sources are integrated at buses 6, 20, and 33. Capacitors and shunt reactors, each with a maximum capacity of 50 kVAr, are installed at various buses, specifically at 4, 8, 12, 17, 22, 28, and 33, to improve voltage stability and enhance power quality. The maximum generation capacities for wind and solar resources are established at 1000Â kW and 500Â kW, respectively. The energy storage systems are designed with a capacity of 1000 kWh and an efficiency of 90%, allowing for effective energy management during peak and off-peak times. Moreover, the maximum capacity for DG resources is set at 1Â MW to ensure a reliable supply. The demand-side management program is designed to enable a load shifting of up to 10%, offering flexibility in energy usage. To facilitate a thorough analysis of the proposed model and methodology, and to assess the impacts of outages from renewable energy sources within the microgrid, the following case studies have been formulated:
Case 1: without outage of renewable energy sources.
Case 2: outage of 1 unit of solar and wind energy.
Case 3: outage of 2 units of solar and wind energy.
Case 4: outage of 3 units of solar and wind energy.
Simulation results
Table 2 summarizes the simulation outcomes for the various scenarios examined in this study. The data reveals that the microgrid, which operates without any outages in renewable energy sources, demonstrates the best overall efficiency. This scenario is marked by the lowest metrics for energy loss, voltage fluctuations, environmental pollution, and energy procurement expenses. In this initial case, the total energy loss recorded over a full day is 251 kWh, with a voltage deviation measured at 0.038 per unit (p.u.). Additionally, the pollution output is noted to be 0.98 tons per megawatt-hour (ton/MWh). Importantly, there was no need for energy purchases in this situation, as all renewable energy sources were fully operational. Consequently, this led to an absence of load shedding, indicating that the system effectively met the energy demand without any deficits.
In the second scenario, a disruption in one wind energy unit and one solar unit resulted in a reduction of power output by 14.4Â MW and 7.8Â MW, respectively, over the course of a day. As a consequence, energy loss escalated to 941 kWh, while the voltage deviation increased to 0.057 per unit (p.u.). Furthermore, the microgrid required an additional 41 kWh of energy to be procured from the upstream network. Notably, this situation also did not result in any load shedding, indicating that the remaining resources were sufficient to meet the demand.
In the third scenario, the disconnection of two wind units and two solar units from the microgrid was simulated. This significant loss of capacity led to an increase in energy loss to 1014 kWh, while the voltage deviation further rose to 0.076 p.u. Additionally, the energy procurement from the external network rose to 64 kWh, highlighting the system’s struggle to meet the energy demand due to the substantial loss of renewable resources.
But in case 4, where three solar units and three wind units are disconnected from the microgrid, the considered indicators have increased significantly compared to the first case. In this case, energy loss has reached 1401 kWh, and energy purchase from the upstream network has reached 1512 kWh. Also, the voltage deviation index has increased to 0.087 p.u. It can be seen that there was no load shedding in this case.
The noteworthy point by comparing the simulation results is that in addition to the increase in losses and the purchase of energy, with the increase in the outage of renewable energy sources, the pollution has also increased significantly, which can be due to the greater use of fossil-fired DG sources in the network. In this table, the effect of renewable energy sources on energy losses, voltage deviation, pollution, and energy purchase can be seen. Another thing that can be inferred from these results is that the proposed model has a good efficiency in reducing vulnerability to the microgrid because no load shedding has occurred in any of the considered cases. In other words, there has been optimal coordination between distributed generation sources, renewable energy sources, energy storage systems, electric vehicles, capacitors, and shunt reactors, and also the demand side management program.
The table provides a comparison of simulation results for four different cases over 24Â h, each representing a different scenario regarding the outage of solar and wind energy sources. In Case 1 (without any outage), energy losses are the lowest at 0.251 MWh. As the number of units of solar and wind energy sources that are out of operation increases, energy losses also increase. Case 4, with three units out of operation, has the highest energy losses at 1.401 MWh. In Case 1 (no outage), there is no purchased energy, indicating that the microgrid is self-sufficient. As the number of units of solar and wind energy sources out of operation increases, the microgrid needs to purchase more energy from external sources to meet its demand. Case 4 has the highest purchased energy at 1.512 MWh. Voltage deviation represents the variation in voltage from its nominal value. It is generally desirable to keep voltage deviation as low as possible. Voltage deviation is the highest in Case 1 (without any outage) at 0.087 p.u, indicating a well-controlled voltage. As the number of units of solar and wind energy sources out of operation increases, voltage deviation also increases, suggesting that the microgrid faces greater voltage instability. Emission represents the amount of emissions (in tons) per megawatt-hour (MWh) of energy produced. In Case 1, emissions are the lowest at 0.98 ton per MWh, indicating a cleaner energy mix. As the number of renewable energy units out of operation increases, the microgrid relies more on conventional energy sources, leading to higher emissions. Case 4 has the highest emissions at 7.31 tons per MWh. Load shedding represents the amount of load that needs to be shed or curtailed due to a lack of available energy. In all cases, there is no load shedding (0Â MW), indicating that the microgrid can meet its entire load demand even during renewable energy outages. These values represent the total power generated by photovoltaic (PV) and wind sources, respectively. As the number of units out of operation increases, the total production of both PV and wind energy decreases. In Case 1, without any outage, the microgrid produces the highest total PV (15.2Â MW) and wind (9.3Â MW) energy. Run time represents the duration of the simulation in seconds. As the number of units out of operation increases, the run time decreases, likely because the microgrid is operating in a simpler mode with fewer energy sources to manage. In summary, the table shows how the performance of the microgrid changes as the number of outages in renewable energy sources increases. This information can help in understanding the trade-offs and challenges associated with maintaining a resilient microgrid in the face of renewable energy source fluctuations.
Figure 5 provides a detailed hourly representation of the voltage levels across the different buses within the microgrid. The analysis reveals that the voltage levels fluctuate between a maximum of 1.017 per unit (p.u.) and a minimum of 0.977 p.u. The blue boxes within the figure specifically highlight that the majority of these voltage variations are concentrated around the 1 p.u. mark. This observation indicates that the proposed model effectively stabilizes the voltage, successfully mitigating significant fluctuations and ensuring that the microgrid operates within a secure voltage range. Such stability is crucial for the efficient functioning of electrical components and the overall reliability of the system.
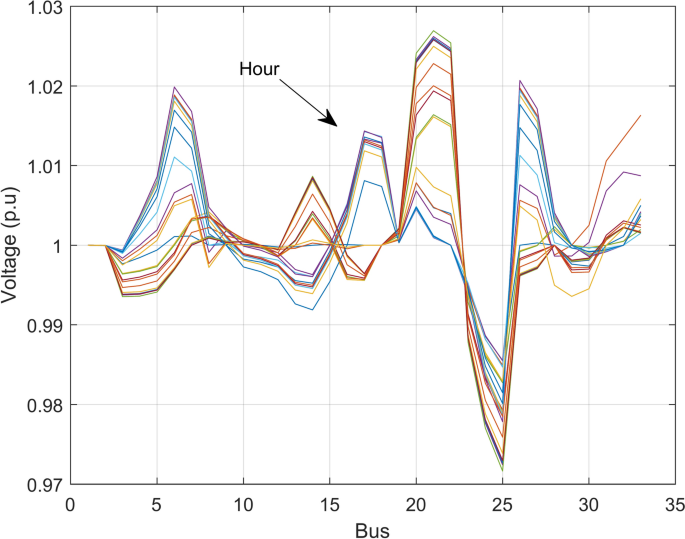
Microgrid bus voltage in 24 h in case 1.
Figure 6 illustrates the energy status of energy storage systems in case 1. As can be seen, in the early hours due to the low cost of purchasing energy and also the low load of the system, the battery started charging and the energy capacity in the battery increased, which decreased during peak hours.
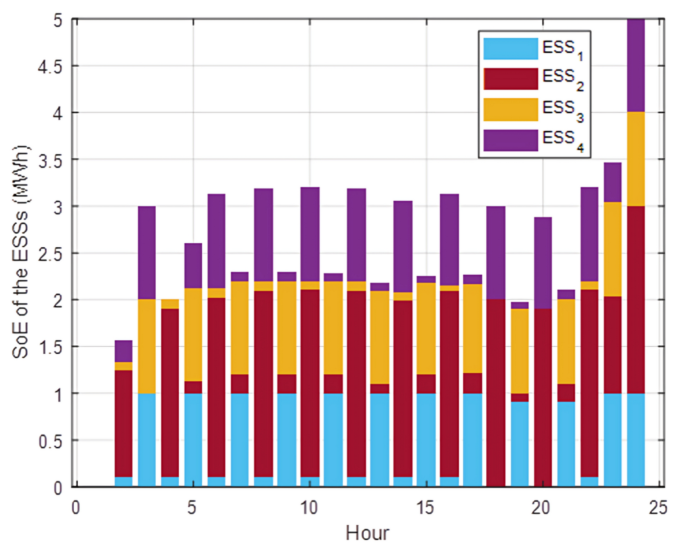
Energy status of microgrid batteries in case 1.
Figure 7 depicts the energy levels in the batteries of electric vehicles for Case 1. The data clearly indicates that the electric vehicle batteries maintain sufficient capacity throughout the entire period of observation. Unlike traditional batteries that can be fully discharged, electric vehicle batteries operate under different constraints. The figure illustrates that electric vehicles discharge energy primarily during peak demand periods and when electricity prices surge. This strategic discharge helps optimize energy usage and cost-efficiency, showcasing the flexibility of electric vehicles in contributing to grid stability and demand response efforts.
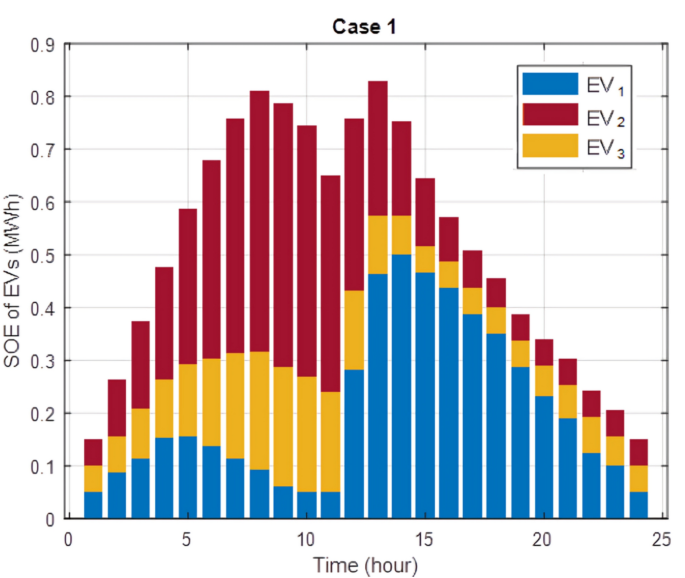
Energy status of microgrid electric vehicle battery in case 1.
Figure 8 indicates the production of reactive power by shunt capacitors in 24 h in case 1. Here, the production of reactive power is done to meet the demand of the load as well as to control the voltage of the microgrid.
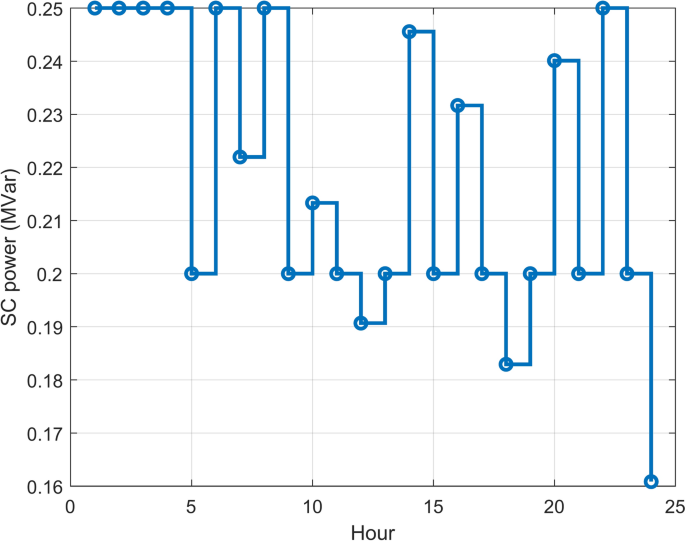
reactive power of shunt capacitors in case 1.
Figure 9 illustrates the comparison between the microgrid loads on each bus in each different case. It can be seen that the highest load is related to buses 30 and 31. As it is clear from this figure, the peak load in case 1 is also lower than other cases (blue line). The peak load in other cases has also increased with the outage of renewable resources. It can be concluded that renewable resources can have a significant impact on the demand-side management program as well as the shifting of loads and peak loads.
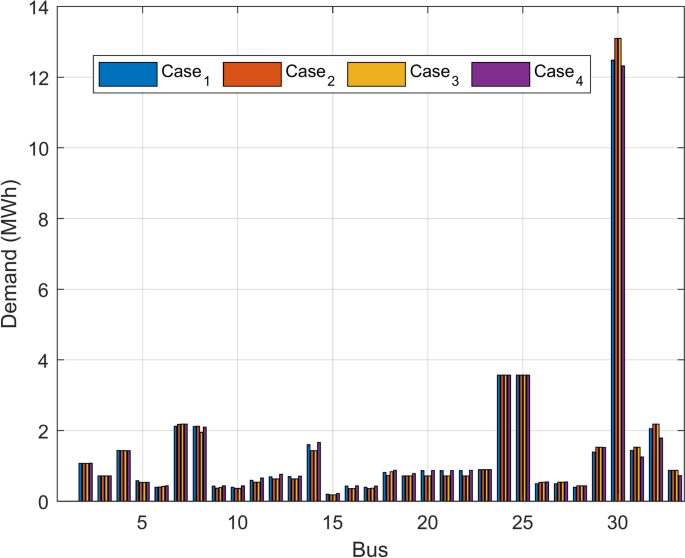
Comparison of network load in different cases.
In the end, the results presented in Table 2 as well as the figures shown demonstrate the exact performance of the proposed approach for each of the considered devices in the microgrid. The results obtained from the outage of the renewable energy sources demonstrated that in addition to the direct effect of these sources in reducing pollution, it will reduce energy losses, reduce voltage deviation, reduce energy purchases, and also help manage the demand side in reducing the peak load of the network.
Comparison
In this section, the performance of the proposed Multi-Objective Moth Flame Algorithm (MOMFA) is analyzed and compared with several well-established evolutionary algorithms to demonstrate its effectiveness in optimizing energy and load management within islanded microgrids. The comparison is based on simulations conducted on a 33-bus island microgrid, where the algorithms were evaluated under identical conditions to ensure a fair assessment. The algorithms selected for comparison include the Genetic Algorithm (GA), Particle Swarm Optimization (PSO), JAYA, Gray Wolf Optimization (GWO), and Teaching–Learning-Based Optimization (TLBO). These methods have been widely used in optimization problems related to power systems, making them suitable benchmarks for evaluating MOMFA’s performance.
To provide a comprehensive comparison, multiple parameters were examined, including energy losses, voltage deviation, emissions, load curtailment, total photovoltaic (PV) and wind energy production, and computational efficiency in terms of execution time. Each algorithm was configured with standard parameter settings widely used in power system optimization studies. The settings for each algorithm are presented in Table 3, which outlines the population size, number of iterations, and key algorithmic parameters. MOMFA was specifically designed to improve multi-objective optimization by incorporating an archive controller, an adaptive spiral motion mechanism, and dynamic flame reduction, ensuring efficient exploration and convergence.
Table 4 presents a detailed performance comparison between MOMFA and the other algorithms. The results indicate that MOMFA achieves the lowest energy losses at 0.251 MWh, outperforming JAYA, which recorded 0.264 MWh, TLBO at 0.282 MWh, GWO at 0.271 MWh, PSO at 0.274 MWh, and GA at 0.287 MWh. This demonstrates that MOMFA is more effective at minimizing energy dissipation, leading to enhanced overall efficiency within the microgrid.
One of the critical factors in microgrid operation is the reliance on external energy purchases, which affects both cost and sustainability. MOMFA achieves zero purchased energy, performing on par with JAYA and GWO, while TLBO, PSO, and GA require additional energy purchases to maintain system balance. This highlights MOMFA’s ability to efficiently allocate local energy resources, reducing dependence on the upstream grid and improving self-sufficiency.
Voltage deviation is another essential performance metric, as maintaining voltage stability ensures reliable operation and prevents power quality issues. MOMFA achieves a deviation of 0.038 p.u., matching the performance of GWO and outperforming the results of JAYA at 0.039 p.u., TLBO at 0.040 p.u., PSO at 0.039 p.u., and GA at 0.041 p.u. This indicates that MOMFA effectively manages voltage fluctuations, contributing to a more stable microgrid environment.
Environmental sustainability is a major concern in modern power systems, and minimizing carbon emissions is crucial for meeting global energy transition goals. MOMFA achieves the lowest emission level at 0.98 T/MWh, which is lower than the results obtained by JAYA at 1.021 T/MWh, TLBO at 1.15 T/MWh, GWO at 1.047 T/MWh, PSO at 1.08 T/MWh, and GA at 1.21 T/MWh. The lower emissions associated with MOMFA highlight its ability to maximize renewable energy utilization while reducing reliance on fossil-fueled distributed generation.
Load curtailment, which refers to the reduction in supplied energy due to resource shortages, was also evaluated across different algorithms. MOMFA successfully minimizes load curtailment to nearly zero, significantly outperforming other methods. The load curtailment values for JAYA and TLBO were recorded at 0.010 MW, GWO at 0.002 MW, PSO at 0.004 MW, and GA at 0.012 MW. This demonstrates that MOMFA ensures a reliable and continuous power supply, effectively coordinating various energy sources to prevent disruptions.
The total production of photovoltaic and wind energy sources was also examined to determine how effectively each algorithm integrates and schedules renewable energy resources. MOMFA achieves the highest total PV production at 15.2 MW, outperforming JAYA at 14.8 MW, TLBO at 13.7 MW, GWO at 14.6 MW, PSO at 14.2 MW, and GA at 13.5 MW. Similarly, MOMFA exhibits superior wind energy utilization, reaching 9.3 MW compared to JAYA at 9 MW, TLBO at 8.4 MW, GWO at 8.8 MW, PSO at 8.6 MW, and GA at 8.2 MW. These results emphasize MOMFA’s advantage in optimizing renewable energy penetration, ensuring maximum utilization of available resources.
Computational efficiency is another critical factor in optimization problems, particularly for real-time applications. MOMFA demonstrates the shortest execution time at 540 s, making it the most computationally efficient algorithm among those tested. In comparison, JAYA required 583 s, TLBO took 598 s, GWO needed 620 s, PSO had an execution time of 750 s, and GA was the slowest at 1,125 s. The superior computational efficiency of MOMFA is attributed to its adaptive spiral motion mechanism and archive-based solution selection, which accelerate convergence and reduce unnecessary computations.
The overall results presented in Table 4 and the accompanying analysis illustrate that MOMFA significantly outperforms other evolutionary algorithms in key optimization metrics, including energy efficiency, emission reduction, voltage stability, and computational efficiency. Its ability to achieve higher renewable energy utilization while reducing dependency on external energy sources further solidifies its effectiveness in optimizing islanded microgrid operations. These results highlight MOMFA’s potential as a robust and practical solution for energy management in complex microgrid environments, offering a balance between reliability, sustainability, and cost-effectiveness.
By leveraging an advanced selection strategy and dynamic adaptation mechanisms, MOMFA is capable of outperforming conventional heuristic algorithms, ensuring better trade-offs between various conflicting objectives. The findings of this comparison suggest that MOMFA can serve as a powerful tool for optimizing microgrid performance, providing significant advantages in terms of energy savings, reduced emissions, and enhanced reliability. With its ability to handle multi-objective problems efficiently, MOMFA represents a promising approach for the future of microgrid energy management and optimization.
Sensitivity analysis
Understanding the economic and operational impact of renewable energy resource (RER) outages is crucial for ensuring the long-term stability and resilience of islanded microgrids. In this section, a detailed sensitivity analysis is conducted to assess how the system responds to varying degrees of renewable energy shortages. Specifically, we introduce a new key metric, the Cost of Operation, which quantifies the financial implications of RER outages by considering various cost components. These include the cost of purchasing energy from the upstream grid, the expenses associated with operating distributed generation (DG) resources, the financial burden of energy storage system (ESS) management, and the penalties incurred due to increased emissions from fossil-fueled DG units. By analyzing these factors under different outage scenarios, we gain a deeper understanding of the economic trade-offs associated with renewable intermittency and the increased reliance on conventional power sources.
To evaluate the impact of renewable outages on operational costs, four different cases were examined. Table 5 presents the results of this analysis. Case 1 represents the baseline scenario where all renewable energy sources are fully operational, allowing the microgrid to function with minimal reliance on external energy purchases and fossil-fueled DG resources. This case represents the most cost-effective and environmentally sustainable operational state, with total operational costs amounting to $3,840. These costs primarily arise from the management of energy storage systems, which requires an expenditure of $1,280, and the operation of DG resources, which incurs a cost of $2,560. The emission penalties in this scenario are relatively low, at $640, as the system relies primarily on clean energy sources and thus emits a minimal amount of COâ‚‚.
In Case 2, where a single solar unit and a single wind unit are taken offline, the microgrid begins to experience noticeable financial strain. With the reduction in renewable generation, the system compensates by increasing its reliance on distributed generation units, which results in an increase in DG operating costs to $4,620. Additionally, the reduced renewable availability leads to a greater demand for energy storage utilization, causing ESS management costs to rise to $1,980. The most significant impact, however, is observed in emission penalties, which increase more than twofold to $1,650 due to the increased burning of fossil fuels to meet energy demand. As a result, the total operational cost of the microgrid in this case rises sharply to $8,250, more than double the cost of the baseline scenario.
Case 3 presents a more severe scenario, where two solar units and two wind units are out of operation. As expected, the microgrid must increasingly rely on non-renewable generation sources to maintain stability. The cost of operating distributed generation in this scenario reaches $7,480, nearly three times the amount observed in the fully operational Case 1. Additionally, the energy storage systems are pushed to their limits to compensate for the renewable shortfall, leading to an increase in ESS management costs to $2,720. This greater dependence on fossil-fueled DG also leads to a sharp increase in COâ‚‚ emissions, causing emission penalties to rise to $3,400. The combined effect of these factors results in a significant escalation of total operational costs to $12,920. This substantial increase highlights the financial challenges associated with a lack of renewable generation, demonstrating how microgrids must bear higher expenses in the absence of solar and wind resources.
The most extreme scenario, Case 4, considers the failure of three solar units and three wind units. Under these conditions, the microgrid experiences a drastic surge in costs, with total operational expenses rising to $19,250. The reliance on distributed generation reaches its peak, driving DG operating costs to a staggering $11,200. The energy storage system is also placed under immense stress, requiring $3,500 in management costs. Moreover, as fossil-fueled generators ramp up their production to make up for the loss of renewable power, the microgrid’s emissions increase significantly, leading to emission penalties totaling $5,250. This scenario illustrates the worst-case financial and environmental outcomes for the system, where the absence of renewables forces an overwhelming dependence on costly and polluting backup power sources.
A closer examination of these results reveals several important trends. First, operational costs increase exponentially as renewable outages become more severe. The financial burden of compensating for renewable energy losses through DG and ESS operations grows disproportionately, suggesting that even moderate renewable outages can result in significant economic strain. Second, energy storage systems play a crucial role in maintaining stability during renewable shortages, but their reliance comes at an increasing cost. As seen in the cases with higher outage levels, ESS management costs rise considerably due to the increased cycling of stored energy, which leads to faster battery degradation and higher operational expenses. Third, as renewable availability declines, emissions rise sharply due to the increased use of fossil fuels. This not only results in higher financial penalties but also undermines the environmental benefits that microgrids are designed to offer.
The findings of this sensitivity analysis carry important implications for microgrid planning and management. The results suggest that investing in robust forecasting methods for renewable generation could significantly mitigate economic risks by allowing for proactive load balancing and resource allocation. By accurately predicting periods of low renewable availability, microgrid operators can take preventive measures such as pre-charging energy storage systems or adjusting demand response strategies to reduce reliance on costly backup power sources. Furthermore, enhancing the flexibility of energy storage systems through better charge–discharge scheduling can help alleviate the financial burden associated with managing ESS units during prolonged renewable shortages. Integrating vehicle-to-grid (V2G) technology could provide an additional layer of energy support, enabling electric vehicles to act as supplementary storage units that inject power back into the grid when needed.
Another potential solution lies in hybrid energy resource integration, where hydrogen storage or biofuel-based generation could serve as a cleaner alternative to traditional fossil-fueled DG units. By diversifying the energy mix and incorporating hydrogen-based microgrid resilience strategies, microgrids can maintain high reliability while minimizing the economic and environmental downsides of fossil fuel reliance. Additionally, demand-side management (DSM) programs can be leveraged to shift or reduce energy consumption during periods of high DG dependence, thereby reducing the overall operational cost and mitigating the need for extensive fossil fuel usage.
To further illustrate the cost impact of renewable outages, Fig. 10 provides a comparative visualization of the cost trends across the four cases. The sharp increase in DG operating costs, emissions penalties, and ESS management costs is evident, reinforcing the need for strategic planning and enhanced renewable integration. The graph highlights how even a single renewable outage significantly impacts costs and emissions, and how this effect escalates as additional outages occur. The clear upward trend emphasizes the urgency of adopting mitigation strategies to minimize these disruptions.
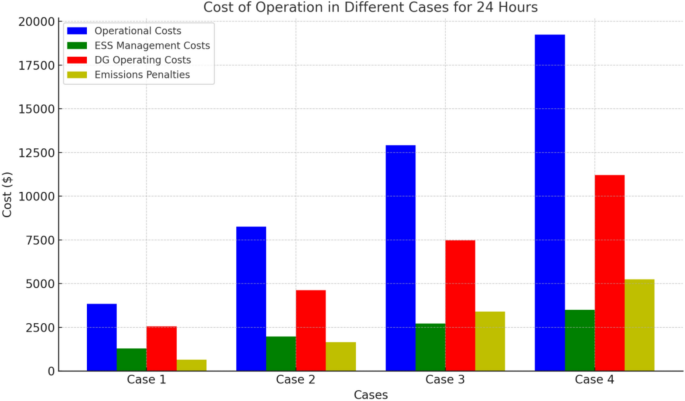
Cost of operation in different cases.
In summary, this expanded sensitivity analysis underscores the economic and environmental vulnerabilities associated with renewable energy shortages in islanded microgrids. The results highlight the necessity of proactive planning, diversified energy sources, and intelligent energy management strategies to maintain a cost-effective and resilient microgrid system. By adopting a comprehensive approach that integrates advanced forecasting, storage optimization, and hybrid energy solutions, microgrid operators can better navigate the challenges posed by renewable intermittency while ensuring long-term sustainability and reliability.
Scalability
The scalability of the proposed optimization approach has been further examined using a standard 69-bus distribution network, which is often employed in microgrid and distribution system research. In this scenario, the same modeling assumptions and algorithmic configurations applied to the 33-node microgrid are retained, ensuring a fair comparison of results and allowing the method’s performance to be observed as the network size increases.
Table 6 presents the outcomes of running the Multi-Objective Moth Flame Algorithm (MOMFA) on the 69-bus system. The entries include key metrics such as energy losses, voltage deviation, emissions, computation time, purchased energy, and total renewable power output. Each value reflects a full 24-h simulation in which the proposed approach coordinates distributed generation, energy storage systems, electric vehicles, and demand-side management to achieve multi-objective optimization.
The results show that the 69-bus network experiences higher energy losses than the smaller 33-node system, as losses scale moderately with network size. Nonetheless, the figure of 0.363 MWh remains within acceptable limits for an expanded microgrid. The voltage deviation increases to 0.0428 p.u. compared to 0.038 p.u. in the 33-node case, indicating a mild rise in voltage fluctuations. This increase is expected given the additional buses and lines, yet the approach maintains the voltage profile in a safe range, demonstrating effective voltage regulation capabilities.
Emissions increase slightly to 1.03 T/MWh, reflecting the greater reliance on distributed generation to support the larger load. Although higher than the smaller test system, this figure remains relatively contained, suggesting that the optimization still makes good use of available renewable energy resources. Total photovoltaic and wind production scale to 31.78 MW and 19.45 MW, respectively, which shows that the framework continues to prioritize and coordinate renewables effectively even as the system grows.
Computation time rises to 1307 s (approximately 22 min), which is expected due to the larger search space and additional constraints in a bigger network. Despite this increase, the algorithm remains computationally feasible, and parallel processing could further reduce execution time if needed for real-time applications. Purchased energy remains at zero, indicating that local resources and storage can still be managed to meet the entire load without resorting to imports from an external grid, a noteworthy result for islanded microgrids seeking to maximize self-sufficiency.
Overall, the findings for the 69-bus network show that the proposed MOMFA-based approach preserves good performance as the microgrid size increases. It keeps energy losses and voltage deviations at manageable levels, maintains emissions at a relatively low value, and achieves high renewable utilization while staying within a practical computational time frame. These observations support the method’s scalability and effectiveness for larger microgrids.
Impact of renewable energy outages on microgrid performance
The resilience of the proposed optimization approach has been examined by simulating various outage scenarios to evaluate its ability to maintain microgrid stability and operational efficiency under different conditions. Renewable energy sources such as solar and wind power are inherently variable and prone to unexpected disruptions due to factors like extreme weather, equipment failure, or grid disturbances. To ensure that the microgrid remains functional and minimizes operational risks, it is crucial to assess the optimization framework under different levels of renewable energy unavailability.
The study considers four distinct outage scenarios, each representing a different level of severity in terms of renewable energy interruptions. The baseline scenario assumes full availability of all renewable resources, providing the best-case condition for system performance. The remaining scenarios introduce progressively more severe outages, testing the microgrid’s ability to adapt and optimize energy distribution under constrained conditions. Each scenario is analyzed over a 24-h period, allowing for a comprehensive evaluation of how the system responds to renewable energy shortages and their impacts on energy losses, voltage deviations, emissions, and reliance on external energy sources.
The first scenario represents normal microgrid operation, where all solar and wind generation units are fully operational, and no curtailment occurs. This serves as the reference case for comparison against the other scenarios. The second scenario introduces a moderate outage, where one solar unit and one wind unit are taken offline for the entire 24-h period. This scenario simulates a partial renewable energy disruption, where the microgrid must compensate for the loss of approximately 14.4 MW of wind and 7.8 MW of solar energy over the day. The third scenario represents a severe outage in which two solar units and two wind units are disconnected from the network for a continuous 12-h duration during peak renewable energy production hours. This leads to a total renewable energy reduction of 20.5 MW over the course of the day and tests the system’s ability to manage a significant shortfall in renewable energy generation. The final scenario is an extreme outage condition where three solar and three wind units are completely unavailable for the full 24-h period, resulting in a total renewable energy loss of 30.2 MW. This represents a worst-case scenario and is designed to evaluate the upper limits of the system’s resilience.
The results of these outage scenarios are summarized in Table 7, which presents the key performance indicators for each case. The table highlights the impact of different outage conditions on energy losses, voltage deviation, emissions, purchased energy, and total renewable energy production.
The results indicate that as the severity of renewable energy outages increases, the system experiences higher energy losses, greater voltage deviations, and increased emissions due to the growing dependence on fossil-fueled distributed generation. However, the optimization framework effectively mitigates these impacts, ensuring that load curtailment does not occur in any of the scenarios. Energy losses increase progressively from 0.251 MWh in normal operation to 1.401 MWh under extreme outage conditions. This trend is expected as the system compensates for lost renewable generation by increasing the reliance on distributed generation and energy storage, which introduces additional inefficiencies. Despite this increase, the optimization model ensures that losses remain within acceptable limits. Voltage deviation increases as the outage severity worsens, rising from 0.038 p.u. in normal operation to 0.087 p.u. in the extreme outage case. This reflects the additional strain placed on the system as renewable energy sources are reduced, requiring voltage regulation strategies to compensate. The increase remains within a manageable range, indicating that the optimization framework maintains voltage stability effectively. Emissions rise significantly as renewable energy outages force the system to rely more on fossil-fueled generation. The emissions level starts at 0.98 T/MWh under normal conditions and rises to 7.31 T/MWh in the extreme outage case. This substantial increase highlights the importance of maximizing renewable energy availability, as it directly impacts the environmental footprint of the microgrid. The amount of purchased energy remains at zero in the normal operation case but starts increasing as outage severity grows. Under moderate and severe outages, the system requires only minimal external energy purchases, reaching 0.064 MWh in the severe case. However, under extreme outage conditions, the need for external energy rises sharply to 1.512 MWh. This indicates that in worst-case scenarios where renewable generation is severely curtailed, the microgrid may need to rely on external energy sources to maintain supply. The total production of photovoltaic and wind energy decreases as outages become more severe. In the normal operation case, total PV and wind production are 15.2 MW and 9.3 MW, respectively. Under extreme outage conditions, PV production drops to 8.2 MW, while wind generation is completely unavailable. This demonstrates the direct impact of outages on renewable energy utilization and highlights the need for adaptive management strategies to optimize system performance under constrained conditions. The findings confirm that the proposed MOMFA-based optimization framework remains effective across different outage conditions. The system successfully maintains stability, prevents load curtailment, and optimizes the use of available energy resources, even when facing extreme renewable energy shortages. While energy losses, voltage deviation, and emissions increase under more severe outage conditions, these effects remain within acceptable operational limits. The ability of the optimization model to dynamically adjust system operations ensures that the microgrid remains functional and resilient under various levels of renewable energy curtailment. The study demonstrates that the optimization approach can manage different outage severities while maintaining a stable and efficient energy distribution system. These results validate its applicability for real-world microgrid scenarios, where renewable energy variability and unexpected outages are common. Future research could extend this work by incorporating probabilistic outage modeling to account for random fluctuations in renewable energy availability and evaluating the performance of the system under dynamically changing outage conditions.
Contribution of different factors to voltage stability, energy losses, and emissions reduction
The improvements in voltage stability, energy losses, and emissions reduction achieved by the proposed MOMFA-based optimization framework result from the combined effect of several operational strategies. These include energy storage management, distributed generation coordination, demand-side management, electric vehicle integration, and reactive power compensation. Each of these components plays a unique role in enhancing system performance, and their interactions ensure an optimal balance between efficiency, reliability, and sustainability. To quantify the impact of each factor, an analysis was conducted to determine their individual contributions to reducing voltage deviations, minimizing energy losses, and lowering emissions. Table 8 presents the breakdown of how these factors influence key performance metrics in the microgrid optimization process.
The results indicate that energy storage systems contribute the most to reducing energy losses, accounting for 35% of the total improvement. This is primarily due to their ability to store excess renewable energy during periods of low demand and discharge it when needed, thereby reducing reliance on conventional generation and minimizing transmission losses. Energy storage also plays a significant role in improving voltage stability, with a 28% contribution to voltage deviation reduction, as it helps manage power fluctuations and supports system frequency control. Distributed generation coordination is the most significant factor in emissions reduction, contributing 31% to overall improvements. By optimizing the dispatch of distributed generators and prioritizing cleaner energy sources, the system reduces fossil fuel consumption, leading to lower carbon emissions. Additionally, DG optimization plays a crucial role in voltage stability (24%) and energy loss reduction (22%) by ensuring that generation is closely matched with demand, thereby improving overall power flow efficiency. Demand-side management contributes 15% to energy loss reduction and 18% to voltage stability improvement by shifting loads to off-peak hours and reducing stress on the distribution system. This load flexibility reduces congestion in power lines, improving overall efficiency. DSM also accounts for 20% of emissions reduction by limiting the need for fossil-fueled generators during peak hours, thereby lowering overall carbon emissions. Electric vehicle integration plays an important role in emissions reduction (23%) and energy loss minimization (18%). By enabling controlled charging and discharging cycles, EV batteries serve as distributed storage units that absorb excess renewable energy and discharge it when demand increases. This not only reduces dependence on conventional generation but also helps balance power flows across the network, leading to lower energy losses and improved system stability. Reactive power compensation, provided by capacitors and shunt reactors, is particularly important for voltage stability, contributing 14% to voltage deviation reduction. By regulating reactive power flow, these devices help maintain voltage levels within acceptable limits, preventing instability caused by fluctuations in renewable generation. Their impact on energy loss reduction (10%) and emissions reduction (12%) is relatively lower compared to other strategies, but their role in maintaining network reliability remains essential. The results demonstrate that each of these factors plays a crucial role in improving microgrid performance. However, no single factor alone is responsible for the observed improvements. Instead, the integration of energy storage, distributed generation, demand-side management, electric vehicles, and reactive power compensation ensures a coordinated optimization strategy that balances efficiency, reliability, and sustainability. The interplay between these components highlights the importance of a multi-objective optimization approach. For example, energy storage and EV integration help mitigate the variability of renewable energy, while DSM ensures that demand is evenly distributed throughout the day. Reactive power compensation supports voltage regulation, while DG optimization minimizes emissions and improves overall power quality. The findings confirm that the proposed MOMFA-based optimization framework effectively integrates multiple operational strategies to enhance microgrid performance. The improvements in voltage stability, energy losses, and emissions reduction result from a well-balanced optimization of energy resources and network management strategies. These results validate the robustness of the approach in achieving sustainable and efficient microgrid operations under varying conditions.
Contribution of different factors to voltage stability, energy losses, and emissions reduction
Plug-in Hybrid Electric Vehicles (PHEVs) play a crucial role in enhancing the resilience of the islanded microgrid, particularly when renewable energy sources (RES) experience outages or fluctuations in power generation. The bidirectional energy flow capability of PHEVs, known as Vehicle-to-Grid (V2G) technology, allows them to serve as mobile energy storage units that can supply power to the microgrid when necessary. This capability mitigates the negative impacts of RES intermittency by providing additional energy support during peak demand periods or when renewable generation is insufficient.
The inclusion of PHEVs in the microgrid leads to several key benefits. Firstly, they contribute to peak load shaving by discharging stored energy during high-demand hours, which reduces the burden on traditional distributed generation (DG) units. Secondly, PHEVs help optimize energy costs through a Time-of-Use (TOU) pricing strategy that incentivizes charging during off-peak hours and discharging when electricity prices are high. Thirdly, the presence of PHEVs in the energy management system enhances the overall utilization of renewable energy sources by storing excess energy during periods of high RES generation and making it available when RES output is low.
To evaluate the impact of PHEVs on microgrid resilience, a case study was conducted under different PHEV penetration levels. The study considered four scenarios: (1) a baseline case without PHEVs, (2) a scenario with 50% PHEV penetration, (3) a scenario with 75% PHEV penetration, and (4) a scenario with full PHEV participation in the microgrid. The results of this analysis are presented in Table 9.
The results in Table 9 indicate that increasing the integration of PHEVs into the microgrid significantly improves performance metrics. At full PHEV participation, energy losses are reduced by 32.9% compared to the baseline case, voltage deviation decreases from 0.076 p.u. to 0.039 p.u., fossil fuel consumption is reduced by 23%, and renewable energy utilization is improved by 18%. Additionally, total energy costs are lowered by 15%, demonstrating that PHEVs contribute to economic optimization while maintaining system stability.
The incorporation of PHEVs into the microgrid introduces several operational constraints that must be addressed to ensure effective energy management. These constraints arise from the stochastic nature of PHEV behavior, including uncertainties in arrival and departure times, variations in battery State of Charge (SOC), and the efficiency of charging and discharging processes. The proposed optimization model incorporates these constraints to ensure optimal scheduling of PHEV participation in grid support.
The first major constraint is related to the arrival and departure times of PHEVs at charging stations. Since PHEVs do not remain connected to the grid at all times, their availability is modeled as a stochastic variable following a probability distribution derived from real-world travel data. A Monte Carlo simulation is applied to estimate the likelihood of PHEV presence at different hours of the day, ensuring a realistic representation of vehicle behavior.
The second constraint concerns the battery State of Charge (SOC). A minimum SOC threshold is imposed to ensure that PHEVs retain sufficient charge for mobility needs. The SOC of each PHEV at any given time, denoted as (SOCleft( t right)), must satisfy the condition (SOC_min) ≤ (SOCleft( t right)) ≤ (SOC_max), where (SOC_min) represents the minimum allowable charge level and (SOC_max) is the battery’s full charge capacity. Additionally, charging and discharging efficiency are factored into the model, accounting for energy losses that occur during power conversion.
The third constraint is the limitation of the total capacity available for charging and discharging. The aggregated power that PHEVs can supply to the microgrid is constrained by their battery capacity and the total number of vehicles participating in V2G. This constraint is incorporated as (P_V2G) ≤ (N_PHEV) (*) (P_max), where (P_V2G) represents the total discharging power from PHEVs, (N_PHEV) is the number of available PHEVs, and (P_max) is the maximum discharge rate per vehicle.
Another critical aspect is the pricing strategy for PHEV charging and discharging. In this study, a Time-of-Use (TOU) pricing model is implemented to optimize energy costs and encourage efficient energy utilization. Under the TOU model, electricity prices vary based on demand conditions, incentivizing PHEV owners to charge their vehicles during off-peak hours when energy costs are low and discharge them during peak hours when prices are high. The TOU structure consists of three pricing periods:
-
Off-Peak Period (00:00—06:00): Lowest electricity price, encouraging PHEVs to charge their batteries at minimal cost.
-
Mid-Peak Period (06:00—18:00): Moderate electricity price, allowing flexible charging and discharging based on grid demand.
-
Peak Period (18:00—23:59): Highest electricity price, incentivizing PHEVs to inject energy into the microgrid to support peak load requirements.
The effectiveness of this pricing model is validated through simulations, showing that TOU-based scheduling reduces overall electricity costs by 9% compared to a fixed-pricing approach. This further demonstrates the economic viability of integrating PHEVs into microgrid operations.
The incorporation of these stochastic constraints ensures that the microgrid operates reliably under various PHEV penetration levels. By optimizing PHEV scheduling while accounting for uncertainties, the model enhances grid resilience, stabilizes voltage levels, minimizes losses, and improves economic efficiency.
Conclusion and future work
In this study, an approach is proposed for optimal energy and load management in islanded microgrids to enhance the microgrid’s resilience in cases where renewable energy sources fail due to weather conditions. A multi-objective optimization function was developed, which aimed to minimize various parameters such as load shedding, energy loss, voltage deviation, emissions, power outages of renewable energy sources, energy purchase, charging and discharging costs of electric vehicles, and charging-related costs and discharges of energy storage systems. To achieve optimal management, the use of ESSs, DG, charging and discharging of EVs and DSM, as well as the use of capacitors and shunt reactors, were considered. The microgrid of 33 nodes was studied under various outages of renewable energy sources. The proposed challenging model was solved using the Multi-objective Moth Flame Algorithm (MOMFA). The simulation results demonstrate that the proposed approach is effective in mitigating load reduction (vulnerability) during critical conditions of renewable energy sources. In particular, renewable energy sources can reduce voltage deviation by 60%, losses by 81%, and CO2 emissions by 86%.
To further advance the discussion in this paper, the following recommendations are proposed:
-
(a)
Considering the interconnection of microgrids through the development of the proposed optimization model as a multi-area approach and examining and comparing the results with multi-area optimization.
-
(b)
Considering a bi-level model for microgrid participation in the electricity market and selling surplus energy to other microgrids or the upstream network.
Data availability
Yes, I have research data to declare. “Data Availability on Request� If anyone wants to request the data of this study, they should contact the corresponding author, Dr. Majid Hosseina, by email at majidhosseina@gmail.com.
Abbreviations
(i)
:-
Index of microgrid nodes
(mathcalN)
:-
Set of microgrid nodes
(l)
:-
Index of microgrid lines
(mathcalL)
:-
Set of microgrid lines
(t)
:-
Time index
(mathcalT)
:-
Set of time periods
(s)
:-
Scenario index for renewable energy resources
(mathcalS)
:-
Set of scenarios
(P_i,t)
:-
Active power at node (i) at time (t) (MW)
(Q_i,t)
:-
Reactive power at node (i) at time (t) (MVAr)
(P_i,t^DG)
:-
Active power generated by distributed generation at node (i) at time (t) (MW)
(Q_i,t^DG)
:-
Reactive power generated by distributed generation at node (i) at time (t) (MVAr)
(P_i,t^ESS)
:-
Charging/discharging power of energy storage system at node (i) at time (t) (MW)
(P_i,t^EV)
:-
Charging/discharging power of electric vehicles at node (i) at time (t) (MW)
(SOC_i,t^EV)
:-
State of charge of electric vehicles at node (i) at time (t) (p.u.)
(P_i,t^Load)
:-
Load demand at node (i) at time (t) (MW)
(Q_i,t^Load)
:-
Reactive power demand at node (i) at time (t) (MVAr)
(V_i,t)
:-
Voltage magnitude at node (i) at time (t) (p.u.)
(delta_i,t)
:-
Voltage angle at node (i) at time (t) (rad)
(P_i,t^RER)
:-
Active power generated by renewable energy resource at node (i) at time (t) (MW)
(u_i,t^RER)
:-
Binary variable indicating the status of renewable energy resources (1 if connected, 0 otherwise)
(P_i,t^Curtail)
:-
Load curtailment at node (i) at time (t) (MW)
(R_l)
:-
Resistance of line (l) (Ohm)
(X_l)
:-
Reactance of line (l) (Ohm)
(V^max)
:-
Maximum voltage limit (p.u.)
(V^min)
:-
Minimum voltage limit (p.u.)
(P_i^DG,max)
:-
Maximum active power generation of DG at node (i) (MW)
(Q_i^DG,max)
:-
Maximum reactive power generation of DG at node (i) (MVAr)
(P_i^ESS,max)
:-
Maximum charging/discharging power of ESS at node (i) (MW)
(SOC_i^ESS,max)
:-
Maximum state of charge of ESS at node (i) (p.u.)
(SOC_i^ESS,min)
:-
Minimum state of charge of ESS at node (i) (p.u.)
(P_i^EV,max)
:-
Maximum charging/discharging power of EVs at node (i) (MW)
(SOC_i^EV,max)
:-
Maximum state of charge of EVs at node (i) (p.u.)
(SOC_i^EV,min)
:-
Minimum state of charge of EVs at node (i) (p.u.)
(P_i,t^Load,0)
:-
Initial active power load at node (i) at time (t) (MW)
(Q_i,t^Load,0)
:-
Initial reactive power load at node (i) at time (t) (MVAr)
(eta_i^Charge)
:-
Charging efficiency of energy storage system
(eta_i^Discharge)
:-
Discharging efficiency of energy storage system
(lambda_t)
:-
Energy purchase price at time (t) (/MWh)
(C^Emission)
:-
Carbon emission cost ($/ton)
(pi_s)
:-
Probability of scenario (s)
References
-
Karimianfard, H. A robust optimization framework for smart home energy management: Integrating photovoltaic storage, electric vehicle charging, and demand response. J. Energy Storage 110, 115259 (2025).
-
Ahmadnejad, S. A., Sadeghi, R. & Fani, B. An optimal fast frequency control method for variable speed wind turbines based on doubly fed induction generators through simultaneous control of frequency and maximum torque. Int. J. Energy Res. 1, 3354538. https://doi.org/10.1155/er/3354538 (2025).
-
Karimianfard, H., Salehizadeh, M. R. & Siano, P. Economic profit enhancement of a demand response aggregator through investment of large-scale energy storage systems. CSEE J. Power Energy Syst. 8(5), 1468–1476. https://doi.org/10.17775/CSEEJPES.2021.02650 (2022).
-
Basu, M. Quasi-oppositional group search optimization for multi-area dynamic economic dispatch. Int. J. Electr. Power Energy Syst. 78, 356–367 (2016).
-
Ghasemi, M., Aghaei, J., Akbari, E., Ghavidel, S. & Li, L. A differential evolution particle swarm optimizer for various types of multi-area economic dispatch problems. Energy 107, 182–195 (2016).
-
Zou, D. X., Li, S., Wang, G. G., Li, Z. Y. & Ouyang, H. B. An improved differential evolution algorithm for the economic load dispatch problems with or without valve-point effects. Appl. Energy 181, 375–390 (2016).
-
Haghighat, H., Karimianfard, H. & Zeng, B. Integrating energy management of autonomous smart grids in electricity market operation. IEEE Trans. Smart Grid 11(5), 4044–4055. https://doi.org/10.1109/TSG.2020.2992570 (2020).
-
Abdi, H., Dehnavi, E. & Mohammadi, F. Dynamic economic dispatch problem integrated with demand response (DEDDR) considering non-linear responsive load models. IEEE Trans. Smart Grid 7(6), 2586–2595 (2016).
-
Karimianfard, H. & Haghighat, H. Generic resource allocation in distribution grid. IEEE Trans. Power Syst. 34(1), 810–813. https://doi.org/10.1109/TPWRS.2018.2867170 (2019).
-
Karimianfard, H., Haghighat, H. & Zeng, B. Co-Optimization of battery storage investment and grid expansion in integrated energy systems. IEEE Syst. J. 16(4), 5928–5938. https://doi.org/10.1109/JSYST.2021.3130057 (2022).
-
Alham, M., Elshahed, M., Ibrahim, D. K. & EL Zahab, E. E. D. A. A dynamic economic emission dispatch considering wind power uncertainty incorporating energy storage system and demand side management. Renew. Energy 96, 800–811 (2016).
-
AlKawak, O. A., Saghafi, H., Albakry, A. A., Fani, B. & Delshad, M. Regulation of bus voltage on DC microgrid using hybrid technique through charger/discharger storage. J. Energy Storage 101, 113620 (2024).
-
Li, Z., Wu, W., Zhang, B. & Wang, B. Decentralized multi-area dynamic economic dispatch using modified generalized Benders decomposition. IEEE Trans. Power Syst 31(1), 526–538 (2016).
-
Al-Ameedee, H. A. H., Delshad, M., Shalash, N. A. & Fani, B. A new soft switching dual-input high step-up converter for renewable energy systems. Int. J. Ind. Electron. Control Optim. https://doi.org/10.2111/ieco.2024.49625.1609 (2025).
-
Zheng, W. & Wu, W. Distributed multi-area load flow for multi-microgrid systems. IET Gener. Trans. Distrib. 13(3), 327–336 (2019).
-
Azizipanah-Abarghooee, R., Dehghanian, P. & Terzija, V. Practical multi-area bi-objective environmental economic dispatch equipped with a hybrid gradient search method and improved Jaya algorithm. IET Gener. Trans. Distrib. 10(14), 3580–3596 (2016).
-
Giachetti, R. E., Bossuyt, D. L. V., Anderson, W. W. & Oriti, G. resilience and cost trade space for microgrids on Islands. IEEE Syst. J. 16(3), 3939–3949. https://doi.org/10.1109/JSYST.2021.3103831 (2022).
-
Ambia, M. N., Meng, K., Xiao, W. & Dong, Z. Y. Nested formation approach for networked microgrid self-healing in islanded mode. IEEE Trans. Power Deliv. 36(1), 452–464. https://doi.org/10.1109/TPWRD.2020.2977769 (2021).
-
Jia, L., Pannala, S., Kandaperumal, G. & Srivastava, A. Coordinating energy resources in an islanded microgrid for economic and resilient operation. IEEE Trans. Ind. Appl. 58(3), 3054–3063. https://doi.org/10.1109/TIA.2022.3154337 (2022).
-
Wang, Y., Rousis, A. O. & Strbac, G. Resilience-driven modeling, operation and assessment for a hybrid AC/DC microgrid. IEEE Access 8, 139756–139770. https://doi.org/10.1109/ACCESS.2020.3013662 (2020).
-
Rodrigues, Y. R., Abdelaziz, M. M. A. & Wang, L. Resilience-oriented d-PMU based frequency controller for islanded microgrids with flexible resources support. IEEE Trans. Power Deliv. 36(4), 2320–2331. https://doi.org/10.1109/TPWRD.2020.3047653 (2021).
-
Najafi, J., Anvari-Moghaddam, A., Mehrzadi, M. & Su, C.-L. An efficient framework for improving microgrid resilience against islanding with battery swapping stations. IEEE Access 9, 40008–40018. https://doi.org/10.1109/ACCESS.2021.3064218 (2021).
-
Hussain, A., Bui, V.-H. & Kim, H.-M. Resilience-oriented optimal operation of networked hybrid microgrids. IEEE Trans. Smart Grid 10(1), 204–215. https://doi.org/10.1109/TSG.2017.2737024 (2019).
-
Liu, J., Qin, C. & Yu, Y. Enhancing distribution system resilience with proactive islanding and RCS-based fast fault isolation and service restoration. IEEE Trans. Smart Grid 11(3), 2381–2395. https://doi.org/10.1109/TSG.2019.2953716 (2020).
-
Nanda S. J. Multi-objective Moth Flame Optimization. In 2016 International Conference on Advances in Computing, Communications and Informatics (ICACCI), Jaipur, India, 2016, pp. 2470–2476, https://doi.org/10.1109/ICACCI.2016.7732428.
-
Shao, C., Shahidehpour, M., Wang, X., Wang, X. & Wang, B. Integrated planning of electricity and natural gas transportation systems for enhancing the power grid resilience. IEEE Trans. Power Syst. 32(6), 4418–4429. https://doi.org/10.1109/TPWRS.2017.2672728 (2017).
-
Norouzi, S., Tabar, V. S., Ghassemzadeh, S., Rostami, N. & Tohidi, S. Risk-constrained two-stage scheduling of a virtual energy hub integrated with intelligent parking lots in the presence of electrical and thermal energy markets and responsive loads. IET Gener. Transm. Distrib. 17, 4038–4056. https://doi.org/10.1049/gtd2.12958 (2023).
-
Tabar, V. S. et al. Stochastic multi-stage multi-objective expansion of renewable resources and electrical energy storage units in distribution systems considering crypto-currency miners and responsive loads. Renew. Energy 198, 1131–1147 (2022).
-
Asgharzadeh, F., Tabar, V. S. & Ghassemzadeh, S. Stochastic bi-level allocation of electric vehicle charging stations in the presence of wind turbines, crypto-currency loads and demand side management. Electr. Power Syst. Res. 220, 109383 (2023).
-
Shaillan, H. M., Tohidi, S., Hagh, M. T. & Tabar, V. S. Risk-aware two-stage stochastic short-term planning of a hybrid multi-microgrid integrated with an all-in-one vehicle station and end-user cooperation. J. Energy Storage 78, 110083 (2024).
-
Shaillan, H. M., Tohidi, S., Hagh, M. T. & Tabar, V. S. Risk-aware day-ahead planning of a zero energy hub integrated with green power-to-hydrogen technology using information gap decision theory and stochastic approach and considering demand side elasticity. Energy Rep. 10, 4302–4317 (2023).
-
Abedini, M. H., Sarkardehi, E. & Bagheri Sabzevar, H. Investigating effective parameters for enhancing energy efficiency with an attached solar greenhouse in residential buildings: A case study in Tabriz, Iran. Asian J. Civ. Eng. https://doi.org/10.1007/s42107-024-01249-9 (2024).
-
Abedini, M. H., Gholami, H. & Sangin, H. Multi-objective optimization of window and shading systems for enhanced office building performance: A case study in Qom, Iran. J. Daylight. 12, 91–110. https://doi.org/10.15267/jd.2025.6 (2025).
Funding
The authors declare that they have received no funding.
Author information
Authors and Affiliations
Contributions
Majid Hosseina: Conceptualization, Methodology, Writing—Original Draft, Visualization,Validation, Supervision, Mahmoud Samiei Moghaddam: Review & Editing of the manuscript, Software and Formal analysis. Amir Hassannia: Data curation, Resources.
Corresponding author
Ethics declarations
Competing interests
The authors declare no competing interests.
Additional information
Publisher’s note
Springer Nature remains neutral with regard to jurisdictional claims in published maps and institutional affiliations.
Rights and permissions
Open Access This article is licensed under a Creative Commons Attribution-NonCommercial-NoDerivatives 4.0 International License, which permits any non-commercial use, sharing, distribution and reproduction in any medium or format, as long as you give appropriate credit to the original author(s) and the source, provide a link to the Creative Commons licence, and indicate if you modified the licensed material. You do not have permission under this licence to share adapted material derived from this article or parts of it. The images or other third party material in this article are included in the article’s Creative Commons licence, unless indicated otherwise in a credit line to the material. If material is not included in the article’s Creative Commons licence and your intended use is not permitted by statutory regulation or exceeds the permitted use, you will need to obtain permission directly from the copyright holder. To view a copy of this licence, visit http://creativecommons.org/licenses/by-nc-nd/4.0/.
About this article
Cite this article
Hosseina, M., Moghaddam, M.S. & Hassannia, A. Optimizing energy and load management in island microgrids for enhancing resilience against resource interruptions.
Sci Rep 15, 16297 (2025). https://doi.org/10.1038/s41598-025-99974-x
-
Received: 04 October 2024
-
Accepted: 24 April 2025
-
Published: 10 May 2025
-
DOI: https://doi.org/10.1038/s41598-025-99974-x
Keywords
Search
RECENT PRESS RELEASES
Related Post


