Quantifying cascading power outages during climate extremes considering renewable energy integration
March 15, 2025
Abstract
Climate extremes, such as hurricanes, combined with large-scale integration of environment-sensitive renewables, could exacerbate the risk of widespread power outages. We introduce a coupled climate-energy model for cascading power outages, which comprehensively captures the impacts of climate extremes on renewable generation, and transmission and distribution networks. The model is validated with the 2022 Puerto Rico catastrophic blackout during Hurricane Fiona – a unique system-wide blackout event with complete records of weather-induced outages. The model reveals a resilience pattern that was not captured by the previous models: early failure of certain critical components enhances overall system resilience. Sensitivity analysis on various scenarios of behind-the-meter solar integration demonstrates that lower integration levels (below 45%, including the current level) exhibit minimal impact on system resilience in this event. However, surpassing this critical level without pairing it with energy storage can exacerbate the probability of catastrophic blackouts.
Introduction
Climate extremes, especially tropical cyclones—commonly known as hurricanes or typhoons—have threatened energy infrastructure over decades, leading to numerous widespread catastrophic blackouts globally1,2. Despite the growing emphasis on enhancing the resilience of power systems, which are fundamental to socio-economic functioning, weather-associated power outages in the United States have escalated by 78% during this decade compared to the last decade3. Hurricane Maria (Category 5) in 2017 and Hurricane Fiona (Category 1) in 2022 caused island-wide power outages in Puerto Rico, affecting the electricity supply for its 1.5 million customers4,5 and resulting in a combined loss of about US $113.3 billion6,7.
Meanwhile, in the context of long-term decarbonization roadmaps, various ambitious renewable energy integration targets have been set for power grids8,9. For instance, Puerto Rico has committed to achieving a 100% renewable power grid by 205010. The large-scale integration of variable renewable energy such as solar photovoltaic (PV) and wind energy increases the uncertainty in power system operations and decreases the grid inertia11. Especially, the integration of behind-the-meter (BTM) solar PV systems combined with unregulated individual-optimized storage, can further challenge grid operations due to unexpected demand fluctuations12. Moreover, these environment-dependent renewable sources are particularly sensitive and vulnerable to extreme weather events. Solar panels have been observed to exhibit greater fragility during storms than their design requirements13. Additionally, hurricanes associated with large cumulonimbi substantially reduce solar power generation even prior to their landfalls14, which can further enlarge imbalances between electricity supply and demand. These challenges highlight the potential amplified risk of catastrophic blackouts due to climate-energy interactions and underscore the importance of developing a coupled climate-energy model to quantify the effects of climate extremes on the resilience of renewable power systems1,15.
Catastrophic blackouts triggered by initial common-cause disturbances have been extensively investigated. For instance, physics-based analyses reveal that small initial common-cause failures of critical lines can propagate through the transmission network, triggering catastrophic network collapse16,17,18,19. A network cascade model demonstrates more severe failures when incorporating dynamics of power systems in contrast to the findings from static power flow analysis20. Significant progress in understanding energy resilience has also been widely achieved through efforts to bridge climate extremes and energy systems. Long-term coupled climate-energy planning for Sweden21, various EU cities22, and Puerto Rico23 reveals the potential for catastrophic socio-economic consequences arising from extreme weather conditions. Towards the operational resilience of bulk power grid under specific events, the effectiveness of critical line hardening for preventing network cascades has been validated with synthetic Texas transmission grid under hurricanes24. The hydrological-power cascade effect has been demonstrated in the California transmission grid during extreme events characterized by high-temperature stress25.
Despite the substantial advances made in understanding the common-cause network cascade mechanism16,17,18,19,20 and the operational resilience24,25 of transmission grids under extreme events, two critical obstacles remain in quantifying spatiotemporal power outages during extreme weather events such as hurricanes: (i) the absence of high-resolution spatiotemporal power outage models covering the comprehensive effect of evolving climate weather hazards on transmission and distribution networks and renewable generation; and (ii) a limited understanding of the effects of environment-dependent renewable penetration on cascading power outages. In real-world blackout events induced by climate extremes, it is not only the failures of transmission networks but also those of more vulnerable and extensive distribution networks26, as well as affected environment-sensitive renewable generation capacity14, that collectively contribute to these outages. However, due to the limited availability of comprehensive energy system data and high-resolution outage information of real-world events, existing research efforts on catastrophic blackouts have predominantly focused on cascading failures within the topology of transmission networks16,17,18,19,20,24.
To address these challenges, we develop a coupled climate-energy model to capture and quantify the cascading power outages in renewable power systems under climate extremes. This model accounts for the comprehensive effects of evolving extreme weather conditions on renewable generation, and transmission and distribution networks. Our model is validated by a retrospective analysis of the 2022 Puerto Rico catastrophic blackout during Hurricane Fiona, a milestone event documented with high-resolution spatiotemporal outage data of a weather-induced system-wide blackout. Using thousands of realizations that account for the uncertainty in grid infrastructure resistance, we investigate the resilience and vulnerability patterns of the grid under an evolving hazard. To further explore the role of distributed solar-dominated renewable integration in this catastrophic event, we then conduct a sensitivity analysis across a wide range of renewable integration levels. Beyond this specific event, our methodology offers a broadly useful tool for assessing the risks associated with different generation portfolios of a regional power system in response to projected climate extremes.
Results
Modeling climate-induced power outages with renewable integration
We propose a Climate-induced Renewable Energy System Cascading Event (CRESCENT) model. This model bridges the dynamics of renewable energy systems with evolving extreme weather events by integrating a spatiotemporal hazard model, a renewable energy system vulnerability model, and a multi-scale spatiotemporal cascading power outage model (see Fig. 1 and Methods). The meteorological component exemplifies tropical cyclones as a typical climate extreme to the Puerto Rico energy system and employs a physics-based tropical cyclone wind field model to generate high-resolution spatiotemporal wind hazards. The renewable energy system vulnerability model is used to simulate the effects of climate extremes on spatiotemporal infrastructure damage and renewable generation reduction. We assess the spatiotemporal infrastructure damage to both transmission and distribution networks through hazard resistance risk analysis (see Methods). The damage to distribution feeders within distribution networks results in the spatiotemporal loss of demand at the transmission network level, affecting grid operations. We consider the shutdown of wind turbines under extreme wind conditions and evaluate the climatic sensitivity of solar PV generation. This evaluation includes the analysis of generation decline in both utility-scale and distributed rooftop solar PV systems, attributed to wind-induced panel damage and reduced solar irradiance due to extensive cumulonimbus clouds.
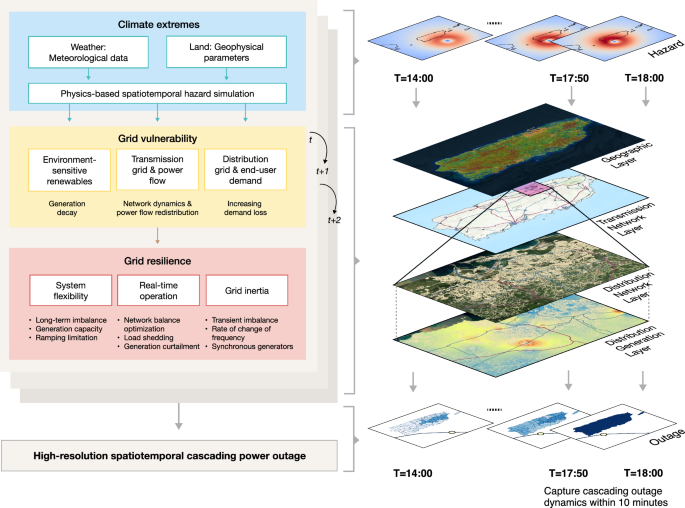
The proposed CRESCENT model enables the high-resolution spatiotemporal analysis of the climate extreme effect on comprehensive energy systems and captures the cascading outage dynamics. The visualized data of the geographic, transmission network, distribution network, and distribution generation layers are overlaid on basedmaps from Esri57,58.
Informed by the vulnerability of renewable energy systems during evolving climate extremes, we propose a multi-scale spatiotemporal cascade model to quantify cascading power outages, featuring a temporal resolution compatible with the real-time operations of the decision-making system. Expanding the existing network cascade model that considers the overloaded line tripping and power flow redistribution induced by common-cause initial failures16,17,18,19,20, the proposed method further accounts for the impact of evolving hazards on system resilience. Under extreme weather conditions, system resilience/reliability is fundamentally determined by two key factors influencing power balance across different time scales: grid inertia for alleviating transient power imbalances and system flexibility for eliminating sustained power imbalances1. Our cascade model considers power imbalances associated with renewable energy integration by taking these two factors into account. In the context of large-scale renewable integration, reduced grid inertia against transient power imbalances is considered in the network stability analysis. System flexibility, considering reduced renewable generation and availability of flexible resources during climate extremes is embedded in real-time operation optimization (see Methods).
Catastrophic blackout of Puerto Rico in 2022
On September 18th, 2022, Hurricane Fiona caused a complete power outage across the island of Puerto Rico again after a similar situation caused by Hurricane Maria in 2017. During this system-wide blackout event, LUMA Energy, the local system operator that took over the grid in 2021, captured high-resolution spatiotemporal outage data27 in 10-minute intervals (i.e., at the real-time system dispatch scale). Such detailed data for a system-wide blackout caused by extreme weather events is rarely documented. Compared to regional-level power outage events, system-wide blackouts provide unique opportunities for exploring the weather-induced cascading failures and stability mechanisms of complex dynamic systems. This time-series outage data reveals a catastrophic cascading failure in the Puerto Rico power grid, with system outages escalating from below 50 to 100% within 10 minutes at 18:00 UTC, prior to the landfall of a mere Category 1 hurricane (Fig. 2a, b). Consistently, the US official report5 indicates that escalating damages to distribution and transmission infrastructure led to a system-wide imbalance between electricity supply and demand. This imbalance triggered the off-grid protection of generation units, resulting in system instability.
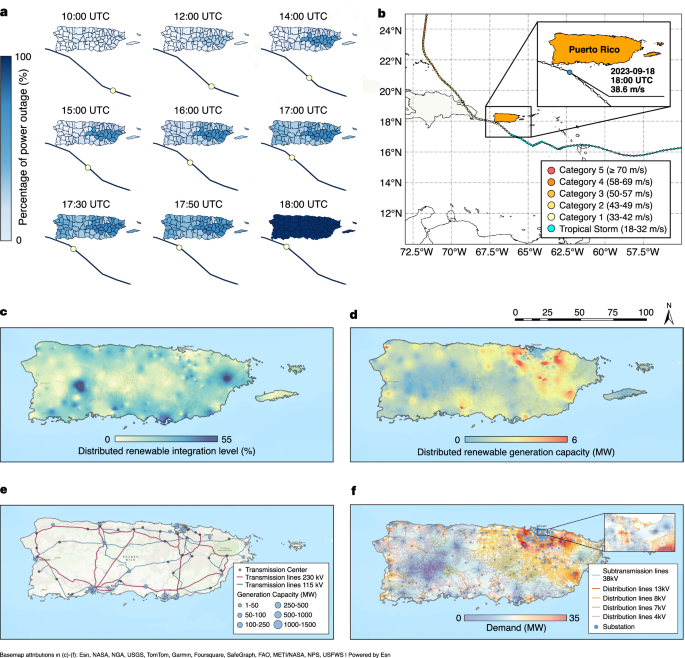
a Spatiotemporal power outage map of the Puerto Rico power grid from 10:00 UTC to 18:00 UTC on September 18, 2022, along with the track (black line) and center location (yellow dot) of Hurricane Fiona. b The track of Hurricane Fiona, highlighted by its maximum sustained wind speeds. Hurricane Fiona was a Category 1 hurricane during its landfall in Puerto Rico. c, d Maps of c the integration level and d the capacity of distributed renewable generation (rooftop solar systems; with data recorded at the distribution feeder level). e Transmission network with generation capacity. f Distribution network with the spatial distribution of demand. The power grid exhibits a supply-demand structure with major generation in the south and the primary load centers in the north (San Juan). The structure heightens the risk of power imbalance during disruptions of the transmission network. Despite certain distribution feeders reaching a renewable integration level of 55%, the overall integration level with a total installed distributed renewable generation capacity of 296 MW remains below 20% of the peak demand (2751 MW), approximately at 16%. The visualized data of (c–f) are overlaid on basedmaps from Esri57.
We used the CRESCENT model to perform spatiotemporal simulations of the Puerto Rico power grid during Hurricane Fiona, matching the 10-minute temporal resolution of the power outage data and real-time operation timescale. The energy-related models are configured based on the Puerto Rico power grid in 2022 with its utility-scale generation, distributed renewable generation, and transmission and distribution networks (Fig. 2c–f), corresponding to the conditions during Hurricane Fiona. Considering the uncertainty in infrastructure hazard resistance, we generated 1000 time-series power outage realizations, spanning from 0:00 to 23:00 UTC on September 18, 2022, to capture the full impact of the hurricane hazard on the power system. The spatiotemporal failures of each infrastructure type are assessed based on the corresponding fragility functions described in the Methods section. While the cascading failure is due to the comprehensive effect of hurricanes on generation capacity (including distributed renewable generation) and both transmission and distribution networks, the early stage of outages (before 14:00 UTC) is primarily driven by losses in the distribution networks, which have comparatively lower hazard resistance than transmission network infrastructure (see Fig. S17). In addition, initial minor transmission network failures are less likely to cause severe cascading failures due to the redundancy of transmission network connectivity and protective mechanisms inherent in its design.
As the hurricane approaches with increased hazard intensity, distribution networks experience more severe damage, and solar-based renewable generation undergoes higher reductions. Although the direct physical damage to solar panels is relatively low (below 1% on average) during this Category 1 hurricane (see Fig. S18), the indirect effect of the hurricane’s cumulonimbus can still reduce solar generation. For instance, by 16:00 UTC (12:00 local time), distributed solar generation across the island declines to only 26.8% of generation under clear sky conditions, with a reduction of over 125 MW generation (See Fig. S15). These factors can result in substantial supply-demand imbalances within a short timeframe (e.g., a 10-minute control cycle of system real-time operations). Under these conditions, system operations with limited flexibility may fail to fully resolve power imbalances, thus necessitating proactive load shedding and leading to a precipitous decline in customers served—a critical indicator of system resilience during extreme events. Moreover, the grid faces a higher failure risk of transmission towers and lines under the intensifying hazard (see Fig. S17). Transmission line tripping, which transfers power flow to remaining lines, can lead to line overloads and potentially trigger cascading failures. In the worst-case scenario, insufficient grid inertia against substantial transient imbalances can destabilize the grid, resulting in a catastrophic blackout. Among all the realizations, 60% result in catastrophic blackouts with complete system-wide outages. The occurrence of these catastrophic blackouts peaks at 18:00 UTC, the same time as for the real-world case (Fig. 3a).
Additionally, we identified the largest failure (the greatest decline in customers served) of each realization (Fig. 3b). In the majority of the realizations, the largest failures occur between 17:00 UTC and 19:00 UTC with 40–55% of customers served. During this period, the hurricane was closest to the island and generated the highest winds (Figs. S4–S10). The power system had been progressively weakened by cumulative damages, including less robust topology connection and decreased system flexibility and grid inertia. Subsequent failures could then directly devastate the power grid. These findings closely align with the real-world catastrophic blackout incident, highlighting a high-risk state for a weakened system. The second peak of the largest failures is at a relatively early stage, between 15:00 UTC and 16:00 UTC. Since the hazard resistance of components varies through sampling from the resistance distribution in each realization, realizations with early timing of the largest failures in the system indicate the existence of critical components—whose failure is associated with higher impacts on customers served. These failures correspond to scenarios in which critical components were assigned lower resistance within hazard resistance distribution. Failures of critical components could contribute to severe degradation of the system by triggering cascading failures or grid splitting, even at the early stage when the hazard is less severe, and the system is not yet largely weakened.
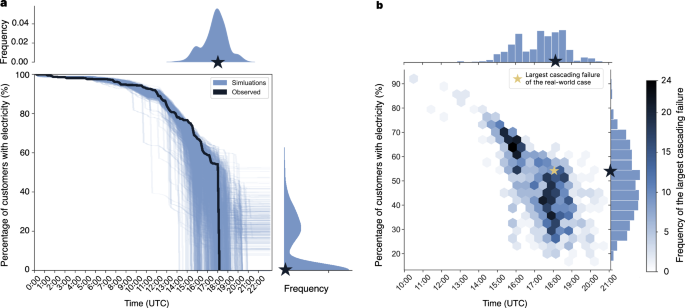
a Comparison of the percentage of total customers with electricity between the simulated and observed cases for the Puerto Rico power grid during Hurricane Fiona on September 18, 2022. The 1000 simulated cases (blue) are generated from the proposed CRESCENT model with the grid configuration as of September 2022. The observed peak outage representing the degradation of customers with electricity (black) is obtained from the US power outage datasets27 recorded by local power utilities. The right-side subfigure shows the distribution of final system statuses (percentage of customers with electricity) across all simulations. The top subfigure shows the distribution of the times when catastrophic blackouts (100% failure) occurred across all catastrophic blackout cases. b Distribution of the largest failures. The largest failure in each power outage realization is identified by the largest drop in the percentage of customers with electricity between two successive simulation time steps. A darker color in a hexagon indicates a higher density (frequency) of data points within that area. The top and right histograms show the distributions for times and system statuses, respectively, where the largest cascading failures occurred. Black stars in the top and right distributions mark the position of the observed case.
Resilience patterns
Resilience is a multi-dimensional concept encompassing pre-event planning, during-event resistance, and post-event restoration according to the “resilience trapezoid� framework28,29. Under a predefined grid configuration, the occurrence of a system-wide catastrophic blackout during an extreme event serves as a critical indicator of system resilience. Restoring a system from a system-wide blackout—“black start�, is considerably more challenging than recovering a functional grid with partial outages, as it requires substantial effort to restore the system-level balance and synchronization30. Thus, to further explore system performance against this extreme event, we categorized all the realizations into resilient (without system-wide power outages) and vulnerable (with system-wide power outages) sets (Fig. 4a, b). It is noted that the resilient cases experience their largest failures considerably earlier than the vulnerable cases. This result suggests that systems that experience relatively severe failures, causing the largest drop in customers served but still maintaining adequate functionality (e.g., above 50% of customers served) during the early stage rather than the late stage of the event, can be more robust to ride through subsequent damages under increasing hazards (Fig. S20). This finding indicates that passive early degradation might enhance system resilience. This resilience pattern, previously unidentified, reflects a similar philosophy of proactive de-energization measures, such as controlled rolling blackouts31 implemented in Texas during Winter Storm Uri in 2021 by reducing the grid’s burden and mitigating energy imbalances to prevent system-wide failure.
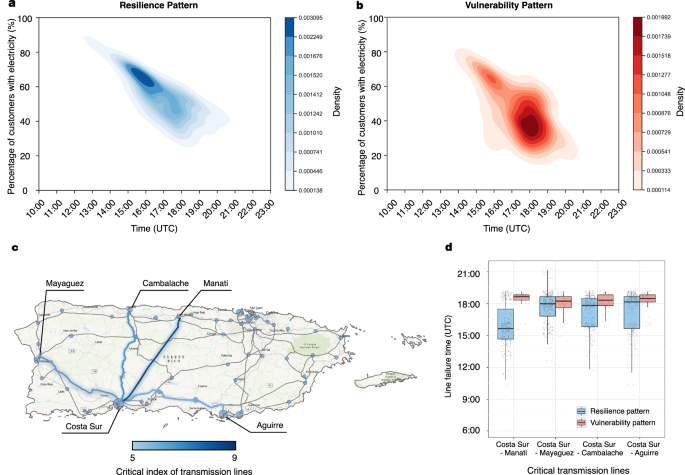
a Resilience pattern. The kernel density estimation of the largest failure (the greatest drop in customers served) in each resilient case (where the grid survives without a complete blackout) among the 1000 realizations. The darker color (blue) represents areas where the largest failures occur in the majority of resilient cases. b Vulnerability pattern. Similar to (a) but for vulnerable cases (where the grid experiences a catastrophic system-wide blackout) among the 1000 realizations. c Identified critical transmission lines in the transmission network. The critical index for a transmission line is defined as the proportion of instances where its failures directly contribute to catastrophic blackouts (a 100% complete outage occurs as soon as the line fails) across all realizations. Only those lines with a critical index higher than 5% are highlighted (blue), while the remaining lines are colored in gray. The names of substations associated with these critical lines are labeled. The transmission network with highlighted critical lines of (c) is overlaid on a basedmap from Esri57. d Resilience and vulnerability patterns of the top four critical transmission lines. The resilience pattern boxplots (blue) show the distributions of line failure times in instances where the system ultimately remains functional despite the failure of the corresponding lines. The vulnerability pattern boxplots (red) show similar distributions in instances where a catastrophic blackout occurs following the failure of the specific lines. Tiny gray dots represent individual data points. The horizontal black line within each box indicates the median, box edges show the interquartile (50%) range, and whiskers extend to the 5th and 95th percentiles.
The disparity in resilience and vulnerability patterns observed at the system level further motivates our considerations of how the failure timing of individual components, especially those with the most impact, affects system resilience. To identify these critical components, we define the critical index of a transmission line as the proportion of instances where its failures directly contribute to catastrophic blackouts among all realizations. The top four critical lines (Fig. 4c), all connected to Costa Sur—the largest power plant complex in Puerto Rico, play a vital role in the connectivity of transmission network topology, such as delivering electricity to the north region and establishing connections with the second-largest power plant complex (Aguirre). Regardless of this specific weather event, the steady-state topology analysis based on the current flow between centrality also suggests Costa Sur has the highest importance for grid resilience (see details in Supplementary Note 3).
The resilience patterns of these critical transmission lines (Fig. 4d) suggest that earlier failures of these critical lines (when the system maintains relatively adequate functionality) tend to enhance overall system resilience, consistent with the resilience patterns at the system level (Fig. 4a, b). When critical components fail early, the system remains relatively robust with sufficient network connectivity, greater flexibility, and higher grid inertia due to higher availability of generation capacity. These factors enable the system to manage power flow redistribution caused by critical component outages, reducing the likelihood of early failures escalating into a system-wide collapse. Additionally, early failures of critical components can potentially activate load-shedding mechanisms, unintentionally de-energizing the grid, which further reduces the magnitude of supply-demand imbalances caused by subsequent component failures. In a later stage, during the extreme event, the system is compromised in network connectivity, and the disruptions of critical lines followed by the large-scale power flow redistribution can overload the remaining lines, which may result in further overloads and incur cascading failures. Moreover, in a weakly connected network, the removal of these critical lines that connect to the highest-centrality node can lead to network segmentation, causing substantial power imbalances in the sub-networks and potentially leading to instability. By comparing the system’s response to critical component failures occurring early (before the median failure time of all realizations) and late (after the median failure time of all realizations), we found that early-stage failures of these critical components exhibit a lower probability of triggering cascading failures than late-stage failures (Fig. S19). To further validate this finding, we preset the hazard resistance of the most critical component (Costar Sur–Manati) to be either the weakest or the strongest among all components. When this critical component ranks within the weakest 1% and 10%, the probability of catastrophic blackouts under this extreme event is reduced by 17% and 9%, respectively. While scenarios featuring the critical component with higher wind hazard resistance exhibit increased failure probability (see Fig. S14).
Sensitivity analysis of increasing renewable integration
To explore the effects of increasing renewable integration, especially unregulated BTM distributed solar PV systems, on the risk of catastrophic blackouts, we conduct a sensitivity analysis using the proposed CRESCENT model under the same hurricane event. Here, we generate 1000 realizations considering the uncertainty in infrastructure resilience for each of the renewable integration levels ranging from 10% to 80%, where the renewable integration level is defined as the proportion of demand met by solar PV systems. Despite some BTM solar systems being equipped with energy storage for consumer self-sufficiency, such systems are not well regulated and dispatched by the grid operators and can even undermine grid resilience due to their individual optimal strategies12. Therefore, to isolate the impact of BTM solar systems and simplify the sensitivity analysis, we first investigate scenarios where the BTM solar integrations are configured without additional storage and set to operate in the widely adopted maximum power point tracking (MPPT) mode32. To eliminate regional variations, we proportionally adjust the renewable integrations according to the demand profiles of distribution feeders, ensuring a consistent level across the entire island.
By comparing these realizations, we observe a nonlinear effect of increasing environment-sensitive renewables on potential catastrophic blackouts (Fig. 5). Below a renewable integration level of approximately 45%, including the current level of 16.1%, realizations exhibited similar probabilities of catastrophic blackouts and nearly identical failure patterns. This phenomenon suggests that below this level, the risk introduced by the growth of solar generation has a minimal impact on system resilience. This can be attributed to the real-time energy balances between supply and demand remain primarily managed by adequate conventional generation, which is relatively more resilient to extreme weather impacts.
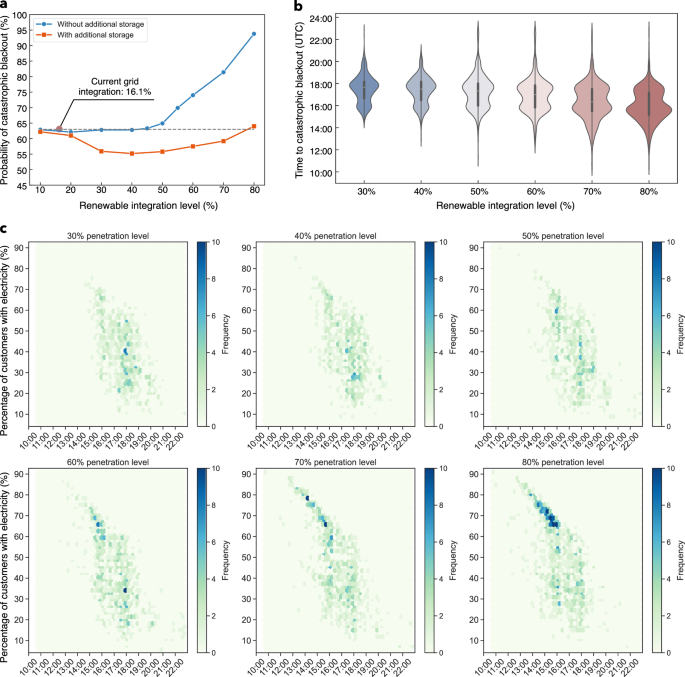
a Probability of catastrophic blackout occurrence at varying levels of renewable energy integration. The current grid (during the same period as Hurricane Fiona) with an average renewable integration level of 16.1% is marked by the red dot. The blue and orange curves show scenarios without and with additional storage, respectively. b Violin plots for the time distributions of catastrophic blackouts at varying levels of renewable energy integration without additional storage. c Distributions of catastrophic blackout occurrences at different renewable integration levels without additional storage. Each data point in the plots records the time of a catastrophic blackout occurrence and the corresponding system status (percentage of customers with electricity). A darker color in a hexagon indicates a higher density (frequency) of data points within that area. The probability for each blue point in a and the violin plots in b were calculated based on 1000 realizations generated by the proposed CRESCENT model at a specific renewable integration level under Hurricane Fiona. In the violin plot, each violin represents the distribution of system-wide blackout occurrence times at a specific level of renewable energy integration. The width of each violin indicates the frequency (probability) of blackouts at different times. The black bar within each violin shows the interquartile range, and the inside white dot represents the median time of catastrophic blackout occurrence. A larger violin size in (b) indicates more catastrophic blackouts.
However, as the renewable integration level in the system further increases, the effects of renewables begin to emerge with the failure probability exhibiting a super-linear growth (Fig. 5a). Under a high renewable integration level, the extreme weather event substantially diminishes solar-dominated generation due to wind damage and cumulonimbus cloud cover, which enlarges energy imbalances between supply and demand and further challenges grid inertia and flexibility for maintaining system stability. Therefore, the system becomes more likely to experience a catastrophic blackout at an earlier stage (Fig. 5b).
The temporal distribution of catastrophic blackouts under various renewable integration levels (Fig. 5c) more clearly demonstrates that in a renewable-dominated scenario with over 70% renewable integration, grids face significant challenges in managing even the lower intensity of hazards at early stages, despite having less cumulative damage and relatively higher system functionality (above 65%). Conversely, under the same hazard, grids with lower renewable integration (below 50%) exhibit higher resilience during the initial phases. This difference is primarily attributable to the substantial reduction in power generation of the solar-dominated power system caused by the indirect effect (cloud cover) of hurricanes on such environment-sensitive renewables (see Fig. S16), which exacerbates energy imbalances.
We further examine the scenarios where each 1 MW of BTM solar integration is paired with 0.5 MW (2 MWh) of energy storage, as projected by the Puerto Rico Demand Response Impact and Forecast Tool33. The storage systems are considered to contribute to mitigating short-term grid imbalance by providing virtual inertia through droop control mechanisms34 (see Supplementary Note 9 for detailed parameters). At the transmission network level, these energy storage systems are modeled as being aggregated at the transmission nodes associated with their respective distribution networks. When the integration level is between 20 and 70%, the energy storage systems mitigate the increased risk from BTM solar integration and even reduce the probability of catastrophic blackouts (Fig. 5a). Due to their inherently distributed nature, energy storage systems balance inertia distribution across the grid, thereby enhancing the survivability of sub-grids during grid-splitting events. However, at higher renewable integration levels, the substantial reduction in solar generation during hurricanes may still pose challenges to maintaining the system’s energy supply-demand balance, causing an increase in the probability of catastrophic blackouts.
Discussion
In the context of extreme weather events like hurricanes that cause extensive damage to electric power systems, our study presents the CRESCENT model to analyze cascading failures in climate-induced power outages. This model distinguishes itself from the existing cascading outage models at the transmission network level16,17,18,19,20,24 by accounting for the spatiotemporal climate-energy dynamics of renewable power systems. It comprehensively incorporates the effects of evolving climate extremes on utility-scale and distributed generations, and transmission and distribution networks. This model also stands out by using real-world grid datasets, validated by a weather-induced catastrophic blackout with the first-ever high-resolution outage data records (2022 Puerto Rico blackout during Hurricane Fiona). While our analysis focuses on Puerto Rico’s islanded power grid, large interconnected power systems may also face great challenges under climate extremes. A large-scale US interconnected transmission network analysis revealed that the vulnerable set—the initial failures triggering cascading events—can be small but topologically central within the network16. Moreover, the impact of dynamic extreme events may not be limited to a regional scale and can affect broader interconnected systems as hazards evolve. For example, as Hurricane Hilary moved over coastal Southern California, it caused a reduction of over 60% in California’s peak solar generation on August 20, 2023, due to extensive cumulonimbus cloud cover35. It highlights the potential risks associated with increasing penetration of environment-sensitive renewable energy in large interconnected systems, aligning with our analysis of the Puerto Rico power grid. As the proposed CRESCENT model accounts for the comprehensive effects of climate extremes on power systems, the methodology is adaptable to diverse grid configurations across various regions and can be further employed to analyze the resilience of energy transitions in future climates, by incorporating storms projected in climate change scenarios36. Also, our study exemplifies hurricanes as a primary climate threat to Puerto Rico; in the future, CRESCENT can be extended to model the impact of other climate extremes (e.g., flooding and heatwaves) to assess the overall climate resilience of renewable energy systems.
Analyzing thousands of model-generated realizations for the Puerto Rico power system during Hurricane Fiona, we identified distinct resilience and vulnerability patterns. These patterns reveal that early degradation of the system or early failure of critical components can counterintuitively enhance system resilience, enabling the grid to better withstand subsequent hurricane-induced damages. This paradoxical effect can be explained by the mechanism that early failure can reduce the energy burden on the grid and even separate the grid into multiple sub-grids in advance. Such early degradations can also alleviate the transient power imbalances and prevent the propagation of cascading failures in a later phase. Although proactive grid regulation strategies such as controlled rolling blackouts31 and organized microgrid operations37 are recognized to be effective, our analysis reveals that passive system de-energization triggered by early failures can also enhance grid resilience against evolving climate extremes. Moreover, our model can be designed to support these proactive climate-resilient strategies, offering assistance in their implementation.
To explore the role of renewable integration in this catastrophic blackout, we perform a sensitivity analysis across various solar-dominated distributed integration levels ranging from 10% to 80% within the context of the same event. Our results show the nonlinear impact of renewable energy integration on system resilience in Puerto Rico during the same event. Below a ~45% renewable integration level, including the current level of 16.1%, the integration of distributed solar systems is well-accommodated without compromising system stability. In contrast, surpassing this level toward a 100% renewable grid may greatly increase the risk of climate-induced cascading power outages, primarily due to enlarged energy imbalances resulting from substantial reductions in renewable generation that further challenge the grid inertia and system flexibility. As decarbonizing the energy sector using renewable energy sources like solar and wind is crucial to mitigate climate change, we emphasize that this work is not advocating against the adoption of renewable energy but rather aims to highlight the importance of understanding the potential risks associated with renewable integration during extreme weather events and developing risk mitigation strategies. We also show that energy storage systems, through their droop control-based grid-forming mechanism, can effectively mitigate the risks of solar integration and even reduce the probability of catastrophic blackouts.
We note that this sensitivity analysis does not account for the contribution of energy storage associated with BTM solar installations to relatively long-term imbalances such as hourly operations and daily unit commitment flexibility due to the current lack of a unified dispatch mechanism for such individually optimized distributed systems, which are even recognized to potentially compromise grid resilience12. However, the coordinated aggregation of energy storage systems, providing virtual inertia and additional flexibility, presents a promising solution to mitigate the risks associated with the large-scale integration of renewable energy. Developing resilience-oriented operational strategies and grid planning with comprehensive energy storage models is essential to better understand its impact on system resilience. Moreover, while virtual inertia from energy storage has been extensively studied in microgrids34,38, its performance in bulk power systems under large disturbances requires further theoretical and practical evaluation. Although the quantitative results of the sensitivity analysis are derived for a specific hurricane, our methodology can serve as a broadly useful tool for assessing the risks associated with different generation portfolios of a regional power system in response to forecasted or projected extreme weather events. This approach enables stakeholders and grid operators to make informed decisions on optimizing generation portfolios and operation strategies for enhancing climate resilience, thereby ensuring a more sustainable energy transition. In future work, this methodology can be extended to investigate how spatial heterogeneity and capacity expansion strategies for renewable energy and storage systems influence the risk of catastrophic blackouts under projected extreme events in a changing climate.
Methods
Energy system configurations
The configuration of the realistic Puerto Rico electric power system in 2022 (during the same period as Hurricane Fiona) is comprehensively defined by high-resolution datasets across utility-scale and distributed generation resources, transmission and distribution networks, and demand profiles.
Data on the capacity and detailed location information of all utility-scale generation units, including utility-scale solar PV systems, wind turbines, hydropower, and other traditional power plants as of September 2022 were obtained from the US Energy Information Administration (EIA) Form EIA-860 Preliminary Monthly Electric Generator Inventory39. Operation availability for all Puerto Rico power plants during Hurricane Fiona was obtained from the Daily Generation Availability Report (September 18th, 2022, the same day as Hurricane Fiona’s landfall) of the local power utility (LUMA Energy, also the grid operator)40. Generation unit parameters (e.g., ramp up/down rates in MW/minute) were obtained from the Puerto Rico Integrated Resource Plan 2018–2019 for Puerto Rico Electric Power Authority (PREPA)41. The installed capacity of distributed generation, specifically rooftop solar PV systems, of each distribution feeder in September 2022 was collected from the local power utility40. Geographic information system data for the Puerto Rico transmission and distribution networks, as recorded in September 2022, were also obtained from the local power utility40 (see visualizations in Fig. 2c–f). This dataset includes segment types and parameters of all 115 and 230 kV transmission lines of the transmission network, which are subsequently used in calculating network cascades and steady-state power flow. The distribution network part of this dataset includes the detailed geospatial topology of 956 operational distribution feeders with their connections to substations (see Fig. 2f and Fig. S2). The demand profile of each distribution feeder is also included in this dataset. Other detailed configurations of the Puerto Rico power system, including generator parameters and illustrations of the transmission network, the distribution networks, and the distribution feeders, are shown in Table S1 and Figs. S1, S2.
Hurricane hazard model
The track of Hurricane Fiona was sourced from the International Best Track Archive for Climate Stewardship (IBTrACS) at the National Center for Environmental Information of the National Oceanic and Atmospheric Administration (NOAA)42, which includes time-series data of the hurricane’s center locations, maximum sustained wind speed, and radius of maximum wind. To align with the temporal scale of real-time power system operations, we interpolated the track data from a 3-hour to a 10-minute interval. A physics-based wind profile model that accounts for both the tropical cyclone’s inner core and outer radii dynamics43 is used to generate the hurricane wind profile according to the track information. By integrating this boundary-layer hurricane wind profile with environmental background flow derived from the storm’s translation speed44, the asymmetric spatiotemporal wind fields for the hurricane are obtained. The accuracy of this wind field model has been validated for simulating tropical cyclone hazards such as coastal winds, rainfall, and storm surges45,46. To further consider the land roughness impact on the surface-layer wind speed, we converted the wind speeds based on the land cover classes using the logarithmic vertical wind speed profile47,48. Data on Puerto Rico’s land cover classes, e.g., residential, forests, crops, and wetlands, were obtained from the National Land Cover Database (NLCD) of the United States Geological Survey (USGS)49. For detailed information on the land roughness of Puerto Rico, see Fig. S11.
Power outage data
Spatiotemporal power outage data on the 2022 Puerto Rico blackout during Hurricane Fiona (as shown in Fig. 2a and the observed curve in Fig. 3a) were sourced from the US power outage datasets27. The data for this specific event, detailing the percentage of customers without electricity across seven regions (Fig. S3) of Puerto Rico, were recorded by the Puerto Rico grid operator, LUMA Energy40, at 10-minute intervals, spanning from pre-event to post-event periods. The island’s power grid experienced a system-wide catastrophic blackout between 17:50 and 18:00 UTC on September 18th, 2022. The data recording was terminated after the catastrophic blackout and was not recovered until September 20th, 2022. These outage data represent the first high-resolution spatiotemporal record of a system-wide blackout induced by a climate extreme event, as the grid’s modernization and digitalization have been improved by LUMA Energy since it became the grid operator in 2021.
Renewable power system vulnerability model
The vulnerability model is used to generate spatiotemporal disturbances in the renewable power system for each realization. It accounts for infrastructure damage caused by hurricane winds and the decline in power generation from environment-sensitive renewable energy resources. Infrastructure damage depends on the fragility of grid components, which include renewable energy structures (primarily solar panels), transmission towers, transmission lines, and distribution feeders. The damage estimates of these components are based on a series of functions known as fragility curves13,23,50,51, which describe the relationship between component failure probability and wind intensity. The selected fragility curves were particularly designed and calibrated for Puerto Rico, including utility-scale and distributed rooftop solar panels13, transmission lines23, transmission towers50, and distribution feeders51. Applying existing fragility curves, which are mostly independent of hazard duration, directly in spatiotemporal risk analysis can lead to an overestimation of infrastructure damage due to repeated sampling51. Therefore, we define resistance functions by taking the inverse of these fragility functions, thereby characterizing the distribution of wind resistance for each type of component. Rather than sampling fragility curves for time-varying failure probabilities of components, we assign time-invariant hazard resistances to components by sampling their resistance distributions in each realization. During the spatiotemporal risk analysis, if the wind intensity at a grid component exceeds its assigned resistance value, which is sampled at the onset of each realization, the component is considered to have failed. The spatiotemporal vulnerability model for generating disturbances is configured with a 10-minute time interval, aligning with the timescale of real-time operations.
The decline in renewable energy resources accounts for the spatiotemporal impact of hurricane-induced cumulonimbus cloud cover on solar irradiance, leading to reduced generation output from both utility-scale and distributed rooftop solar PV systems. The solar generation reduction rate is derived from a solar irradiance decay model14, validated by large-scale historical global horizontal irradiance data and Atlantic hurricane activity from the Atlantic hurricane database from 2001 to 2017 (see details in Supplementary Note 7). Additionally, as the wind intensity (above 33 m/s) of a hurricane exceeds the typical cut-off speed (25 m/s) of existing wind turbines, wind turbines are considered to shut down during the hurricane period.
Multi-scale spatiotemporal cascade model
Informed by the renewable power system vulnerability model under evolving climate extremes, a multi-scale spatiotemporal cascade model is developed to simulate network dynamics. We expand state-of-the-art network cascade models designed for common-cause initial disturbances, to account for the decision-making system’s network dynamic evolution influenced by multi-scale system resilience factors—grid inertia and system flexibility—under climate extremes.
The system’s dynamic evolution is discretized based on the real-time operations of the power system in a 10-minute time interval with a temporal discretization set denoted by (mathcalT). At each time step (tin mathcalT), given the damage state estimated from the hazard and vulnerability models, we conduct a topology analysis of the transmission network to identify the set (boldsymbolmathcalGleft(tright)) for all connected subgraphs (mathcalG_nleft(tright)), that is, functional sub-grids with active generators and demand nodes. For each functional sub-grid (initially, only a single sub-grid exists, corresponding to the main grid before any damage occurs), the network cascading dynamics are built upon the widely adopted ORNL-PSERC-Alaska (OPA) cascade model17,52. This model simulates the process of line overloads and subsequent cascading line tripping, triggered by initial failures due to infrastructure damage and subsequent power flow redistribution. Due to potential initial transmission corridor failures, power flow redistributes across the network, potentially overloading certain lines (exceeding their capacities) and subsequently tripping them—thereby triggering cascading failures. The network cascading failures could potentially result in grid splitting and reform the network topology with an updated set (boldsymbolmathcalG^prime left(tright)). Within a functional sub-grid (mathcalG_n^prime left(tright)in boldsymbolmathcalG^prime left(tright)), the power imbalance (Delta P_imb^left(nright)left(tright)) of this sub-grid is determined by the deviation of the total generation (sum _gin mathcalP_nP_g,t) (accounting for the decline in renewable energy resources during the extreme event) from total demand (sum _din mathcalD_nL_d,t) within the network, i.e.,
where (mathcalD_n) and (mathcalP_n) denote the sets of demand and generation units within the sub-grid.
Grid inertia quantifies the system’s capability to mitigate the effect of the power imbalance. We use the rate of change of frequency (RoCoF)53 jointly determined by the power imbalance and grid inertia provided by synchronous generators as a system stability constraint. A high RoCoF indicates that the system may reach a frequency nadir or zenith exceeding the system’s tolerance, thereby triggering the off-grid protection of generation units. We select the maximum RoCoF threshold as  ±2 Hz/s following the recommendations by the National Renewable Energy Laboratory (NREL) for the Puerto Rico power grid54. For each sub-grid at time step (tin mathcalT), we calculate the maximum RoCoF (Hz/s) by
where f0 is the rated 60 Hz frequency for the grid, (mathcalP_n^SG) denotes the set of synchronous generators, HSG,g and (P_SG,g^nom) represent the inertia constant and nominal generation capacity of a synchronous generator, respectively. The sub-grid is removed from the functional network set if its maximum RoCoF exceeds the  ±2 Hz/s threshold. For a detailed derivation of the maximum RoCoF, see Supplementary Note 5.
For surviving sub-grids, we further embed the decision-making process of the system’s real-time operations to eliminate power imbalances, accounting for system flexibility. The progressive decline in climate-sensitive renewable generation under evolving climate extremes requires more flexible resources, e.g., dispatchable generation units, to meet the power balance constraint of the network. The decision-making operations of the power system during climate extreme events are formulated by solving a mixed-integer linear programming (MILP)-based grid operation model, which is adapted from unit commitment (normal operation) and optimal load shedding (remedial control) models55,56. The objective function of the grid operation model is designed to minimize the losses of load shedding and the curtailment of generation units by using flexible dispatchable resources within the network. The detailed model setup and programming solver for the grid operation model are provided in Supplementary Note 6.
Data availability
Power outage data were obtained from the US power outage datasets, available at https://poweroutage.us/. Information on generation units in Puerto Rico can be downloaded from the Monthly Electric Generator Inventory in US Energy Information Administration Form EIA-860M (https://www.eia.gov/electricity/data/eia860m/). Information regarding the power grid configurations and generation availability can be accessed from LUMA Energy (https://lumapr.com/resumen-del-sistema/). Source file data are available on Figshare (https://doi.org/10.6084/m9.figshare.28038686).
Code availability
All realizations were performed using MATLAB R2022a. The code is stored in a publicly available Zenodo repository (https://doi.org/10.5281/zenodo.14723062).
References
-
Xu, L. et al. Resilience of renewable power systems under climate risks. Nat. Rev. E Eng. 1, 53–66 (2024).
-
Stankovski, A., Gjorgiev, B., Locher, L. & Sansavini, G. Power blackouts in Europe: analyses, key insights, and recommendations from empirical evidence. Joule 7, 2468–2484 (2023).
-
Climate Central. Surging power outages and climate change. https://www.climatecentral.org/ (2022).
-
United States Department of Energy. Hurricanes Nate, Maria, Irma, and Harvey situation reports. https://www.energy.gov/ceser/articles/hurricanes-nate-maria-irma-and-harvey-situation-reports (2017).
-
United States Department of Energy. Hurricane Fiona situation reports. https://www.energy.gov/ceser/hurricane-fiona-situation-reports (2022).
-
National Oceanic and Atmospheric Administration. U.S. billion-dollar weather and climate disasters. https://www.ncei.noaa.gov/access/billions/ (2023).
-
Massol-Deyá, A., Stephens, J. C. & Colón, J. L. Renewable energy for Puerto Rico. Science 362, 7–7 (2018).
-
Davis, S. J. et al. Net-zero emissions energy systems. Science 360, eaas9793 (2018).
-
Meadowcroft, J. & Rosenbloom, D. Governing the net-zero transition: strategy, policy, and politics. Proc. Natl Acad. Sci. USA 120, e2207727120 (2023).
-
Gobierno de Puerto Rico. Puerto Rico Energy Public Policy Act 17. https://www.pr.gov/ (2019).
-
Denholm, P. et al. The challenges of achieving a 100% renewable electricity system in the United States. Joule 5, 1331–1352 (2021).
-
Smith, O., Cattell, O., Farcot, E., O’Dea, R. D. & Hopcraft, K. I. The effect of renewable energy incorporation on power grid stability and resilience. Sci. Adv. 8, eabj6734 (2022).
-
Ceferino, L., Lin, N. & Xi, D. Bayesian updating of solar panel fragility curves and implications of higher panel strength for solar generation resilience. Reliab. Eng. Syst. Saf. 229, 108896 (2023).
-
Ceferino, L., Lin, N. & Xi, D. Stochastic modeling of solar irradiance during hurricanes. Stoch. Environ. Res. Risk Assess. 36, 2681–2693 (2022).
-
Craig, M. T. et al. Overcoming the disconnect between energy system and climate modeling. Joule 6, 1405–1417 (2022).
-
Yang, Y., Nishikawa, T. & Motter, A. E. Small vulnerable sets determine large network cascades in power grids. Science 358, eaan3184 (2017).
-
Dobson, I., Carreras, B. A., Lynch, V. E. & Newman, D. E. Complex systems analysis of series of blackouts: Cascading failure, critical points, and self-organization. Chaos 17, 026103 (2007).
-
Buldyrev, S. V., Parshani, R., Paul, G., Stanley, H. E. & Havlin, S. Catastrophic cascade of failures in interdependent networks. Nature 464, 1025–1028 (2010).
-
Gao, J., Barzel, B. & Barabási, A.-L. Universal resilience patterns in complex networks. Nature 530, 307–312 (2016).
-
Schäfer, B., Witthaut, D., Timme, M. & Latora, V. Dynamically induced cascading failures in power grids. Nat. Commun. 9, 1975 (2018).
-
Perera, A., Nik, V. M., Chen, D., Scartezzini, J.-L. & Hong, T. Quantifying the impacts of climate change and extreme climate events on energy systems. Nat. Energy 5, 150–159 (2020).
-
Perera, A. T. D. et al. Challenges resulting from urban density and climate change for the EU energy transition. Nat. Energy 8, 397–412 (2023).
-
Bennett, J. A. et al. Extending energy system modelling to include extreme weather risks and application to hurricane events in Puerto Rico. Nat. Energy 6, 240–249 (2021).
-
Stürmer, J. et al. Increasing the resilience of the Texas power grid against extreme storms by hardening critical lines. Nat. Energy 9, 526–535 (2024).
-
Webster, M., Fisher-Vanden, K., Kumar, V., Lammers, R. B. & Perla, J. Integrated hydrological, power system and economic modelling of climate impacts on electricity demand and cost. Nat. Energy 7, 163–169 (2022).
-
Feng, K., Ouyang, M. & Lin, N. Tropical cyclone-blackout-heatwave compound hazard resilience in a changing climate. Nat. Commun. 13, 4421 (2022).
-
Poweroutage. The power outage monitoring product. https://poweroutage.us/ (2022).
-
Panteli, M., Trakas, D. N., Mancarella, P. & Hatziargyriou, N. D. Power systems resilience assessment: hardening and smart operational enhancement strategies. Proc. IEEE 105, 1202–1213 (2017).
-
Xu, L., Guo, Q., Sheng, Y., Muyeen, S. & Sun, H. On the resilience of modern power systems: a comprehensive review from the cyber-physical perspective. Renew. Sustain. Energy Rev. 152, 111642 (2021).
-
Zhao, J., Zhang, Q., Ziwen, L. & Xiaokang, W. A distributed black-start optimization method for global transmission and distribution network. IEEE Trans. Power Syst. 36, 4471–4481 (2021).
-
Federal Energy Regulatory Commission (FERC). The February 2021 cold weather outages in Texas and the south central United States. https://ferc.gov/media/february-2021-cold-weather-outages-texas-and-south-central-united-states-ferc-nerc-and (2021).
-
Subudhi, B. & Pradhan, R. A comparative study on maximum power point tracking techniques for photovoltaic power systems. IEEE Trans. Sustain. Energy 4, 89–98 (2012).
-
National Renewable Energy Laboratory. Puerto Rico demand response impact and forecast tool. https://www.nrel.gov/state-local-tribal/pr-drift.html/ (2022).
-
Song, Y., Hill, D. J. & Liu, T. Impact of DG connection topology on the stability of inverter-based microgrids. IEEE Trans. Power Syst. 34, 3970–3972 (2019).
-
California Independent System Operator. Today’s outlook. https://www.caiso.com/Pages/default.aspx (2023).
-
Xi, D., Lin, N. & Gori, A. Increasing sequential tropical cyclone hazards along the US East and Gulf coasts. Nat. Clim. Change 13, 258–265 (2023).
-
Jin, A. S. et al. Building resilience will require compromise on efficiency. Nat. Energy 6, 997–999 (2021).
-
D’Arco, S. & Suul, J. A. Equivalence of virtual synchronous machines and frequency-droops for converter-based microgrids. IEEE Trans. Smart Grid 5, 394–395 (2013).
-
United States Energy Information Administration. Preliminary monthly electric generator inventory. https://www.eia.gov/electricity/data/eia860m/ (2022).
-
LUMA Energy. System operator of the Puerto Rico power grid. https://lumapr.com/system-operator-home/ (2023).
-
Gobierno de Puerto Rico. Integrated resource plan. https://energia.pr.gov/en/integrated-resource-plan/ (2023).
-
Schreck, C. J., Knapp, K. R. & Kossin, J. P. The impact of best track discrepancies on global tropical cyclone climatologies using ibtracs. Mon. Weather Rev. 142, 3881–3899 (2014).
-
Chavas, D. R., Lin, N. & Emanuel, K. A model for the complete radial structure of the tropical cyclone wind field. Part I: comparison with observed structure. J. Atmos. Sci. 72, 3647–3662 (2015).
-
Lin, N. & Chavas, D. On hurricane parametric wind and applications in storm surge modeling. J. Geophys. Res. Atmos. 117 (2012).
-
Xi, D., Lin, N. & Smith, J. Evaluation of a physics-based tropical cyclone rainfall model for risk assessment. J. Hydrometeorol. 21, 2197–2218 (2020).
-
Wang, S., Lin, N. & Gori, A. Investigation of tropical cyclone wind models with application to storm tide simulations. J. Geophys. Res. Atmos. 127, e2021JD036359 (2022).
-
Stull, R. B. An Introduction to Boundary Layer Meteorology Vol. 13 (Springer Science & Business Media, 2012).
-
Ro, K. & Hunt, P. Characteristic wind speed distributions and reliability of the logarithmic wind profile. J. Environ. Eng. 133, 313–318 (2007).
-
Homer, C. et al. Conterminous united states land cover change patterns 2001–2016 from the 2016 national land cover database. ISPRS J. Photogramm. Remote Sens. 162, 184–199 (2020).
-
dos Reis, F. B. et al. Methodology to calibrate fragility curves using limited real-world data. In 2022 IEEE Power & Energy Society General Meeting (PESGM) 01–05 (IEEE, 2022).
-
Xu, L., Lin, N., Xi, D., Feng, K. & Poor, H. V. Hazard resistance-based spatiotemporal risk analysis for distribution network outages during hurricanes. IEEE Trans. Power Syst. (2024).
-
Bialek, J. et al. Benchmarking and validation of cascading failure analysis tools. IEEE Trans. Power Syst. 31, 4887–4900 (2016).
-
Azizi, S., Sun, M., Liu, G. & Terzija, V. Local frequency-based estimation of the rate of change of frequency of the center of inertia. IEEE Trans. Power Syst. 35, 4948–4951 (2020).
-
Gevorgian, V., Baggu, M. M. & Ton, D. Interconnection Requirements for Renewable Generation and Energy Storage in Island Systems: Puerto Rico Example. Tech. Rep. (National Renewable Energy Lab (NREL), 2019).
-
Knueven, B., Ostrowski, J. & Watson, J.-P. On mixed-integer programming formulations for the unit commitment problem. INFORMS J. Comput. 32, 857–876 (2020).
-
Aminifar, F., Fotuhi-Firuzabad, M., Shahidehpour, M. & Safdarian, A. Impact of wams malfunction on power system reliability assessment. IEEE Trans. Smart Grid 3, 1302–1309 (2012).
-
Esri. World topographic map [basemap]. https://www.arcgis.com/home/item.html?id=7dc6cea0b1764a1f9af2e679f642f0f5 (2023).
-
Esri. World imagery [basemap]. http://www.arcgis.com/home/item.html?id=10df2279f9684e4a9f6a7f08febac2a9 (2023).
Acknowledgements
L.X., N.L., and D.X. were supported in part by US National Science Foundation grant number 2103754 (as part of the Megalopolitan Coastal Transformation Hub, with contribution number 49) and the Princeton University Metropolis Project. H.V.P. was supported in part by a grant from the C3.ai Digital Transformation Institute. L.X., N.L., and H.V.P. were also supported in part by a grant from the Fund for Energy Research with Corporate Partners of Princeton’s Andlinger Center for Energy and the Environment. The authors thank N. Zhang at USC Iovine and Young Academy for developing the original artwork for this article.
Author information
Authors and Affiliations
Contributions
L.X. contributed to the conceptualization, methodology, and writing of the initial draft. N.L. contributed to the conceptualization, writing, reviewing, editing, supervision, and guidance. H.V.P. contributed to writing, reviewing, editing, supervision, and guidance. D.X. contributed to methodology and editing. A.T.D.P. contributed to writing, reviewing, and editing.
Corresponding author
Ethics declarations
Competing interests
The authors declare no competing interests.
Peer review
Peer review information
Nature Communications thanks Michael Craig and the other, anonymous, reviewer(s) for their contribution to the peer review of this work. A peer review file is available.
Additional information
Publisher’s note Springer Nature remains neutral with regard to jurisdictional claims in published maps and institutional affiliations.
Supplementary information
Rights and permissions
Open Access This article is licensed under a Creative Commons Attribution-NonCommercial-NoDerivatives 4.0 International License, which permits any non-commercial use, sharing, distribution and reproduction in any medium or format, as long as you give appropriate credit to the original author(s) and the source, provide a link to the Creative Commons licence, and indicate if you modified the licensed material. You do not have permission under this licence to share adapted material derived from this article or parts of it. The images or other third party material in this article are included in the article’s Creative Commons licence, unless indicated otherwise in a credit line to the material. If material is not included in the article’s Creative Commons licence and your intended use is not permitted by statutory regulation or exceeds the permitted use, you will need to obtain permission directly from the copyright holder. To view a copy of this licence, visit http://creativecommons.org/licenses/by-nc-nd/4.0/.
About this article
Cite this article
Xu, L., Lin, N., Poor, H.V. et al. Quantifying cascading power outages during climate extremes considering renewable energy integration.
Nat Commun 16, 2582 (2025). https://doi.org/10.1038/s41467-025-57565-4
-
Received: 08 May 2024
-
Accepted: 24 February 2025
-
Published: 16 March 2025
-
DOI: https://doi.org/10.1038/s41467-025-57565-4
Search
RECENT PRESS RELEASES
Related Post


