Shorts In A Twist: Tesla Shares Seem To Be Going Through A Classic “Squeeze”
February 9, 2020
Coming up short. Getting the short end of the stick. Short-sighted.
Those trite expressions might describe how people who piled into short positions in Tesla Inc TSLA 0.12% stock feel now as shares skyrocket in a rally that’s nothing short of hyperbolic. Before shares began their feverish climb in December 2019, TSLA was among the most heavily “shorted” companies on the market.
Stocks To Watch Daily
What if you didn’t have to hunt around the internet looking for trade ideas every day? What if top researchers, analysts, and news correspondents did all the research for you? What if you could get all of that research in the easiest possible format every morning before the market opens? That’s exactly what you get when you subscribe to Benzinga Stocks To Watch. Click here to subscribe.
Now, anyone who had a short position—betting on shares to fall—is either holding on for dear life or already jumped ship as the stock rose as much as 20% a day the first week of February. CNBC even added it to their main ticker flash on the screen along with the major indices. A year ago, the stock was down in the dumps and every article was negative. Now it’s the darling of Wall Street and every article is positive.
Why is this happening to TSLA shares, and why now? There’s a bunch of possible reasons, but a “short squeeze” is one of the main ones.
Whether you can call TSLA’s price action a short squeeze may be up for debate. But the classic signs are there: A dynamic narrative, a case for massive growth as well a case for financial stress, and deep pockets having lined up on both sides of the trade.
Here’s how to identify a squeeze and how you might want to play it (or not).
The Short Squeeze Explained
You’re probably familiar with the terms “short selling,” “going short the stock market,” “shorting a stock,” or “selling stocks short.” The aim when shorting a stock is to generate profit from stocks that decline in value. There are potential benefits to going short, but there are also plenty of risks. One big risk is when bullish news pushes a stock price higher, prompting short sellers to head for the exits all at once. As the shorts scramble to buy back and cover losses, upward momentum builds upon itself and the stock can move sharply higher.
This is known as a “short squeeze.”
What makes a short squeeze so dangerous? Think of it this way: When you buy a stock, the worst thing it can do is go to zero. Sure, in some of today’s big-name stocks such as Google parent Alphabet Inc GOOGL 0.21% and Amazon.com, Inc. AMZN 1.42% which have shares trading around $1,400 and $2,000 per share respectively, it can be a long way to zero. But still, the upside is unlimited. If a stock has a growth narrative, and there are enough believers, today’s share price can go well beyond what looks reasonable by traditional fundamental metrics.
Or, as goes the old adage (widely attributed to economist John Maynard Keynes in the 1930s), “a market can stay irrational longer than you can stay solvent.” Even if a high-flyer does come back to earth in the long run, the shorts may be wiped out long before then. Or, in another quip by Lord Keynes, “in the long run, we are all dead.”
TSLA does appear to be in the throes of a short squeeze. What you’re getting here is people who are covering because they have to. That’s what can cause things to get out of whack—people making trades they don’t want to make but have to.
Ask yourself, “who would buy TSLA up here?” The answer? Someone who’s forced to. Someone who didn’t have enough money to hold on any more, or someone whose pain threshold has been violated.
The Squeeze Is On?
Again, shorting a stock is complicated business. Since you can’t sell something you don’t own, shorting requires the seller to “borrow” the stock and pay interest to the stock lender), then sell it. Locating the shares can sometimes be difficult for your clearing firm, due to high demand or a small number of outstanding shares (“the float”).
Measuring a short squeeze can involve a metric called the short interest ratio, aka “days to cover.” It indicates, in days, how long it would take to cover, or buy back, all the shorted shares. Basically, you divide the number of shares sold short by the average daily trading volume. The longer the days to cover, the more pronounced this effect can be. But it’s not the only story. TSLA, for example, has a relatively low short interest ratio as of February 4, 2020. But many traders see the activity as indicative of a squeeze (see figure 1 below).
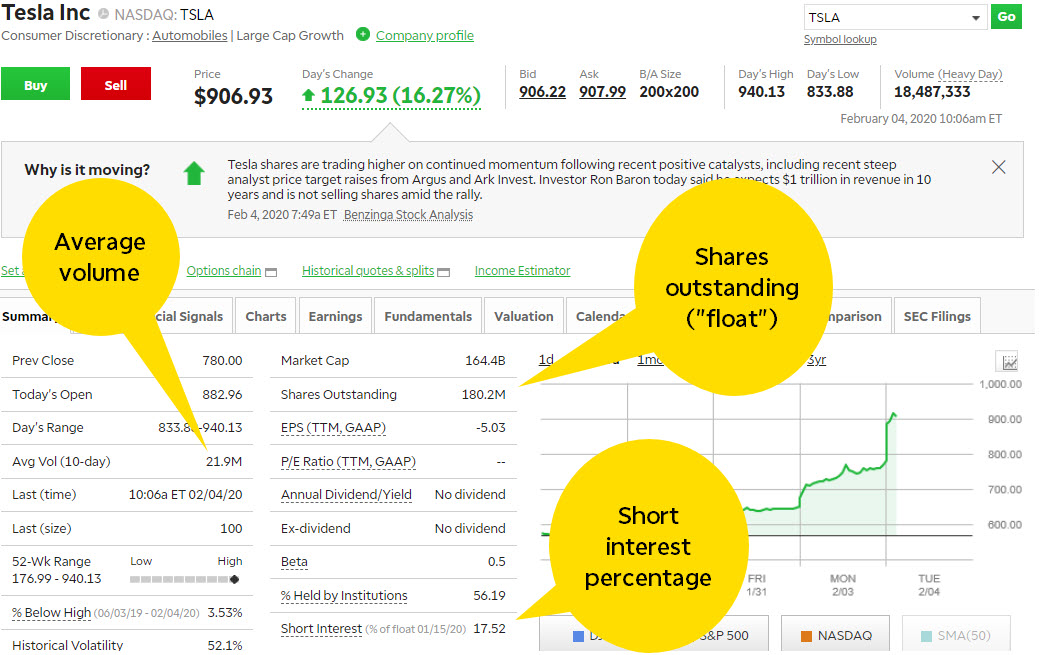
FIGURE 1: VOLUME AND FLOAT. Fundamental data available on the TD Ameritrade platform can help you analyze the dynamics of a stock’s price action. Source: TDAmeritrade.com. For illustrative purposes only. Past performance does not guarantee future results.
Technical Analysis And Short Squeezes
When markets show explosive activity, it’s easy to see in hindsight. But there are tools that could help identify when the momentum could build up so you don’t end up on the wrong side of the trade. On the thinkorswim platform, there’s an indicator called TTM Squeeze, which can help identify when the transition between a consolidation and trend is likely to take place. Pull up a chart from the Charts tab on thinkorswim, select Studies > Add Study > All Studies > T–U > TTM_Squeeze. In figure 2, the TTM Squeeze is plotted in the subchart below the price chart.

FIGURE 2: AFTER THE SQUEEZE. After a period of compression, Tesla stock (TSLA-candlestick) started showing signs that perhaps it would start making an upward move. In early October 2019, the TTM Squeeze indicator (subchart) showed momentum building up in the stock. This coincided with the stock moving above its 20-period moving average (blue line). The stock has continued its upward move and has exploded well above the moving average. Data source: Nasdaq. Chart source: The thinkorswim® platform from TD Ameritrade. For illustrative purposes only. Past performance does not guarantee future results.
The indicator (dots along zero line) is plotted with the Momentum Oscillator (cyan vertical bars). Notice how the oscillator gradually started moving above the zero line and the histogram bars were getting taller in height? This indicated a possible build-up of momentum. The dots plotted on the zero line are green, which suggests the market is ready to trend.
Red dots suggest the market is tightening. If momentum is above the zero line, the direction of price movement is up and when it’s below the zero line, price movement is likely to be down. It may be helpful to plot an additional indicator such as the moving average to confirm the trend.
In this case the momentum was clearly building for an uptrend and as you can see from the chart, the momentum became extremely strong, pushing the stock price significantly higher. When might it slow down? Keep an eye on the TTM Squeeze indicator.
Fundamental Files
If you’re buying TSLA here, especially at these levels, it helps to understand why the stock is moving. Aside from any short squeeze, that is.
One analyst speculated that TSLA might soon join the S&P 500, which would mean some of the recent buying might be on hope that fund managers would have to jump in if that happens—index funds must hold a commensurate amount of shares of all the index components. Another analyst was on the air Tuesday talking about the chance of eventual $1 trillion a year revenue for the company. Probably something people should take with a huge grain of salt.
Another possible reason is that after years of sputtering, the company appears to finally be getting its financials into better shape. It’s had two positive earnings quarters in a row, and its vehicle production and deliveries in 2019 met its own expectations. The company might be developing some trust with investors after scaring them away a few years ago with huge losses, promises it couldn’t always keep, and some questionable public behavior by CEO Elon Musk that ended up getting him in trouble with the U.S. government.
Now TSLA appears to be firing on most cylinders, and what we’re seeing is the kind of market speculation that surrounds someone who can land a rocket ship on a barge in the middle of the ocean. People like Musk tend to get that kind of recognition.
Playing The Squeeze? Hope You’re Comfortable With Risk
So you say you want to play TSLA in what might be a short squeeze? Here’s some stuff to consider.
Trading TSLA here is something that’s OK to do as long as you understand the risk and how to control it. You can make small or big bets, but you have to control risk and limit it. Decide how much money you can lose in any trade.
Also, people shouldn’t underestimate how far this can go and how long it can take. Everyone believes TSLA will eventually correct, but to what price and when? That’s what no one can answer.
These things can go on for a while. All you have to do is look at the drought of 2012 in the grain markets. Grain futures then rose farther than anyone thought they could and stayed there a while. It was a short squeeze based on lack of volume, a drought that caused demand to go crazy, and speculation running rampant.
One way to consider playing TSLA is in the options market. There’s a piece of classic advice about limited risk: Want to get short exposure? Consider buying a put or put vertical, or selling a call vertical. For more on limited-risk options strategies, please refer to this primer.
And remember: A short squeeze doesn’t last forever and will eventually subside.
Information from TDA is not intended to be investment advice or construed as a recommendation or endorsement of any particular investment or investment strategy, and is for illustrative purposes only. Be sure to understand all risks involved with each strategy.
Search
RECENT PRESS RELEASES
Related Post


