Strategic mangrove restoration increases carbon stock capacity
May 31, 2025
Abstract
Mangrove forests’ restoration has gained traction as a sustainable solution to mitigate the effects of greenhouse gas emissions and to provide ecosystem services, such as coastal protection. Restoration projects are often informed by expert judgment rather than a quantitative understanding and have a high failure rate. Monitoring mangrove restoration performance may take decades and has a strong case study dependency. To optimise restoration strategies, we developed an individual-based mangrove and process-based hydro-morphodynamic model to simulate multi-species mangrove forest trajectories, including the physical environment’s feedback. We find a significant impact of planting zonation on the mudflat behaviour, with seaward erosion and in-forest-landward deposition. Planting mangroves close to mean sea level decreases carbon storage potential due to increased mudflat erosion. Configuring planting in multiple patches proves beneficial to mangrove biomass development, expansion, and sediment accumulation. Combined with sound monitoring, the developed tool can potentially optimize planned mangrove restoration strategies.
Introduction
Global carbon mitigation goals aim to reach net zero emissions by 20501 and to cut current carbon emissions to half by 2030 to limit global warming to 1.5 °C2. Coastal ecosystems, known as blue carbon, contribute to more than half of carbon sequestration in the ocean, albeit occupying just 0.5% of the total sea floor3. Long-term carbon sequestration per unit vegetated area in coastal forest ecosystems is estimated to be three to five times that of terrestrial forests4.
Restoring degraded mangrove forests can play a crucial role in achieving global targets on climate change mitigation and adaptation5,6,7 due to their comparatively large carbon burial rate4 compared to other blue carbon pools. A key factor in mangroves’ efficiency in sequestering carbon is their complex aerial root structure trapping fine sediment8. Due to waterlogged and anaerobic conditions, up to 90% of the organic carbon originating from either local mangroves or external sources is preserved in the sediment and fine root system8,9, acting as a long-term carbon sink6. In addition, mangroves comprise unique ecosystems and provide valuable ecosystem services10 and other carbon-related benefits11. One of these services is attenuating storm surges and dissipating wind waves, thereby reducing coastal flood risk7. Wave attenuation potential depends on both biophysical mangrove properties12,13 and geomorphic settings (hydrodynamic conditions, sediment properties, local topography, and the coastal landscape)7.
Being historically perceived as of low monetary value, mangrove forest eradication by land use conversion has globally decreased mangrove coverage14. This has led to mangrove belts being amongst the most threatened forests15,16, and to increase flood risk for 15 million people who were currently protected by the presence of mangrove forests annually17. When deforested and reclaimed, the soil is no longer waterlogged and changes to aerobic conditions4. Moreover, the loss of mangroves may lead to the degradation of coastal wetlands, thus increasing the release of the long-buried carbon6. Consequently, mangrove loss can shift the role of mangrove forests from carbon sink to carbon source, potentially contributing up to 10% of total emissions from deforestation18.
Recognising their value for climate change mitigation and adaptation, mangrove ecosystem conservation and restoration have high strategic potential as a sustainable climate solution. A multitude of countries and international organisations advocate proactive green belt policies19. Mangrove restoration and conservation are targeted20 by the UN Decade of Ecosystem Restoration 2021–203021, Sustainable Development Goals22, and Aichi Biodiversity Targets23. The global conservation community has committed to increasing mangrove cover by 20% in 203020,24. Prompt actions are critical given the close deadline of both targets in carbon emission reduction and mangrove conservation. Restoration efforts can be complex and require a set of systematic and structured stages consisting of planning, implementation, and evaluation25,26 including socio-cultural conditions27, land ownership20, along with cost-benefit analyses28,29, apart from a thorough understanding of the bio-physical dynamics of mangrove systems themselves.
Mangrove restoration strategies are site-specific and species-specific30, and their success often depends on the suitability of the site, species, and support from local communities31,32. Despite the increase in interest in nature-based coastal defences and the clear multiple benefits of restoring mangrove forest33,34, 80–90% of reported restoration projects experience failure26 where reasons for failure often remain unclear29,35. The leading bio-physical causes relate to a mismatch of mangrove species and poor understanding of the hydro-morphological system and other ecological elements26,29,36. Limited understanding is partly due to a non-existent baseline dataset on interventions and missing consistent observation over decades9,11,30. Nevertheless, mangrove planting remains a popular conservation practice37, as fast creation of mangrove belts by planting is mandated by law in several countries.
This study examines optimal restoration strategies by varying spatial mangrove planting configurations, to optimize the carbon sequestration potential, taking into account feedback from their tidal flat environment. Besides this potential carbon in above- and belowground biomass and soil, we use the mangrove area after restoration20 and potential mangrove extent trajectory as indicators for restoration success. Mangrove forests’ carbon and nutrient exchange is determined by factors at different scales, i.e., the local scale dominated by mangrove species composition, the regional scale influenced by geomorphological setting and hydrodynamics, and the global scale governed by its climate38. Of these factors, processes on local and regional scales are the primary determinant factors in influencing the import and export of materials39. For example, the presence of vegetation reduces sedimentation in tidal basins under sea level rise40.
To manage mangrove wetlands for targeted ecosystem services, a mechanistic understanding of mangrove-mudflat biophysical feedback is crucial41. Understanding this feedback requires an approach that allows us to investigate the spatial sediment distribution39 and material exchange38 in a mangrove-mudflat system on the local-regional scale. Predicting mangrove forest trajectories requires the inclusion of detailed physical-environmental scenarios42 with interactions of mangrove establishment-dieback and propagule dispersal43. To explore these physical-environmental feedbacks, we apply the mechanistic and spatially explicit mangrove-eco-morphodynamic model DFMFON44. DFMFON couples two modelling paradigms, i.e., the process-based hydro-morphodynamic model Delft3D-Flexible Mesh45 and the individual-based mangrove model MesoFON46. DFMFON describes mangrove-mudflat dynamics, including life-stage progression (mangrove establishment, growth, and mortality), and simulates the systems’ morphodynamic evolution conditioned by wave and tidal forcing, sediment dynamics, soil surface elevation change, and salinity. We applied this model to reproduce the mangrove extent and canopy height development along with the morphodynamic delta features in the Porong Delta, Indonesia44.
We applied the DFMFON model to an open, near-equilibrium accreting muddy coast setting47, characterized by a typical mudflat slope of 1:1000 below mean sea level (MSL) and convex upward profile in the upper elevation48. These environmental settings47 represent typical characteristic of suitable habitats25,26 for mangrove restoration. The forcing conditions in the model include a spring-neap tidal water level cycle, constant wave forcing, and constant sediment concentration at the seaward boundary force the open coast profile. These forcing conditions generate a near-equilibrium, landward sloping profile where high suspended sediment concentrations prevail at the intertidal flat, but tide-residual sediment transports remain negligible49. Seedlings, consisting of Avicennia marina and Rhizophora apiculata, two pioneering species commonly planted in restoration activities in Indonesia20,50,51are planted at 3 m distance intervals52,53 with a similar diameter at breast height positioned 130 cm above the soil surface elevation ((D_130)). The planting strategy resembles a reforestation or afforestation approach54 considering the existing guidelines25,26,55 do not propose a specific configuration of mangrove planting. We apply various configurations of mangrove placements (Table 1 and Fig. 1), including single patch (200 m) and multiple (100 m with 160 m gap) patches. The main objective is to explore the effective planting configuration to obtain the optimum ecological-morphological development, allow natural seedling dispersal, and eventually assess the biomass and soil organic carbon benefits. In each configuration, we place mangroves at a particular vertical level related to the tide (mean sea level, mean high water spring, and mean high water neap). Monitoring and maintenance after restoration are critical to assess and ascertain the effectiveness of the restoration26,29. In this case, we assume the monitoring period is similar to a typical engineering and carbon credit evaluation time scale of 20 morphological years. During this period, mangroves grow and generate propagules that are dispersed, settle, and develop into new mangroves in a feedback process with associated hydrodynamic and morphodynamic developments. The simulation will allow us to investigate hydrodynamic characteristics, morphological development, mangrove extent, and biomass development to quantify the potential for carbon sequestration. Detailed model configurations and process descriptions are available in the method section.
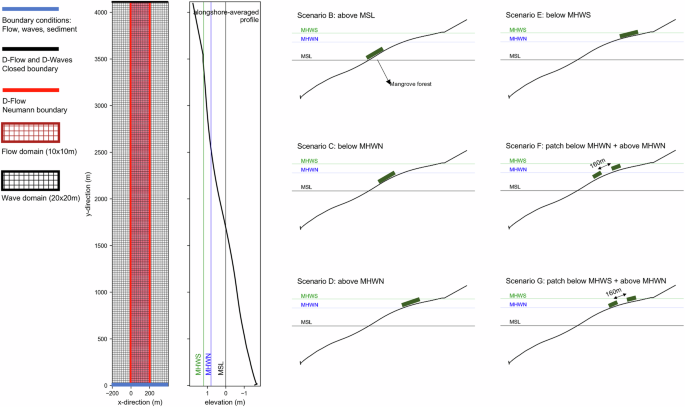
DFM model domain consists of flow and wave models in an online coupling. The illustration of the scenarios is not to scale. Details of the simulation setups are available in the supplement.
Results and discussion
Hydrodynamic characteristics and morphodynamic evolution
In the absence of mangroves, the mud profile continues to develop and accretes sediment with clear spring-neap tidal depositional signals near the boundary (Fig. 2), albeit at a very low rate. The introduction of mangroves has a clear impact on coastal morphology: The presence of mangroves promotes sediment deposition in the patch interior and erosion at the seaward fringe to a greater extent in scenarios B, C, and F and to a lesser extent in scenarios D and G. Scenario B even traps some sediment landward from the mangrove patch. Interestingly, the mangrove forests in the upper intertidal (above MHWN) promote a relatively high depositional rate in the interior. As shown in Fig. 3b, the presence of mangroves facilitates vertical accretion rate in the forest interior by up to two times compared to the no-vegetation scenario. The modelled mean accumulation rate in the mangrove interior is found to nearly correspond to the global average for undisturbed conserved mangrove56, about 3.6 ± 0.4 mm yr−1 (Fig. 3b), which illustrates that the model simulates a realistic sedimentation rate. Mangrove-induced drag can have an extended influence on reaching the seaward boundary close to the lowest tidal water level. The scenario with mangroves near MSL (B) shows profound erosion at the seaward fringe and deposition in the mangrove interior towards its landward surroundings. Higher, more landward mangrove planting decreases erosion near the fringe and tends to deposit sediment within the interior. Under those circumstances, mangroves drive the redistribution of sediment over the profile, causing the soil surface elevation to accrete until near the boundary seaward (Fig. 3b). For that reason, it indicates the extent of mangrove influences on morphology in this system. In scenarios with multiple vegetation patches, the morphodynamics patterns around the lower patch resemble the single-patch scenarios (Fig. 2). In most cases, the deposited volume in the mangrove patch located in the lower intertidal is even less than the eroded volume at the seaward portion of the fringe, suggesting the possibility of a negative impact on bare mudflat sediment stock by introducing mangroves.
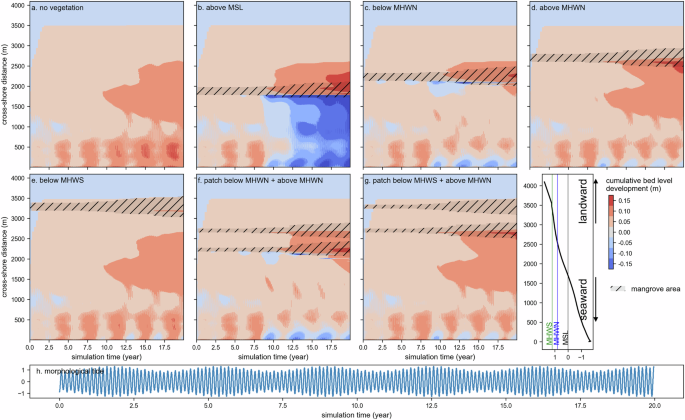
Panels a–g show the spatiotemporal cumulative soil surface elevation development in each scenario. The mangrove extent is shown as black hatches overlaying the soil surface elevation. Panel h shows the ocean boundary with morphological spring-neap tide forcing. The tidal datum is presented in the lower right of the panel, with MHWN at 0.8 m and MHWS at 1.2 m.
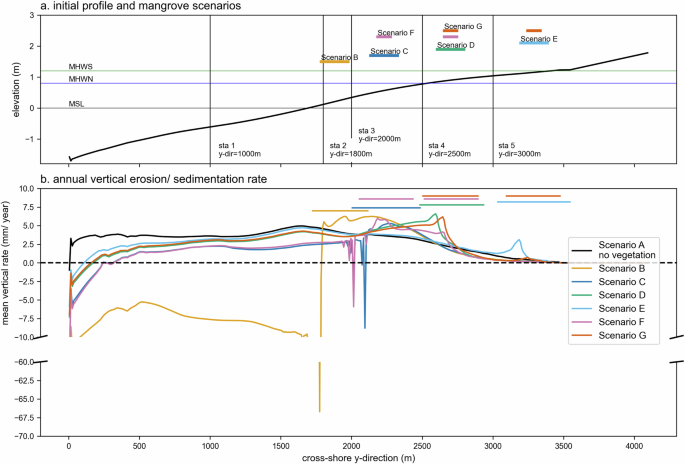
Panel a describes the initial profile, tidal levels, and scenario placement. The observation stations represent the seaward, fringe, and mangrove patch interior. The observation stations are arranged as follows: sta 1 at y-dir = 1000 m represents the offshore; sta 2 at y-dir = 1800 m represents the fringe for above MSL (scenario B); sta 3 at y-dir = 2000 m represents the forest interior of scenario B and fringe for below MHWN scenario C and F; sta 4 at y-dir = 2500 m represents forest interior for (scenario C and F) and fringe for above MHWN (scenario D and G); and sta 5 at y-dir = 3000 m represents the fringe for below MHWS (scenario E). We do not consider the forest interior of scenario E because it is close to MHWS and less frequently inundated. Panel b shows the annual alongshore average erosion/sedimentation rate (y-direction), mm/yr. The alongshore average yearly rate is calculated over the entire 20-year simulation period. Coloured lines above the graphs represent the extent of the mangrove forest after 20 years. Scenario line colours are consistent throughout the article.
The drag-inducing effect of the growing mangrove community is apparent and, therefore, influences the tidal asymmetry and the associated transport capacity. Together with fine sediment erosion and deposition lag effects, tidal asymmetry of water levels and velocities influences tide-residual sediment transport, where a slight asymmetry can result in a large net influx of sediment into the forest over a tidal cycle57,58. To explore these effects, Fig. 4 shows tidal stage versus velocity plots for the entire 20-year simulation period. The observation stations are selected to represent the tidal stages at the mudflat, the fringe, and the mangrove patch interior of each scenario.
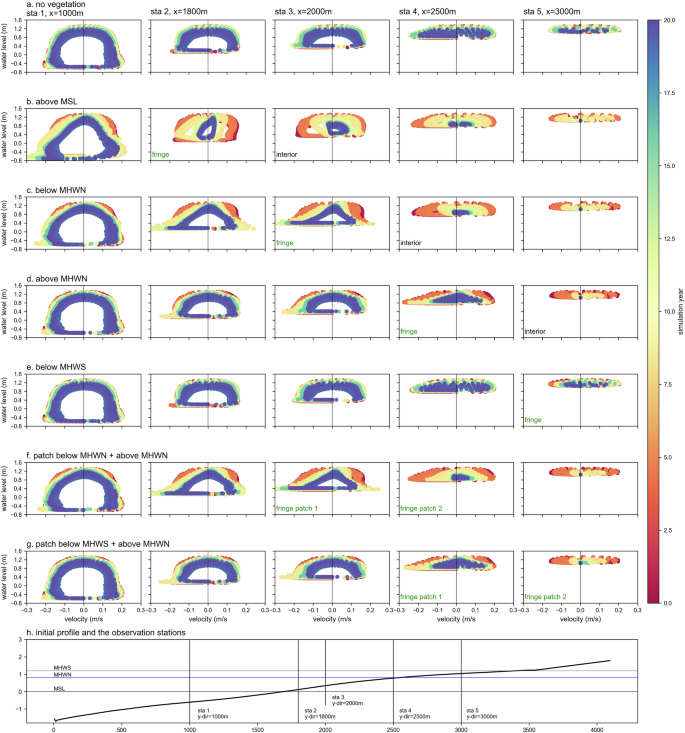
Panels a–h show the evolution of the cross-shore averaged tidal stage over simulation time, where water velocity (m/s) is plotted against water level (m) at 5 different observation stations of each scenario during spring tide. The plots show the evolution of the tidal stage for each scenario over the simulation period of 20 years with a colour palette ranging from red for year 0 to yellow for year 10 and blue for year 20. Observation stations on the initial profile are described in panel (h). Velocities are positive in the landward (flood) direction.
Near-equilibrium conditions prevail in the bare mudflat scenario A (Fig. 4a) where the velocities are similar along the entire profile during the tidal cycle, with a slightly larger flood velocity, indicating an accretive system. Figure 4b–g clearly illustrate the reinforcing effect of drag induced by growing mangroves on the tidal asymmetry. The systems become flood-dominated (larger flood velocity) in the mangrove forest interior and ebb-dominated (larger ebb velocity) at and seaward the fringes. Water levels and velocities are lower in and landward of the mangrove patches. These effects become more assertive when mangroves grow in size and colonize more areas. On average, mangroves start to substantially affect the hydrodynamics once they have passed 10 years.
Mangroves induced drag that limits flow and attenuates waves favouring sediment deposition in the forest interior7,59. Larger pressure gradients drive larger sediment fluxes during the flood. During ebb, a pressure gradient develops when water levels at the mudflat drop faster than in, and landward of, the mangrove patches. High friction delays the flow when ebb water drains, maintaining relatively high water levels in the patch interior. Turbulence from breaking waves enhances sediment resuspension, particularly during the low water near the fringe in the seaward direction. The increased bed slope and pressure gradient at the fringes lead to larger ebb velocities, favouring further offshore sediment transport. This pattern is consistent with previous observations and modelling studies, e.g., Van Maanen et al.60 and Bryan et al.61. Denser and larger-diameter mangrove populations enhance this effect. The effect of mangrove-induced drag on tidal asymmetry is valid in all scenarios regardless of the position of mangrove forests relative to MSL. In the case of multiple patches, the most seaward-located patch governs the mechanism. Under similar conditions, mangroves situated at higher elevations have less pronounced effects. Particularly for patches above MHWN, the transition from peak flood in the interior to lower ebb in the seaward or the other way around during flood is relatively short. Thus, the findings in our simulations support previous studies, which show that the sediment accumulation rate was greater near the fringe than in the interior.
The model results show a strong correlation between the position of mangroves relative to MSL and sediment deposition. Mangroves between the mean high-water spring (MHWS) and the mean high-water neap tidal elevation (MHWN) tend to favour deposition. In contrast, mangroves between MHWN and mean sea level (MSL) tend to induce scarp erosion at the seaward fringe edge. In contrast, scenarios featuring patches closer to MSL have a more pronounced scarping effect. This is attributed (a) to a larger, landward-located water volume that needs to be drained, (b) to faster-lowering water levels during ebb at elevations closer to MSL, and (c) to associated larger pressure gradients within the mangrove interior. Such pronounced fringe edge erosion has likewise been observed in field studies of mangrove environments62,63. The supplement presents additional numerical experiments on morphostatic profiles that explain this effect in more detail.
Mangrove biomass development
Scenarios with mangroves planted in two patches with a gap and above high water neap exhibit the highest biomass and widest extent. We observed a pronounced sensitivity of the canopy cover area (Fig. 5) and number of trees (Fig. 6) to mangrove placement. The final cover area can vary by a factor of two between mangroves located at the low water level and those placed at the high water spring level. This striking difference is attributed solely to the initial mangrove patch position relative to MSL. The maximum cover area is achieved in scenario G (patches below MHWS+above MHWN) followed by scenario F (patches below MHWN&above MHWN) (Fig. 5). The canopy area evolution can be divided into three distinct phases: During the first period until year 5, patched scenarios cover slightly larger areas than the single block scenarios. Next, between years 5 and 10, trajectories diverge depending on bed elevation within the two planting scenarios (single vs. multiple patches). As the community grows older, the higher soil surface elevation provides a shorter hydroperiod and less energetic wave conditions, enhancing the probability of seedling establishment. We simulate this process using the conceptual model of the Window of Opportunity (WoO)64, defined as the minimum disturbance-free days,the critical period to let the seedling’s root securely anchor in the soil. Once the parental trees have released the propagules, we estimate the dispersal to depend on the averaged current magnitude and direction, which is equal to two weeks of the morphological simulation period. This period considers the phase of obligate dispersal to achieve early anchorage in Avicennia sp. and Rhizophora sp.43 where the propagules will be distributed following the prevailing currents. We evaluated the seedling establishment in the model on the local inundation frequency, which requires 3 inundation-free days for Avicennia sp. and 5 days for Rhizophora sp.43. In addition, the model also distinguish the seedlings’ failure to settle due to uprooting and burial, described in more detail in the methods section. Since the competition remains low, mangroves grow optimally, resulting in a larger extent than those located lower on the profile, featuring less favourable conditions for establishment and growth. After 12.5 years of growth, leveraging the advantage of being in a higher topographical position, the canopy area in scenario C, located below MHWN, surpasses that in scenario B, where the patch is situated above MSL. The slightly better WoO due to lower inundation frequency in scenario C provides a relative advantage, which becomes more apparent when the species initiate propagule production. The improved window of opportunity increases the probability of stranded propagules surviving and growing into saplings. Therefore, scenario C contains a higher number of trees (Fig. 6) and a wider canopy cover than scenario B. Overall, mangrove placement at particular levels on the topographic profile exerts a strong influence on the number of trees in the community after 20 years. Mangrove communities located below MHWS are the largest in size, and community sizes tend to decline in the order: scenario above MHWN, below MHWN, and above MSL. Patchiness offers a clear advantage as tree numbers in those planting scenarios surpass those in single block scenarios after years 12.5–15.
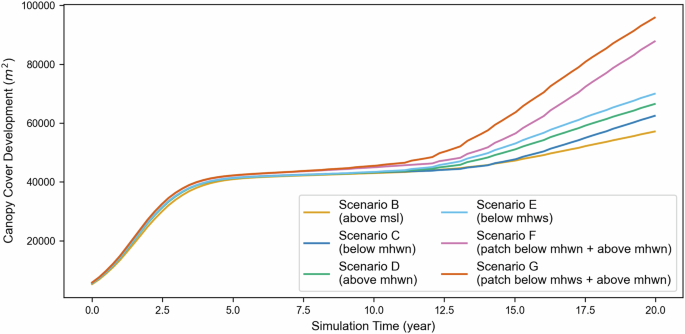
Development of canopy cover area over 20 years in different planting scenarios.
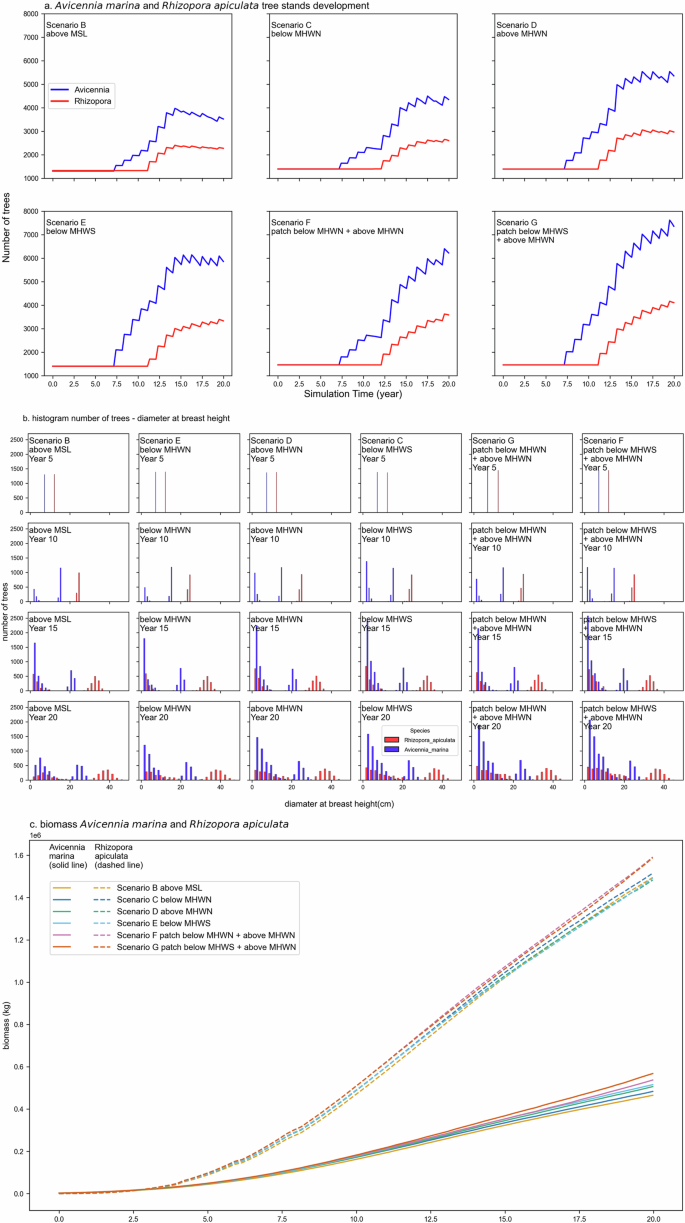
a Mangrove populations’ (number of trees) development in space-available case. This plot captures each species’ aggregated mangrove tree population over the simulation period. b Distribution of mangrove diameter at breast height ((D_130)) in cm every 5 years for Rhizophora apiculata (red bars) and Avicennia marina (blue bars). Propagules are produced when the tree has reached the flowering stage, with species-specific propagule density per crown surface area. c Overall biomass over the 20 years simulation period for the two-competing species Avicennia marina (solid line) and Rhizophora apiculata (dashed line). Biomass (kg) was calculated following the approximation by Comley and Mc Guinness 110 for Avicennia marina, Kauffman and Cole 111 and Ong et al. 112 for Rhizophora apiculata as in Murdiyarso et al. 68. Biomass content in the plot is the sum of all mangrove species individuals on each time stamp.
Canopy cover area development represents the top of the canopy and, therefore, corresponds to the behaviour of the tallest stands44. The development of species-specific number of trees, as shown in Fig. 6a provides additional insight into whether the mangrove community is declining, expanding, or heading towards (dynamic) equilibrium by including all life stages in the community.
Until generative reproduction commences within the first 5 years, the number of trees remains constant across all scenarios (Fig. 6a). Although Avicennia marina grows more slowly in biomass than Rhizophora apiculata65, it has a higher seedling production rate66 Additionally, Rhizophora apiculata propagules require a longer inundation-free period to settle than Avicennia marina. This causes the Avicennia marina population to dominate the forest regarding the number of trees.
As illustrated in Fig. 6a, b, after 15 years, the mangrove community in all single-patch scenarios stabilizes gradually. An exception is the scenario above MSL (scenario B), which shows a decline after year 12 in the Avicennia marina population and a transition to a steady number of Rhizophora apiculata trees. In contrast, the number of trees in the two-patches scenarios continues to rise. The increase in the number of trees in Fig. 6a reflects an expanding mangrove forest or a less competitive environment with more younger mangrove trees established. Conversely, a decrease in tree numbers indicates a more competitive mangrove forest, with high juvenile mortality and more growth of the mature trees or a more potent signature of the self-thinning mechanism. Despite the slower growth rate of the Rhizophora apiculata population, the increasing trend for all species is quite similar. Seedling mortality in the mangrove community is mainly controlled by the inundation period, where the hydro-morphodynamic feedback by the expanding and denser forest lowers the WoO. In the first 10 years, the biophysical properties (surface area, density, and (D_130)) of the mangrove forest have only a minor effect on hydrodynamics, leading to a negligible influence on morphodynamic development (Figs. 2 and 4). Under these conditions, the WoO is lower at the seaward fringe and higher towards the interior and landward fringe. After 10 years, the increased mangrove density and (D_130) cause higher friction, leading to tidal asymmetry and pressure gradient. This tidal asymmetry delays the interior water level, extending the inundation period and preventing propagule establishment. The increased velocity induced by the pressure gradient moves propagules from the seaward fringe offshore, reducing seedling establishment. As a result, the number of trees remains static, with no colonization occurring at either the seaward fringe or the interior. In contrast, scenarios with multiple patches continue to produce viable saplings in both colonization areas: the seaward fringe at the upper patch and the landward fringe at the lower patch. Plots of WoO and propagule production on observation plots are provided in the supplement.
Although Rhizophora apiculata has a smaller population size, the mean diameter of mature trees at the upper end of the diameter distribution is substantially larger for Rhizophora apiculata than that for Avicennia marina (Fig. 6b). We observe a dominance of the large Rhizophora apiculata population after year 10. However, given that Avicennia marina produces more propagules, we find an equivalent number of juveniles across all scenarios. In years 15 and 20, the dominant distribution of (D_130) <5 cm trees in Avicennia marina demonstrate its dominance in seedling production. During this period, the surviving population from year 15 shifts into the (D_130) >30 cm category in year 20. This histogram illustrates that two-patch scenarios consistently have a wider distribution of tree diameters. All single-block scenarios experienced a decreasing number of juveniles, with scenario B having the lowest number compared to the patched scenarios. This indicates that the community will be dominated by mature trees with high competition.
Rhizophora apiculata (dashed lines) has developed a considerably larger biomass from year 2 onwards (Fig. 6c), similar to the observation by Berger and Hildenbrandt65. In contrast, Avicennia marina lags behind in biomass, as juveniles dominate the diameter distribution (Fig. 6b). Once again, scenarios with multiple patches and gaps produce more biomass due to their wider extent (Fig. 2) and higher number of trees (Fig. 6a). Beyond 20 years, the higher WoO in multiple patches scenarios leads to lateral expansion due to colonisation, higher survivability of juveniles progressing into mature trees, and ultimately higher biomass capacity.
Carbon mitigation capability and potential
We estimate potential mangrove carbon (C) stock in three carbon pools: a) aboveground biomass carbon (AGC) represents all living parts of vegetation above the soil, including stem, branches, foliage, part of stilt roots (R. apiculata), and pneumatophores (A. marina), b) belowground biomass carbon (BGC) represents biomass of belowground roots below the soil surface67, and c) soil organic carbon (SOC) which is the change in carbon accumulation due to the modelled cumulative erosion/sedimentation. We assume that sediment imported from the seaward boundary contains organic matter with 10% carbon content, in accordance with values reported for observation projects in Indonesia68,69. The carbon content was derived from 1m-depth sediment core samplings characterized by abundant fibrous roots and occasional shell fragments, in which the detritus contribution would be captured in the observation. The schematized domain corresponds to an accreting coastal system that feeds on the mud of riverine origin transported alongshore, where the allochthonous sediment dominates in-situ carbon burial. The methods section explains the estimation of AGC, BGC, and SOC.
Figure 7 shows that, in line with findings in the previous section, all scenarios below the level of MHWN show a reduced soil organic carbon accumulation compared to the no vegetation case (scenario A). Scenarios with all combinations situated above MHWN (scenarios D, E, G) accumulate more sediment than scenario A. Scenario D (above MHWN) and Scenario E (below MHWS) surpasses scenario A after year 10. At the end of the simulation, the two-patches scenario with a combination above MHWN and below MHWS (scenario G) has the highest SOC. Interestingly, although all two-patches scenarios have the largest canopy area, scenarios with a combination situated below MHWN (scenario F) feature less SOC than scenario A. Scenario B (above MSL) has the smallest amount of net SOC accumulation, almost vanishing near the end of the simulation. The SOC accumulation rate is quite similar in all scenarios. However, all scenarios below MHWN reverse their response pattern in year 10 and regain sediment afterward (Fig. 7), whereas only SOC in scenario B keeps decreasing.
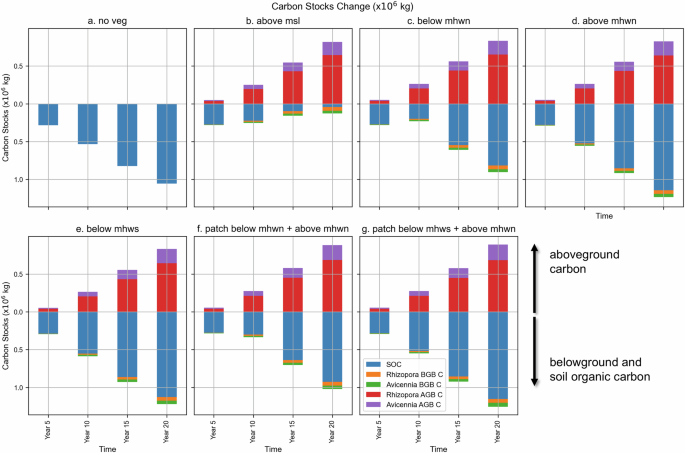
Simulated carbon stock changes from three carbon pools (living vegetation above- belowground and soil organic carbon). The y-axis shows the value of carbon stocks changes (in 106 kg) with positive values in both directions, where a value above zero represents aboveground carbon and below zero represents belowground and soil organic carbon. Above and belowground biomass carbon are estimated based on the mangrove species properties. Soil organic carbon is estimated from cumulative sediment volume changes from the whole model domain. Figure panels provide the carbon stock changes for scenarios a no vegetation, b single patch planted above mean sea level, c single patch planted below mean high water neap, d single patch planted above mean high water neap, e single patch planted below mean high water spring, f multiple patches planted below and above mean high water neap, and g multiple patches planted below mean high water spring and above mean high water neap.
We calculate carbon stock changes for the carbon pools modelled above. All scenarios show an increase in carbon stock over time. However, scenario B has reached its limit within 20 years for the SOC due to soil loss by erosion. In comparison, scenarios below MHWN have apparently reached a saturated carbon content in living biomass after 20 years (AGC-BGC contribution). Interestingly, two patches scenarios are still in an expanding trend, where they have a chance to sequester more carbon until the forest reaches maximum mangrove community density, depending on the forest composition65. It shows the benefit of strategically providing a less competitive environment and colonization space to allow for larger successful landward seedling establishment.
Our simulations suggest that SOC is the highest contributor among the carbon pools for all scenarios. The SOC content exhibits a significant difference where scenarios above MHWN accumulated more, due to mangroves-induced drag and sediment trapping efficiency. Recent studies3,54,70,71 mention SOC is largest contributor to the total ecosystem carbon stock. However, it is essential to note that the SOC’s source in those studies is majorly of autochthonous origin, where we assume the availability is still limited within our domain. Additionally, our modelling exercise resembles mangrove afforestation within 20 years after planting, in which allochthonous carbon prevails54,72. Scenario B represents an exception due to its deep scarp erosion pattern and the reversal of the rising SOC trend after year 10. Planting above MHWN in general stores 10% more soil organic carbon, whereas the below MHWN scenarios always underperform in comparison to the scenario without a restoration attempt.
Consistent with Fig. 6c, there is no substantial difference in the biomass carbon pools among scenarios as shown in Fig. 7. The finding in biomass carbon seems inconsistent with the findings of the previous section, i.e., a twofold increase in canopy cover (Fig. 5) and a clear rise in tree number (Fig. 6a). The number of trees-diameter histograms can explain this phenomenon in Fig. 6b. The younger trees dominate the community of the forest with (D_130) <5 cm. This is particularly evident when the community exceeds the age of 10 years. Although the younger trees are dominant in number, the total biomass is dominated by the contribution of surviving first-generation trees.
By the end of year 20, the potential total carbon benefit ranges from 64% (scenario C) to 103% (scenario G) increase compared to the scenario without restoration. The scenarios above MHWN consistently accumulate more carbon, gaining above 94% increase in carbon potential. The below MHWN scenarios can only achieve a maximum of 80% carbon (details are provided in the Supplementary 3). Considering that mangroves for scenarios above MHWN still show expansion, this subtle placement difference would potentially sequester more in the biomass pool when the mangrove community reaches maturity. The two-patches strategy helps to gain more carbon in comparison with a single and lower patch, i.e., Scenario G (patch below MHWS + above MHWN) vs Scenario E (above MHWN) and Scenario F (patch below MHWN + above MHWN) vs Scenario C (below MHWN). Although the lower patch in the two-patches strategy has similar hydrodynamic characteristics as the single patch at the same elevation, the gap allows sediment to settle, distributing the sediment along the gap and interior, thus increasing the soil surface elevation. The patches practically increase the probability of the seedlings establishing and expanding in the seaward direction of the upper patch and the landward direction of the lower patch. Consequently, the scenarios of higher WoO, higher propagules production, and less energetic environment allow two-patches scenarios to sequester more carbon than single patch strategy, thus providing a higher climate change mitigation potential. This study provides an evidence-based restoration practices, with a conservative estimate excluding the contribution of autochthonous carbon pools that is relatively small for an afforestation project like this setting70, but would be dominant in natural mangrove forests70,71
Implications for mangrove restoration management
Most studies link tree species to carbon sequestration potential73,74 or focus on the optimisation of restoration strategies in terms of ecology26,75, intervention approach76, species type(s)77, geomorphic settings78, or planting density79. These studies typically cover a large spatiotemporal scale, i.e., minimum at the forest scale, where gradual and slow changes occur. However, the restoration effectiveness and potential carbon sequestration are also related to the successful establishment43,80, tied to a short spatiotemporal scale81. This implies that smaller-scale processes need to be included to understand the system’s behaviour on a larger scale82. Our modelling results show that a fractional modification, such as strategic placement on a specific elevation with respect to tidal levels, provides a disparate outcome. Whilst many guidelines have provided detailed implementation of mangrove restoration, the analysis on predictive mangrove forest trajectories and carbon stock potential remains lacking. The knowledge gained in our modelling experiments can provide a quantitative indication of restoration pathways during the feasibility assessment or midterm adjustment. It is deemed necessary, especially given the changes in physical-environmental drivers, for instance due to climate change, requires mechanistic understanding of mangrove-mudflat biophysical feedback5,38,39.
The simulations reveal that assessing restoration success should not only be evaluated in terms of large mangrove extent or the potential biomass, particularly if the monitoring period after restoration is limited in time, which we assume is similar to a typical engineering time scale (20 years). As such, morphological development, referred to as SOC accumulation, is the sensitive yet potentially influential parameter demonstrated in this work. For instance, scenario B (above MSL) indeed has the lowest extent (Fig. 5) and the smallest number of trees (Fig. 6a). Nevertheless, the amount of simulated biomass carbon does not significantly differ from other scenarios (Fig. 6c). Our study suggests successful mangrove restoration should not be seen exclusively from biomass carbon accumulation, as it can be a false positive. For example, Fig. 7b shows that the total carbon stock can be even lower than in the no vegetation scenario due to soil loss and the associated soil organic carbon stock. The results indicate the importance of efficient mangrove placement in restoration works to avoid counterintuitive results, where positioning the planting above high water neap elevation promotes sediment deposition, increases seedling establishment probability, and increases the associated carbon stock capacity.
Notably, mangrove restoration is now becoming a global trend, following a global slowdown of forest loss24,35. Mangrove restoration can be a potential solution pathway for climate change mitigation when restoration failures are minimized. In this study, we demonstrate the possibility of modelling predictive behaviour of mangrove forests following their placement and the changes in carbon stocks. From the perspective of mangrove restoration projects, it can potentially reduce the cost by strategically planting the seedlings and avoiding excessive trial-and-error, enhancing outcome predictability and cost-effectiveness of mangrove restoration.
The findings suggest focusing on mangrove restoration in the high water neap elevation in the initial project implementation, supporting the past reports that most failures occurred in the lower intertidal zone25,36. As the intertidal flat has been experiencing rapid loss and degradation in a multitude of scales83, the conservation strategy should consider positive sediment accumulation and improvement of mangrove-mudflat connectivity84. We observed stable tree-number distributions and a consistent pattern of biomass production after year 15. The restored or created wetlands require, on average, 30 years to recover to pre-disturbance forest structure. However, the recovery state in ecosystem structure and function remains lower than reference state85. The recovery state period would also depend on spatial scale and specific indicators, such as the wetland’s hydrologic, biological, or biogeochemical characteristics. These conditions emphasize the need for monitoring to guide whether the objectives have been achieved or adaptive actions are required to be implemented.
Guidelines25,26,55 suggest monitoring is mandatory after the restoration project has commenced, with a minimum period of five years with a focus on assessing the success of seedling establishment and tree recruitment. At the same time restoration is a long-term effort and 10+ years of monitoring would be preferred. Our findings show distinct forest trajectory developments, in particular after 15 years of forest growth. We suggest monitoring an undisturbed restoration project that can be conducted at least within 20 years, as our findings corroborate. This way, we can assess tree recruitment, species composition, changes in forest structure, and morphological development. Additionally, selecting a 20-year operation and monitoring period is feasible to implement, following the current standard in engineering projects. Although a mangrove’s lifetime can take more than a century, based on our modelling experiment, a 20-year period is adequate to represent life stages, near optimum mangrove structure, and the quasi-equilibrium mangrove-mudflat biophysical dynamics. Our findings corroborate with observations by Salmo et al.86, who shows that the ecological characteristics of restored mangroves would stabilise after 11 years and resemble natural forests after 25 years.
Literature mentions a potentially substantial effect of large, infrequent disturbances, e.g., storms or tsunamis, on the development trajectory of mangrove ecosystems87,88. A combination of storm surge waves and wind defoliates the canopy and potentially topples the trees, altering the forest’s structure and composition. Intense storm surges and currents transport and redistribute sediment along and in the interior of the mangrove coast, changing the sediment properties and affecting local salinity. The changes in local topography and fallen tree debris will disrupt the mangrove wetland’s hydrological regime. Depending on the degree of the damage to the forest’s structural-compositional attributes, these events can lead to dieback and delayed recovery at various rates87,89,90. Thus, the forest trajectories will be temporarily interrupted or reset. Given the large variation of recovery and dependencies on local habitat conditions after a storm, it suggests the need to investigate tailored restoration techniques89 conducive to accelerating the recovery after a large disturbance. In this situation, readjustments of the conservation strategy can benefit from the lessons learned55,88 and quantitative ecosystem models, as applied in the current study. Additionally, low energetic wave conditions also contribute to successful mangrove establishment91. We parameterized this effect in a proxy of critical erosion and burial threshold. In future work, it will be worthwhile to explicitly investigate the effects of disturbance from wind and waves on seedlings’ survivability.
Methods
Coupled mangrove-hydro-morphodynamic model
Mangroves thrive in a dynamic coastal environment at the wedge of high and low water. In response, mangroves need to interact and provide feedback with multiple physical-environmental drivers, i.e., nutrient availability, salinity, and sea level/hydroperiod8,46. The interactions with these drivers will affect their growth, dieback, and species distribution, determining the productivity and the extent of the mangrove ecosystem. The interactions occur at different spatiotemporal (habitat, ecological, and geomorphological scales) and life stages (propagule, seedling, sapling, and mature). Any disturbances at each hierarchy would alter the higher hierarchy and cascade into the ecosystem level92. In turn, it affects the interactions and traits of the abiotic-biotic factors at the lower level. For instance, the rise of ecosystem-scale sea levels affects the hydroperiod and the related morphological development. The changes in soil surface elevation variation will alter seedlings’ establishment and thus affect the mangrove stands competition, changing the mangrove community structure93. Therefore, we apply a hierarchical approach92 to describe mangrove dynamics and the feedback loop based on their ecological (local) and geomorphological factors.
The spatially explicit interactions between hydro-morphological processes and mangrove dynamics are simulated with DFMFON44, a coupled individual-based mangrove MesoFON46 (MFON) and landscape-scale hydro-morphodynamic Delft3D-Flexible Mesh45 (DFM) model, resolving local-scale to landscape-scale, respectively. The coupled model resolves the feedback loop between the short-term changes in local abiotic factors (i.e., flow, sediment availability, waves, and salinity) and the long-term bio-geomorphic mangrove forest dynamics. These interactions occur and are modelled within each life-stage of the mangrove tree (propagule, seedling, sapling, and mature), including short-/long distance propagule dispersal. DFM translates mangrove biophysical characteristics as the bulk drag coefficient at each time step, affecting the hydro-morphodynamics. The simulated DFM variables (water level, salinity, and soil surface elevation) are defined as mangrove stressors to update mangrove stands in MFON every 90 morphological days. The 90-day interval was chosen to realistically incorporate mangrove reproduction (e.g., flowering, fruiting, and seedling production) while keeping the wet and dry seasonal climate forcings.
Mangrove individual-based model
The individual-based mangrove model MFON aims to simulate individual mangrove development based on the tree-to-tree competition and variation of environmental conditions, i.e., salinity and nutrient availability. The competition routine is based on the Field of Neighbourhood (FON) approach65, which defines the strength of influence of one tree upon another as dependent on the radius of competition, either above or below ground, related to the tree’s stem diameter. Mangrove growth is governed by the level of competition for resources and is limited by salinity. Mortality will occur in case of no growth in (D_130) for 5 years and local disturbance events. Tree recruitment and establishment are processed by the DFMFON routines, which take into account the physical stresses from hydrodynamics simulated in DFM. During the seedlings’ production period, the two-week averaged flow pattern is captured and used to estimate propagule dispersal. The selected period aligns with the generally observed obligatory two-week dispersal period44. Parental trees are parameterized to produce a number of propagules (left(Nright)) during the peak of wet season in January, following the observation in Porong Mangroves94. The propagules’ production is dependent on the crown surface area ((A)), reduction factors due to sanity ((f_red,sal)) and nutrient ((f_red,P)), with the species-specific seedling density per crown surface area (left(Dright)). (D) is assumed to have a value of 0.06(m^-2) whereas the (f_red,P) is held constant at the value of 166, please refer to the supplementary information for a complete description on the propagule production. Once the parental trees have released the propagules, we estimate the dispersal to be dependent on the averaged current magnitude and direction, which is equal to two weeks of the morphological simulation period. This period considers the phase of obligate dispersal to achieve early anchorage in Avicennia sp. and Rhizophora sp.43 where the propagules will be distributed following the prevailing currents. The successful establishment of the dispersed propagules is evaluated following the local inundation frequency, applying the conceptual model termed Window of Opportunity (WoO)64, while also taking into account seedlings’ burial and toppling due to hydrodynamics95. WoO is parameterised from species-specific inundation-free days as the critical period to let the root securely anchor in the soil. The WoO threshold for Avicennia sp. is defined as 3 inundation-free days, based on an experiment conducted by Balke et al.91. For Rhizophora sp., we used Watson’s hydrological classification96 that was derived for Malaysian mangroves and has been improved for varied tidal regimes based on studies in South East Asian Mangroves (Indonesia and Vietnam) in the study by van Loon et al.97. Rhizophora sp. is classified as hydrological class 3 with 100−200 min per inundation, while Avicennia sp. is in successional class 2* with 200–450 min per inundation for successful anchoring of a seedling. Therefore, Rhizophora sp. requires an inundation-free duration of up to 2 times longer than Avicennia sp. Hence, we assume the WoO value for Rhizophora sp. is 5 days.
Hydro-morphodynamic model
An open-source hydro-morphodynamic DFM model is used in this study to simulate flow, sediment dynamics, and morphological processes. This model is set to solve the two-dimensional (depth-averaged) shallow water equations on an unstructured grid and is widely used in coastal and estuarine environments49,61,98. Wind-wave propagation is simulated using the D-Waves module in DFM45. D-Waves is based on the SWAN spectral wave model, which is capable of simulating the evolution of short-crested, random wind waves in coastal areas. The D-Morphology45 module in DFM is activated to solve the suspended sediment transport in the muddy coast by solving the advection-diffusion equation and applying the Partheniades-Krone formulation to estimate erosion and deposition.
The mangrove resistance to hydrodynamics is represented in DFM using the modified Baptist predictor99 by separating vegetation-induced resistance (lambda) and bare bed roughness C in the momentum equation45 (Eqs. (1) and (2)). The Baptist equation is implemented considering the dependence on vegetation height (h_v) (m), density (n) (number of trees/m2), bulk drag coefficient (C_D), and unvegetated bed roughness (C_b) to water depth (h), with (kappa) being the dimensionless von Kármán constant, D the stem diameter (m), and g is the gravitational acceleration.
The (C_D) coefficient is assumed to be equal to the drag force exerted on mangroves, which is a function of the projected area ((A)) and the submerged mangrove biomass ((V_M)) in a control volume ((V)). The (C_D) predictor, following the formulation by Van Maanen et al.60 is defined in Eq. 4. (C_D) is calculated as the sum of the total drag coefficient on the bare surface (C_D,no), with a value of 0.005, and the ratio between the dimensional constant (e) set at 5 m and the vegetation length ((L)). These coefficients were defined to attain a realistic bulk drag coefficient. Vegetation length depends on species-specific mangrove root geometries varying over the water depth.
The obstacle volume (V_M) depends on species-specific geometry and water depth. For instance, even at the same water depth and with the same (D_130), (V_M) of Avicennia sp. is different from that of Rhizophora sp. Primarily, the distinct root system of Avicennia sp. and Rhizophora sp., characterized by pneumatophores and stilt roots, respectively, account for this difference. Therefore, we partition (V_M) into the contribution by the stem and the roots. The stem is simplified as a truncated cone, with diameter at the soil surface elevation (D_0) and diameter at each water depth (D_w), following species-specific diameter-height allometric relationship. The contribution of mangrove rooting systems for Avicennia sp. for single pneumatophore is simplified as cones100 and multiplied by the maximum number of pneumatophopore (n), derived from the tree’s (D_130). Rhizophora sp. stilt roots morphology is characterised following the Ohira stilt root model101, considering the tree shape factors, i.e., (D_130), root height ((H_R)), number of roots ((N_R)), root diameter ((Phi _R)), angle between the root and the level line at shoot point ((theta)), and root-spread distance from the trunk to the root edge ((x_2)). The details on (V_M) calculation can be found in supplement.
Model configurations
The muddy open coast setting is employed as a basis of the bio-geomorphic topology. In restoration efforts, this open coast topology is considered to have medium opportunity and less land-ownership conflict20. The scenario represents an active restoration approach25. It is assumed no abundant propagules are available in the surroundings, and a proactive attempt30 has been made to establish mangroves in previously unvegetated areas. The scenarios also take into account the use of mangroves as nature-based solutions for climate adaptation along with hybrid engineering applications. We schematised the domain as a seawall or levee in located at the landward end at an elevation higher than the MHWS, demarcating a clear landward limit of accommodation space and a mangrove greenbelt seaward of it.
The overarching goal of the study is to investigate the optimum configurations of mangroves to achieve the maximum carbon stock accumulation. To this end, the simulation should ideally be carried out over the life span of the mangroves, which can be centuries65. However, the simulation period is set to be 20 years in order to consider any time-related organizational limits in the observation and monitoring of the restoration effectiveness and to enable a fair comparison with the application of hard structures. For comparison, in harvested mangrove forest, such as in West Papua, Indonesia102 or Matang Mangrove Forest in Malaysia103 the common harvest rotation is within 30–40 years intending to reach the optimum biomass production.
Intertidal mudflat
Here, the model is employed in a schematized way as the process-based model DFM retains the explicit causal mechanism in representing reality. We recognise that a schematised model may not ideally capture all processes and may simplify the system. However, the important and predominant variables included in the model reflect and reproduce the important features in the real system, as described in van der Wegen and Roelvink 104. The idealised model (Fig. 1) is constructed on a homogenous 10 × 10 m grid to capture the variation in mangrove stand changes to match plot dimension commonly used for mangrove survey51,105. This grid is arranged in a rectangular flow- and morphology-related domain with a width of 200 m in x-direction and a length of 4000 m in y-direction. The wave-related rectangular domain consists of a 20 m × 20 m grid and is dimensioned at 600 m × 4100 m (x- and y-direction). It is built coarser and wider to prevent boundary effects in the flow direction.
The bare intertidal flat in a degraded environment needs a long time to be recolonised naturally106. Human assistance in an attempt to improve hydrological conditions in mangrove wetland by restoring the sediment fluxes is being applied for instance in restoration projects in South East Asia47. Therefore, in the model, we parameterised it as an open coast with a typical mangrove mudflat47, on a 2D depth-averaged domain with a mudflat slope of 1:1000 below mean sea level, forced by spring-neap tides and single wave climate. The spring-neap tides are constructed with the morfacTide toolbox107 and are represented through fortnightly modulation of the semidiurnal tide of typical tidal forcing47 with MHWN of 0.8 m and MHWS of 1.2 m. A consistent narrow band of wind waves directed perpendicular to the shoreline is forced with a wave module in DFM, attaining a significant wave height of 0.2 m and wave period of 6 s. A sediment concentration of 0.03 kg/m3 is constantly supplied during the simulation period. The wave parameters and sediment concentration are typical of the muddy coast in the north of Java, Indonesia. The morphological update is accelerated with the morphological factor (MorFac) in DFM, which ranges from 30 to 100 in mangrove-salt marsh wetlands44,60,98. We run the initial linear intertidal profile for 120 years until it reaches the quasi-equilibrium profile, meaning the erosion-deposition rate is almost identical along the course of the simulation period. Following the series of sensitivity analyses, we applied a MorFac of 90 with a settling velocity of 0.0009 m/s, erosion parameter of 0.00007 kg/m²s, and critical shear stress for erosion ((tau _ce)) of 0.24 N/m². Detailed grid configuration and the complete set of model variables are presented in the supplement.
Mangrove restoration scenarios
In order to replicate assisted rehabilitation/planting attempts, we assume that only the initial seedlings survive the first planting phase and develop into saplings with homogenous (D_130). The initially planted mangroves have a tree height of 1.418 m (Avicennia marina) and 1.447 m (Rhizophora apiculata), in allometry to their biophysical characteristics ((D_130)). Once a propagule has been successfully established, the seedling always survives and develops into a sapling, with the tree height approaching breast height by the end of their first 2 years. This is in accordance with the mangrove growth function that is based on the (D_130) and the associated parameters. The restoration is defined on 200 m × 200 m and 200 m × 100 m grids, for single and multiple patches, respectively (Table 1). A widely applied technique in restoration by planting is to combine pioneering species, that are reported to have higher survivability37 and help increase diversity94. Therefore, the MFON model was calibrated for Avicennia marina and Rhizophora apiculata, two common pioneering species for planting distributed in Porong Delta, Indonesia and South East Asia, respectively54,94. The seedlings are planted on top of the barren intertidal flat soil, assuming to have a consistent optimum nutrient content. This is the limitation of the model, as the plantation age progresses, the organic matter, clay proportion, and salinity content in the unvegetated intertidal flats are likely to increasingly improve106.
Carbon stocks estimation
Several methods for estimating carbon accumulation in mangrove wetlands exist, such as the carbon crediting method108 used in the voluntary carbon market and carbon stocks accounting as in Kauffman et al.109. All of those approaches considered aboveground biomass (AGB), belowground biomass (BGB), SOC, and detritus, except carbon crediting method requires 100-year period of carbon total carbon stock estimation and conservatively excluding allochtonous soil organic matter. We applied Kauffman et al. (2020) approach as it allows for estimation of total carbon stocks considering the forest trajectory and soil morphodynamic. However, we did not count detritus and dead wood’s contribution to the SOC because their contribution is relatively small70 due to the limited availability in our system, and no empirical relationship to determine the magnitude in a dynamic way was found. We employed an allometric relationship of species-specific AGB and BGB for Southeast-Asian mangroves following Murdiyarso et al.68 and estimated carbon (C) with a multiplier of 0.47 and 0.39 for AGB and BGB, respectively68. We estimated SOC as a product of dry bulk density (kg m−3), cumulative change in soil volume (m3), and OC content. Although the bulk density and OC content vary with depth18, for practical estimation, we assume they do not vary across depth and horizontal space. Therefore, we assume a consistent organic carbon (OC) content across space and time. We used dry bulk density consistent with the hydro-morphodynamic model parameter (500 kg m−3), whereas we applied a median OC content of 10%. Both values are within the range reported in Murdiyarso et al.68 and Donato et al.18. With the assumption of the reduced carbon density in the seaward direction, the SOC is calculated from the point of mean sea level to the landward limit of the model domain. The C stocks presented here reflect the initial state’s carbon accumulation or carbon stock changes. Additionally, the substantial sediment loss in Scenario B resulted in negative carbon stocks in comparison to initial state, not allowing comparative analysis.
Reporting summary
Further information on research design is available in the Nature Portfolio Reporting Summary linked to this article.
Data availability
The entire model setup is provided in Zenodo data repository with this doi link: https://doi.org/10.5281/zenodo.15384988.
Code availability
The DFMFON model code used in this article is available as an open source project? at https://github.com/smbeselly/DFMFON.
References
-
Saintilan, N. et al. Widespread retreat of coastal habitat is likely at warming levels above 1.5 °C. Nature, https://doi.org/10.1038/s41586-023-06448-z (2023).
-
United Nations Environment Programme. Paris Agreement. (2015).
-
Macreadie, P. I. et al. Blue carbon as a natural climate solution. Nat. Rev. Earth Environ. 2, 826–839 (2021).
-
Mcleod, E. et al. A blueprint for blue carbon: toward an improved understanding of the role of vegetated coastal habitats in sequestering CO 2. Front. Ecol. Environ. 9, 552–560 (2011).
-
Duarte, C. M., Losada, I. J., Hendriks, I. E., Mazarrasa, I. & Marbà , N. The role of coastal plant communities for climate change mitigation and adaptation. Nat. Clim. Change 3, 961–968 (2013).
-
Howard, J. et al. Clarifying the role of coastal and marine systems in climate mitigation. Front Ecol. Environ. 15, 42–50 (2017).
-
Temmerman, S. et al. Marshes and mangroves as nature-based coastal storm buffers. Annu. Rev. Mar. Sci. 15, 95–118 (2023).
-
Krauss, K. W. et al. How mangrove forests adjust to rising sea level. N. Phytologist 202, 19–34 (2014).
-
Sharma, S. et al. Preface: Blue carbon studies in Asia-Pacific regions: Current status, gaps, and future perspectives. Ecol. Res. 37, 5–8 (2022).
-
van Wesenbeeck, B. K., de Boer, W., Narayan, S., van der Star, W. R. L. & de Vries, M. B. Coastal and riverine ecosystems as adaptive flood defenses under a changing climate. Mitig. Adapt Strateg Glob. Change 22, 1087–1094 (2017).
-
Macreadie, P. I. et al. The future of Blue Carbon science. Nat. Commun. 10, 3998 (2019).
-
Marois, D. E. & Mitsch, W. J. Coastal protection from tsunamis and cyclones provided by mangrove wetlands – a review. Int. J. Biodivers. Sci. Ecosyst. Serv. Manag. 11, 71–83 (2015).
-
Montgomery, J., Bryan, K., Horstman, E. & Mullarney, J. Attenuation of tides and surges by mangroves: contrasting case studies from New Zealand. Water 10, 1119 (2018).
-
Hamilton, S. E. & Casey, D. Creation of a high spatio-temporal resolution global database of continuous mangrove forest cover for the 21st century (CGMFC-21): CGMFC-21. Glob. Ecol. Biogeogr. 25, 729–738 (2016).
-
Almahasheer, H., Duarte, C. M. & Irigoien, X. Phenology and Growth dynamics of Avicennia marina in the Central Red Sea. Sci. Rep. 6, 37785 (2016).
-
The State of the World’s Mangroves 2022 (Global Mangrove Alliance, 2022).
-
Menéndez, P., Losada, I. J., Torres-Ortega, S., Narayan, S. & Beck, M. W. The Global flood protection benefits of mangroves. Sci. Rep. 10, 4404 (2020).
-
Donato, D. C. et al. Mangroves among the most carbon-rich forests in the tropics. Nat. Geosci. 4, 293–297 (2011).
-
UNFCCC. Secretariat. Nationally Determined Contributions under the Paris Agreement. Synthesis Report by the Secretariat (UNFCCC, 2021).
-
Sasmito, S. D. et al. Challenges and opportunities for achieving Sustainable Development Goals through restoration of Indonesia’s mangroves. Nat. Ecol. Evol. https://doi.org/10.1038/s41559-022-01926-5 (2023).
-
UN General Assembly. United Nations Decade on Ecosystem Restoration (2021–2030). A/RES/73/284 vol. A/RES/73/284 (UN General Assembly, 2019).
-
United Nations. The 2030 Agenda and the Sustainable Development Goals: An Opportunity for Latin America and the Caribbean (United Nations, Santiago, 2018).
-
United Nations. Convention on Biological Diversity (United Nations, 1992).
-
The State of the World’s Mangroves 2021. 2021st ed. (Global Mangrove Alliance, 2021). https://www.mangrovealliance.org/wp-content/uploads/2021/07/The-State-of-the-Worlds-Mangroves-2021-FINAL-1.pdf.
-
Teutli-Hernández, C., Herrera-Silveira, J. A., Cisneros-de la Cruz, D. J. & Roman-Cuesta, R. Mangrove Ecological Restoration Guide: Lessons Learned (CIFOR/CINVESTAV-IPN/UNAM-Sisal/PMC, Bogor, Indonesia, 2020).
-
Lewis, R. R. & Brown, B. Ecological mangrove rehabilitation a field manual for practitioner (Mangrove Action Project, Canadian International Development Agency, and OXFAM, 2014).
-
Dahdouh-Guebas, F. et al. Reconciling nature, people and policy in the mangrove social-ecological system through the adaptive cycle heuristic. Estuar., Coast. Shelf Sci. 248, 106942 (2021).
-
World Bank. The Economics of Large-Scale Mangrove Conservation and Restoration in Indonesia: Technical Report (World Bank, 2022). https://doi.org/10.1596/37605.
-
Ellison, A. M., Felson, A. J. & Friess, D. A. Mangrove rehabilitation and restoration as experimental adaptive management. Front. Mar. Sci. 7, 327 (2020).
-
Zimmer, M. et al. When nature needs a helping hand: different levels of human intervention for mangrove (re-)establishment. Front. Glob. Change 5, 784322 (2022).
-
Wilms, T., Goot, F. van der, Tonneijck, F., Nurhabni, F. & Sembiring, L. Building with nature approach. Building with nature to restore eroding tropical muddy coasts (Ecoshape International, 2021).
-
Winterwerp, J. C. et al. Managing erosion of mangrove-mud coasts with permeable dams – lessons learned. Ecol. Eng. 158, 106078 (2020).
-
Morris, R. L., Konlechner, T. M., Ghisalberti, M. & Swearer, S. E. From grey to green: Efficacy of eco-engineering solutions for nature-based coastal defence. Glob. Change Biol. 24, 1827–1842 (2018).
-
Temmerman, S. et al. Ecosystem-based coastal defence in the face of global change. Nature 504, 79–83 (2013).
-
López-Portillo, J. et al. Mangrove forest restoration and rehabilitation. In: Mangrove ecosystems: a global biogeographic perspective: structure, function, and services (eds. Rivera-Monroy, V. H., Lee, S. Y., Kristensen, E. & Twilley, R. R.) 301–345 (Springer International Publishing, Cham, 2017). https://doi.org/10.1007/978-3-319-62206-4_10.
-
Primavera, J. H. & Esteban, J. M. A. A review of mangrove rehabilitation in the Philippines: successes, failures and future prospects. Wetl. Ecol. Manag. 16, 345–358 (2008).
-
van Bijsterveldt, C. E. J. et al. To plant or not to plant: when can planting facilitate mangrove restoration?. Front. Environ. Sci. 9, 690011 (2022).
-
Adame, M. F. & Lovelock, C. E. Carbon and nutrient exchange of mangrove forests with the coastal ocean. Hydrobiologia 663, 23–50 (2011).
-
Adame, M. F., Neil, D., Wright, S. F. & Lovelock, C. E. Sedimentation within and among mangrove forests along a gradient of geomorphological settings. Estuar. Coast. Shelf Sci. 86, 21–30 (2010).
-
Boechat Albernaz, M., Brückner, M. Z. M., Van Maanen, B., Van Der Spek, A. J. F. & Kleinhans, M. G. Vegetation reconfigures barrier coasts and affects tidal basin infilling under sea level rise. JGR Earth Surf. 128, e2022JF006703 (2023).
-
Cahoon, D. R., McKee, K. L. & Morris, J. T. How plants influence resilience of salt marsh and mangrove wetlands to sea-level rise. Estuaries Coasts 44, 883–898 (2021).
-
Dahdouh-Guebas, F. et al. Cross-cutting research themes for future mangrove forest research. Nat. Plants 8, 1131–1135 (2022).
-
Van der Stocken, T. et al. A general framework for propagule dispersal in mangroves: A general framework for propagule dispersal in mangroves. Biol. Rev. 94, 1547–1575 (2019).
-
Beselly, S. M. et al. Modelling mangrove-mudflat dynamics with a coupled individual-based-hydro-morphodynamic model. Environ. Modell. Softw. 105814, https://doi.org/10.1016/j.envsoft.2023.105814 (2023).
-
Deltares. Delft3D flexible mesh suite: D-flow flexible mesh (Deltares, 2021).
-
Grueters, U. et al. The mangrove forest dynamics model mesoFON. Ecol. Model. 291, 28–41 (2014).
-
Winterwerp, J. C., Erftemeijer, P. L. A., Suryadiputra, N., van Eijk, P. & Zhang, L. Defining eco-morphodynamic requirements for rehabilitating eroding mangrove-mud coasts. Wetlands 33, 515–526 (2013).
-
Friedrichs, C. T. & Aubrey, D. G. Uniform bottom shear stress and equilibrium hyposometry of intertidal flats. In: Coastal and estuarine studies (ed. Pattiaratchi, C.) 50 405–429 (American Geophysical Union, 1996).
-
Wegen, M., Roelvink, J. A. & Jaffe, B. E. Morphodynamic resilience of intertidal mudflats on a seasonal time scale. J. Geophys. Res. Oceans 124, 8290–8308 (2019).
-
Sidik, F., Supriyanto, B., Krisnawati, H. & Muttaqin, M. Z. Mangrove conservation for climate change mitigation in Indonesia. WIREs Clim. Change 9, e529 (2018).
-
Beselly, S. M. et al. Eleven years of Mangrove–Mudflat dynamics on the mud volcano-induced prograding delta in East Java, Indonesia: integrating UAV and satellite imagery. Remote Sens. 13, 1084 (2021).
-
JICA-RECA. Panduan Teknis Restorasi Di Kawasan Konservasi -Ekosistem Mangrove Lahan Bekas Tambak-. (JICA-RECA, 2014).
-
Asian Development Bank. A community-based mangrove planting handbook for Papua New Guinea. https://www.adb.org/publications/mangrove-planting-handbook-papua-new-guineahttps://doi.org/10.22617/TIM189796-2 (2018).
-
Song, S. et al. Mangrove reforestation provides greater blue carbon benefit than afforestation for mitigating global climate change. Nat. Commun. 14, 756 (2023).
-
Best practice guidelines for mangrove restoration (Global Mangrove Alliance, 2023).
-
Pérez, A., Libardoni, B. G. & Sanders, C. J. Factors influencing organic carbon accumulation in mangrove ecosystems. Biol. Lett. 14, 20180237 (2018).
-
Hunt, S., Bryan, K. R. & Mullarney, J. C. The influence of wind and waves on the existence of stable intertidal morphology in meso-tidal estuaries. Geomorphology 228, 158–174 (2015).
-
Friedrichs, C. T. Tidal flat morphodynamics: a synthesis. In Coastal and Estuarine Research Federation, 21st Biennial Conference, 11 July 2011. Daytona Beach, FL (2011).
-
Horstman, E. M., Bryan, K. R., Mullarney, J. C., Pilditch, C. A. & Eager, C. A. Are flow-vegetation interactions well represented by mimics? A case study of mangrove pneumatophores. Adv. Water Resour. 111, 360–371 (2018).
-
van Maanen, B., Coco, G. & Bryan, K. R. On the ecogeomorphological feedbacks that control tidal channel network evolution in a sandy mangrove setting. Proc. R. Soc. A Math. Phys. Eng. Sci. 471, 20150115 (2015).
-
Bryan, K. R., Nardin, W., Mullarney, J. C. & Fagherazzi, S. The role of cross-shore tidal dynamics in controlling intertidal sediment exchange in mangroves in Cù Lao Dung, Vietnam. Continental Shelf Res. 147, 128–143 (2017).
-
De Dominicis, M., Wolf, J., van Hespen, R., Zheng, P. & Hu, Z. Mangrove forests can be an effective coastal defence in the Pearl River Delta. China Commun. Earth Environ. 4, 13 (2023).
-
Pelckmans, I. et al. Mangrove ecosystem properties regulate high water levels in a river delta. Nat. Hazards Earth Syst. Sci. 23, 3169–3183 (2023).
-
Balke, T. et al. Windows of opportunity: thresholds to mangrove seedling establishment on tidal flats. Mar. Ecol. Prog. Ser. 440, 1–9 (2011).
-
Berger, U. & Hildenbrandt, H. A new approach to spatially explicit modelling of forest dynamics: spacing, ageing and neighbourhood competition of mangrove trees. Ecol. Model. 132, 287–302 (2000).
-
Grueters, U., Ibrahim, M. R., Satyanarayana, B. & Dahdouh-Guebas, F. Individual-based modeling of mangrove forest growth: MesoFON – Recent calibration and future direction. Estuarine Coastal Shelf Sci. 106302, https://doi.org/10.1016/j.ecss.2019.106302 (2019).
-
Adame, M. F., Cherian, S., Reef, R. & Stewart-Koster, B. Mangrove root biomass and the uncertainty of belowground carbon estimations. For. Ecol. Manag. 403, 52–60 (2017).
-
Murdiyarso, D. et al. The potential of Indonesian mangrove forests for global climate change mitigation. Nat. Clim. Change 5, 1089–1092 (2015).
-
Kusumaningtyas, M. A. et al. Carbon sequestration potential in the rehabilitated mangroves in Indonesia. Ecol. Res. 37, 80–91 (2022).
-
Murdiyarso, D., Sasmito, S. D., Sillanpää, M., MacKenzie, R. & Gaveau, D. Mangrove selective logging sustains biomass carbon recovery, soil carbon, and sediment. Sci. Rep. 11, 12325 (2021).
-
Sasmito, S. D. et al. Organic carbon burial and sources in soils of coastal mudflat and mangrove ecosystems. CATENA 187, 104414 (2020).
-
Chen, G. et al. Soil Organic Carbon Sequestration after 20-Year Afforestation of Mangrove Plantations on Qi’ao Island, Southern China. Agronomy 13, 2389 (2023).
-
Aye, W. N., Tong, X., Li, J. & Tun, A. W. Assessing the Carbon Storage Potential of a Young Mangrove Plantation in Myanmar. Forests 14, 824 (2023).
-
Sahu, S. K. & Kathiresan, K. The age and species composition of mangrove forest directly influence the net primary productivity and carbon sequestration potential. Biocatalysis Agric. Biotechnol. 20, 101235 (2019).
-
SER (Society for Ecological Restoration Science and Policy Working Group). The SER primer on ecological restoration. Science & Policy Working Group 9, (SER, 2002).
-
Primavera, J., Rollon, R. N. & Samson, M. S. The pressing challenges of mangrove rehabilitation: Pond reversion and coastal protection. In Treatise on Coastal and Estuarine Science. (eds. Wolanski, E. & McLusky, D.) 217–244 (Academic Press, Waltham, 2011).
-
Bai, J. et al. Mangrove diversity enhances plant biomass production and carbon storage in Hainan island, China. Funct. Ecol. 35, 774–786 (2021).
-
Hatje, V. et al. Vegetated coastal ecosystems in the Southwestern Atlantic Ocean are an unexploited opportunity for climate change mitigation. Commun. Earth Environ. 4, 160 (2023).
-
Guo, P., Sun, Y., Su, H., Wang, M. & Zhang, Y. Spatial and temporal trends in total organic carbon (TOC), black carbon (BC), and total nitrogen (TN) and their relationships under different planting patterns in a restored coastal mangrove wetland: case study in Fujian, China. Chem. Speciat. Bioavailab. 30, 47–56 (2018).
-
Shih, S.-S., Huang, Z.-Z. & Hsu, Y.-W. Nature-based solutions on floodplain restoration with coupled propagule dispersal simulation and stepping-stone approach to predict mangrove encroachment in an estuary. Sci. Total Environ. 851, 158097 (2022).
-
Balke, T. & Friess, D. A. Geomorphic knowledge for mangrove restoration: a pan-tropical categorization: Geomorphic Knowledge for Mangrove Restoration. Earth Surf. Process. Landf. 41, 231–239 (2016).
-
Pretzsch, H. Forest dynamics, growth and yield: from measurement to model (Springer, 2009). https://doi.org/10.1007/978-3-540-88307-4.
-
Hill, N. K., Woodworth, B. K., Phinn, S. R., Murray, N. J. & Fuller, R. A. Global protected-area coverage and human pressure on tidal flats. Conserv. Biol. 35, 933–943 (2021).
-
Meijer, K. J. et al. Mangrove-mudflat connectivity shapes benthic communities in a tropical intertidal system. Ecol. Indic. 130, 108030 (2021).
-
Moreno-Mateos, D., Power, M. E., ComÃn, F. A. & Yockteng, R. Structural and functional loss in restored wetland ecosystems. PLoS Biol. 10, e1001247 (2012).
-
Salmo, S. G., Lovelock, C. & Duke, N. C. Vegetation and soil characteristics as indicators of restoration trajectories in restored mangroves. Hydrobiologia 720, 1–18 (2013).
-
Lagomasino, D. et al. Storm surge and ponding explain mangrove dieback in southwest Florida following Hurricane Irma. Nat. Commun. 12, 4003 (2021).
-
Silveira, J. A. H. et al. Hurricane damages to mangrove forests and post-storm restoration techniques and costs (The Nature Conservanc, 2022).
-
Xiong, L. et al. Quantifying mangrove canopy regrowth and recovery after Hurricane Irma with large-scale repeat airborne lidar in the Florida Everglades. Int. J. Appl. Earth Observ. Geoinf. 114, 103031 (2022).
-
Vizcaya-MartÃnez, D. A. et al. Monitoring detailed mangrove hurricane damage and early recovery using multisource remote sensing data. J. Environ. Manag. 320, 115830 (2022).
-
Balke, T., Swales, A., Lovelock, C. E., Herman, P. M. J. & Bouma, T. J. Limits to seaward expansion of mangroves: translating physical disturbance mechanisms into seedling survival gradients. J. Exp. Mar. Biol. Ecol. 467, 16–25 (2015).
-
Twilley, R. R., Rivera-Monroy, V. H., Chen, R. & Botero, L. Adapting an ecological mangrove model to simulate trajectories in restoration ecology. Mar. Pollut. Bull. 37, 404–419 (1999).
-
Mangrove ecosystems: a global biogeographic perspective: structure, function, and services (Springer International Publishing, 2017). https://doi.org/10.1007/978-3-319-62206-4.
-
Sidik, F., Hidayatullah, T., Kadarisman, H. P. & Lovelock, C. E. Evaluation of mangrove development in a created mangrove wetland in Porong, East Java. In: Regional Symposium on Mangrove Ecosystem Management In Southeast Asia (Ministry of Forestry Indonesia, 2013).
-
van Hespen, R. et al. Identifying trait-based tolerance to sediment dynamics during seedling establishment across eight mangrove species. Limnol. Oceanogr. lno.12202, https://doi.org/10.1002/lno.12202 (2022).
-
Watson, J. G. Mangrove forests of the Malay Peninsula (Fraser & Neave, 1928).
-
Van Loon, A. F., Te Brake, B., Van Huijgevoort, M. H. J. & Dijksma, R. Hydrological classification, a practical tool for mangrove restoration. PLoS ONE 11, e0150302 (2016).
-
Best, U. S. N. et al. Do salt marshes survive sea level rise? Modelling wave action, morphodynamics and vegetation dynamics. Environ. Model. Softw. 109, 152–166 (2018).
-
Baptist, M. J. et al. On inducing equations for vegetation resistance. J. Hydraulic Res. 45, 435–450 (2007).
-
Du, Q., Qin, Z., Ming, S. & Zhang, C. Differences in the vertical accretion of sediment among mangrove species with different aerial root types. Estuar. Coast. Shelf Sci. 256, 107375 (2021).
-
Ohira, W., Honda, K., Nagai, M. & Ratanasuwan, A. Mangrove stilt root morphology modeling for estimating hydraulic drag in tsunami inundation simulation. Trees 27, 141–148 (2013).
-
Sillanpää, M., Vantellingen, J. & Friess, D. A. Vegetation regeneration in a sustainably harvested mangrove forest in West Papua, Indonesia. For. Ecol. Manag. 390, 137–146 (2017).
-
Chen, D. et al. Historical ecological monitoring and appraisal for extractive uses and other values in Malaysia unveils consequences of regime shifts in 120 years of mangrove management. J. Nat. Conserv. 79, 126582 (2024).
-
van der Wegen, M. & Roelvink, J. A. Long-term morphodynamic evolution of a tidal embayment using a two-dimensional, process-based model. J. Geophys. Res. 113, https://doi.org/10.1029/2006JC003983 (2008).
-
Best, ÜS. N. et al. Wave attenuation potential, sediment properties and mangrove growth dynamics data over Guyana’s intertidal mudflats: assessing the potential of mangrove restoration works. Earth Syst. Sci. Data 14, 2445–2462 (2022).
-
Ren, H. et al. Restoration of mangrove plantations and colonisation by native species in Leizhou bay, South China. Ecol. Res 23, 401–407 (2008).
-
Schrijvershof, R. A., van Maren, D. S., Torfs, P. J. J. F. & Hoitink, A. J. F. A Synthetic spring-neap tidal cycle for long-term morphodynamic models. JGR Earth Surface 128, 1–18 (2023).
-
VM0033 methodology for tidal wetland and seagrass restoration v2.1 (Verified Carbon Standard, 2023).
-
Kauffman, J. B. et al. Total ecosystem carbon stocks of mangroves across broad global environmental and physical gradients. Ecol. Monogr. 90, e01405 (2020).
-
Comley, B. W. T. & McGuinness, K. A. Above- and below-ground biomass, and allometry, of four common northern Australian mangroves. Aust. J. Bot. 53, 431–436 (2005).
-
Kauffman, J. B. & Cole, T. G. Micronesian mangrove forest structure and tree responses to a severe typhoon. Wetlands 30, 1077–1084 (2010).
-
Ong, J. E., Gong, W. K. & Wong, C. H. Allometry and partitioning of the mangrove, Rhizophora apiculata. For. Ecol. Manag. 188, 395–408 (2004).
Acknowledgements
S.M.B. acknowledges the Indonesia Endowment Fund for Education (LPDP) for its full scholarship during the PhD study conducted at IHE Delft Institute for Water Education and Delft University of Technology in the Netherlands. Sebrian also acknowledges Het Lammingafond for its support in the second part of the data collection and study allowance. Most of the modelling work in the study was carried out using the Research Cloud service provided by SURF.
Author information
Authors and Affiliations
Contributions
S.M.B., M.W.G., J.R., and J.D. conceptualised the study; S.M.B. developed the DFMFON code; S.M.B., M.W.G., U.G., and J.R. conducted the validation; S.M.B. conducted the formal analysis; M.W.G. and D.R. supervised S.M.B.; M.W.G. and D.R. acquired additional fund; S.M.B. created the figures and wrote the original draft; all authors wrote, reviewed, and agreed on the final manuscript.
Corresponding author
Ethics declarations
Competing interests
The authors declare no competing interests.
Peer review
Peer review information
Communications Earth & Environment thanks Ariana E. Sutton-Grier, Luke Lamb-Wotton and the other, anonymous, reviewer(s) for their contribution to the peer review of this work. Primary Handling Editor: Somaparna Ghosh.
Additional information
Publisher’s note Springer Nature remains neutral with regard to jurisdictional claims in published maps and institutional affiliations.
Supplementary information
Rights and permissions
Open Access This article is licensed under a Creative Commons Attribution-NonCommercial-NoDerivatives 4.0 International License, which permits any non-commercial use, sharing, distribution and reproduction in any medium or format, as long as you give appropriate credit to the original author(s) and the source, provide a link to the Creative Commons licence, and indicate if you modified the licensed material. You do not have permission under this licence to share adapted material derived from this article or parts of it. The images or other third party material in this article are included in the article’s Creative Commons licence, unless indicated otherwise in a credit line to the material. If material is not included in the article’s Creative Commons licence and your intended use is not permitted by statutory regulation or exceeds the permitted use, you will need to obtain permission directly from the copyright holder. To view a copy of this licence, visit http://creativecommons.org/licenses/by-nc-nd/4.0/.
About this article
Cite this article
Beselly, S.M., van Der Wegen, M., Reyns, J. et al. Strategic mangrove restoration increases carbon stock capacity.
Commun Earth Environ 6, 422 (2025). https://doi.org/10.1038/s43247-025-02401-2
-
Received: 15 July 2024
-
Accepted: 19 May 2025
-
Published: 31 May 2025
-
DOI: https://doi.org/10.1038/s43247-025-02401-2
Search
RECENT PRESS RELEASES
Related Post

