The multi-dimensional environmental impact of global crop commodities
March 24, 2025
Abstract
Agriculture is one of the leading causes of detrimental environmental impacts, including greenhouse gas emissions, biodiversity loss and depletion of freshwater resources. Such impacts can be assessed by environmental sustainability indices; however, limitations in current indicators necessitate the development of more robust and standardized crop-specific environmental sustainability indices. Here we developed the crop environmental sustainability index (PLANTdex), a spatially explicit index (5 arcmin resolution) quantifying crop production’s environmental impacts. PLANTdex includes globally standardized indicators of environmental impacts assessing water stress and biodiversity loss via five emissions pathways: greenhouse gas emissions, water consumption, land occupation, and nitrogen and phosphorus fertilizer application. We applied PLANTdex to 16 crops, revealing high variability across production system efficiencies, crop types and local context environmental sensitivities. Globally and nationally, no clear correlation emerged between PLANTdex scores and crop production, but stronger correlations were evident at finer spatial scales and for individual crops. Sugar cane showed the strongest negative correlation (low impacts in high-production areas), while oil palm had the strongest positive correlation (high impacts in high-production areas), highlighting the importance of sub-national, crop-specific assessments. PLANTdex’s spatial resolution and crop specificity make it valuable for initiatives such as the Taskforce on Nature-related Financial Disclosures and corporate sustainability strategies.
Main
Population growth and socioeconomic development have increased crop production for food, feed, fibre and fuel, resulting in intensive resource use that imperils environmental integrity. Agriculture, encompassing crop and livestock production, threatens 86% of species with risk of extinction and reduces species variability1,2. Farming activities contribute 9–14% of global greenhouse gas (GHG) emissions3. Agricultural land occupies 50% of Earth’s habitable land surface and is responsible for 99% of deforestation in the tropics, causing severe biodiversity loss4,5. Agriculture also depletes surface and groundwater reserves, accounting for 70% of global freshwater withdrawals6. Moreover, fertilizer use causes 78% of the global marine and freshwater eutrophication (algal blooms in waterways due to nutrient loading, impacting biodiversity)7.
Although global in scope, the United Nations (UN) Sustainable Development Goals (SDGs) (which indicate environmental protection and better food security and nutrition as key goals) require environmentally sustainable commodity sourcing and informed food policies at sub-national and regional levels. This is crucial as food production’s environmental impact varies by product and region8. To achieve the environmental goals of the UN SDGs, stakeholders outside traditional policymaking, such as corporations, non-profits, farmers, consumers and the public, increasingly seek environmental sustainability indexes and multi-indicator databases for food commodities9. Market-driven initiatives such as the Taskforce on Nature-related Financial Disclosures (TNFD) highlight benchmarking and index rankings to raise awareness of sustainability and guide governments, banks, investors and supply chains towards sustainable practices. The TNFD emphasizes assessing spatially explicit nature impacts (https://tnfd.global/), prompting institutions such as the International Finance Corporation, UN Environment Programme World Conservation Monitoring Centre and independent data providers to offer spatial tools for measuring these impacts. These tools are vital for banks, investors and development finance institutions. However, the lack of standardized methodologies and limitations in current spatial indicator databases hinder quantitatively informed and comparable decisions.
Previous global studies have made efforts to assess the environmental, economic and social impacts of agriculture through multi-indicator databases7,10,11,12,13,14 (Supplementary Table 1). However, few of these studies provide spatially explicit data below the national level10,12,13, which is necessary for evaluating regional impacts such as biodiversity and water stress15,16,17. In addition, many databases use non-standardized indicator methodologies18, focus on resource-use intensities rather than environmental impacts13, measure over different periods12 or lack specificity to particular foods10,12,13,14. Multi-indicator databases are frequently aggregated into single scores to create indexes, which, while useful for policy and investment decisions in other fields, are rarely applied globally in agricultural studies. Reference 12 developed a global food system sustainability index at the national level but faced limitations due to inconsistent global data availability, making their analysis of trade-offs and synergies between indicators inconclusive.
This study introduces the globally applicable, spatially explicit crop environmental sustainability index (PLANTdex) to address existing methodological limitations. PLANTdex uses robust indicators of environmental impact related to five emissions pathways at a 5 arcmin resolution (~9 km × 9 km at the Equator) for the year 2000. These indicators assess water stress from crop water consumption and biodiversity loss (terrestrial and aquatic) due to crop GHG emissions, land use and fertilizer application10,15,19,20,21 (nitrogen and phosphorus; Fig. 1). Each indicator quantifies the environmental impact per tonne of dry mass for 16 crop commodities, proving a fairer comparison between crops for their end-use purpose (for example, nutritional or fibre use). The year 2000 was chosen for evaluation due to the availability of comprehensive sub-national crop-specific data (regional, province and district), including yield, harvested area, irrigation use and fertilizer application, which underpin PLANTdex’s robustness22,23. Subsequent metrics often rely on extrapolations from 2000 data, diminishing their reliability24,25. PLANTdex thus offers a robust spatially explicit baseline for assessing the multi-dimensional environmental impacts of crop commodities and supports the evaluation of mitigation measures relative to this baseline in more recent years.
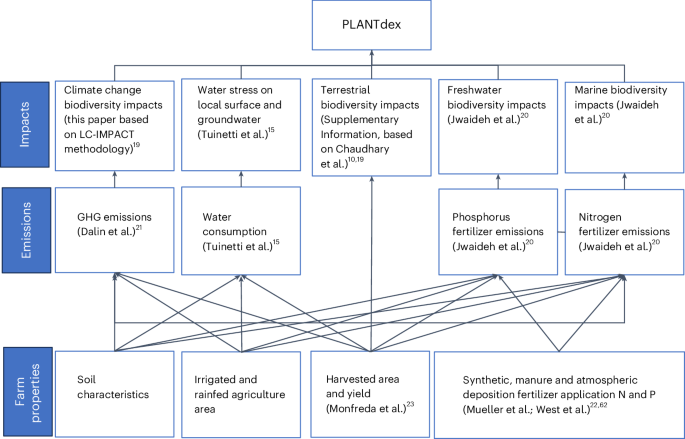
These emissions pathways are developed from spatially explicit models based on similar farm property datasets. Notably, emissions are informed by more datasets beyond the farm property data mentioned in the preceding. Since farm property datasets may vary, readers are encouraged to consult the relevant emissions pathway studies for detailed input information. Additional details on the indicators are available in Supplementary Table 2 and the corresponding papers.
Each PLANTdex indicator is normalized and equally weighted before aggregation into a single PLANTdex score using the Technique for Order Preference by Similarity to Ideal Solution (TOPSIS) aggregation method. This method, detailed in ref. 26, is a compensatory technique that measures the geometric distance of a normalized indicator set to a positive ideal solution (representing the least environmental impact) and a negative ideal solution (representing the worst-case environmental impact). Reference 27 and subsequent comparisons identified four primary advantages of TOPSIS applicable to this study. First, TOPSIS provides a logical framework that aligns with human decision-making processes by favouring solutions closest to the ideal. Second, it generates a scalar value that reflects both optimal scenarios (for example, PLANTdex = 0) and worst-case scenarios (for example, PLANTdex = 1), offering clear interpretability. Third, the method is computationally efficient and easily programmable, making it well suited for handling large datasets. Last, it aims to identify the most sustainable solution while requiring less computational effort for non-compensatory aggregation methods, making it less compensatory than extreme approaches such as sum and product rules, which are often employed in sustainability score building.
PLANTdex assigns scores from 0 to 1, where 0 represents minimal impact and 1 indicates the maximum impact observed across all environmental indicators, locations and crop types. A score of 0.1 signifies that a crop’s impacts are closer to minimal, while 0.9 indicates impacts nearing the worst observed. Unlike some life-cycle assessment (LCA) methodologies that offer target impact thresholds (for example, Planetary Boundary linked LCA28,29), PLANTdex is relative to the maximum and minimum observed values. While LCAs with target thresholds are more suitable for benchmarking, they often operate at a national scale, compromising the spatial resolution critical to PLANTdex’s indicators29. PLANTdex’s biodiversity indicators use the LC-IMPACT methodology, noted for its finer spatial resolution among existing LCA approaches19.
Applied to 16 crops circa 2000, PLANTdex aims to enhance knowledge of crop production’s environmental impacts (one of the industries most dependent on nature and biodiversity) by developing a composite indicator that consolidates various environmental pathways affecting biodiversity and water stress. This approach highlights spatially explicit variations in environmental impacts across different crop types, focusing on pinpointing hotspots for water and biodiversity impacts caused by GHG emissions, land use, fertilizer application and water consumption. It also aims to identify areas of unsustainable crop production by assessing impact intensities and aggregate effects. Furthermore, the approach establishes environmental impact insights to facilitate sustainable policy development and stakeholder decision-making.
Results
Global spatial distributions
The PLANTdex scores for all crops, which are production-weighted averages across the scores of each of the 16 crops, at grid-cell level, span from 0.13 to 0.90, with 98% of values between 0.33 (1st percentile) and 0.64 (99th percentile). The absence of scores at the extremities (0 or 1) indicates that no global location exhibited uniformly observed minimal or maximal impacts across all assessed indicators. This variation suggests that while a location might exhibit the most severe impacts for certain indicators, it might not for others. Crop-specific PLANTdex scores demonstrate notable variability across individual crops globally. Cassava exhibits the broadest range of scores, from 0.02 to 0.94, whereas soybean shows the most substantial dispersion of scores from 0.38 (1st percentile) to 0.72 (99th percentile) (Supplementary Table 4).
High PLANTdex scores exceeding 0.53 (75th percentile) are observed predominantly in Central America, Southern Europe, the region between the Black and Caspian seas, Southern Africa and South, East and Southeast Asia (Fig. 2a). Conversely, regions such as midwestern North America, certain areas of Central Europe and Russia, western South Asia and parts of Central Africa and South America report notably low scores less than 0.43 (falling below the 25th percentile). Given PLANTdex’s focus on intensity per tonne of dry crop, it is crucial to compare these scores with total crop production by region (Supplementary Fig. 2), helping identify whether high-production areas coincide with lower PLANTdex scores, aiming to minimize overall environmental impacts. Analysis revealed no strong correlation between PLANTdex scores and production levels (R² = -0.0202, P < 0.001). While some high-production regions, for example, northern United States and northwestern Europe, showed low PLANTdex scores, other high-production regions (for example, South, Southeast and East Asia) exhibited high PLANTdex scores.
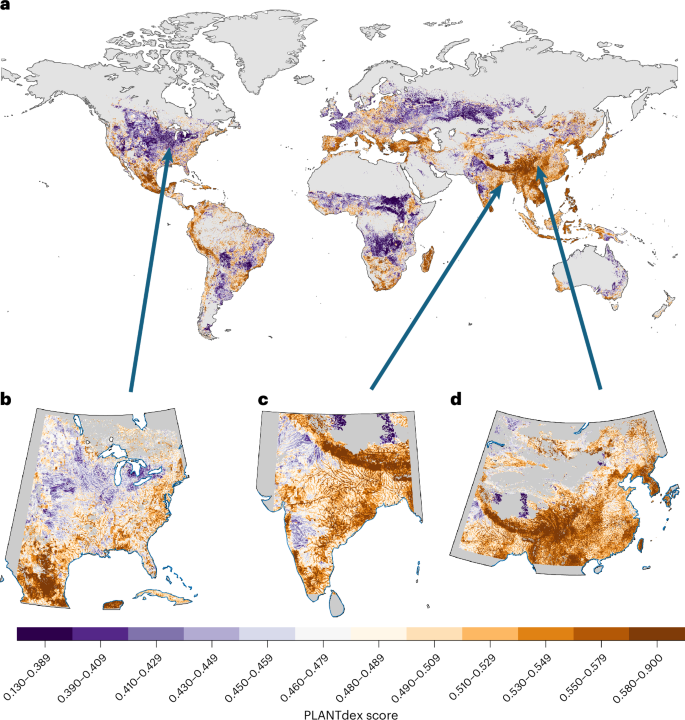
a, Global. b–d, PLANTdex scores over Central–Eastern North America, South Asia and Eastern Asia.
The sub-national spatial analysis of PLANTdex reveals two distinct patterns (Fig. 2b–d). First, high environmental impacts are observed along river courses, with the most substantial effects detected in the lower reaches. This pattern is attributed primarily to the high aquatic impacts of nitrogen and phosphorus fertilizer application such as in South Asia along the Ganges River (Fig. 2c). Second, higher-elevation and higher-slope areas consistently show greater environmental impacts. This relationship is probably driven by increased nutrient run-off, which adversely affects aquatic biodiversity.
Country-level crop-specific distributions
We compared the environmental impacts of crop production across nations using five emissions pathways outlined in PLANTdex for oil palm and soybean (Fig. 3a,b). Ideally, within countries, crop production systems with relatively large production (higher production per grid cell; Fig. 3a(i),b(i)) and relatively low PLANTdex scores (lower environmental impact intensities per grid cell; Fig. 3a(iii),b(iii)) are considered optimal. This combination corresponds to negative correlations between production and PLANTdex, indicating higher production occurs in regions with lower impacts. This pattern is seen in soybean production in Bolivia and Italy (Fig. 3b).
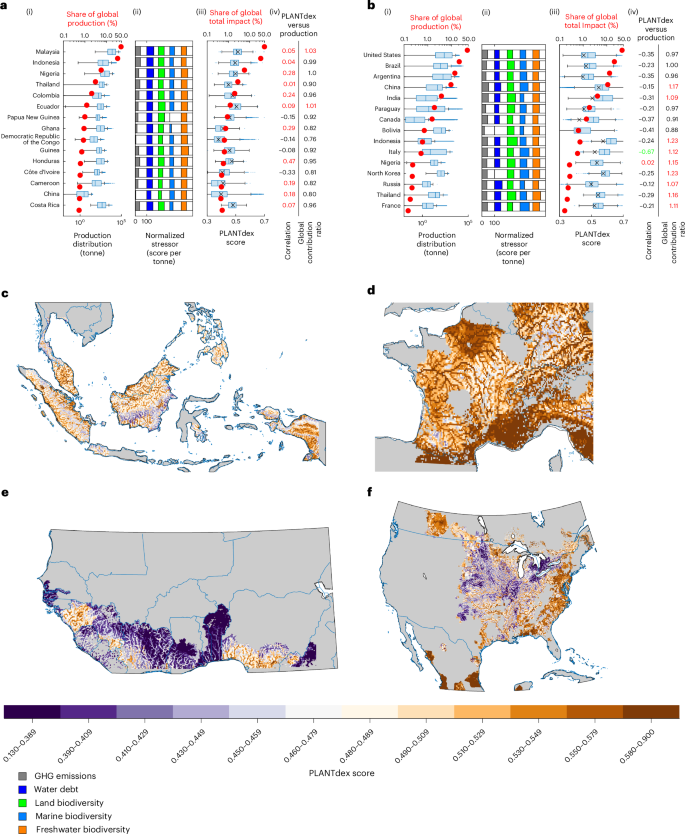
a,b, Country-level plots for two crops (oil palm (a) and soybean (b)) and the top 15 countries for their specific production. a(i),b(i), Crop production across n = 9,331,200 independent 5 arcmin resolution grid cells, split by country. Box plots display the median (centre line), interquartile range (IQR, box) and whiskers (minimum and maximum values within 1.5 × IQR, unless outliers are present). Red dots indicate total national production, which is not derived from this study but obtained from ref. 23. a(ii),b(ii), Normalized emissions for individual indicators, highlighting dominant emissions and variability within countries, with total impact as a linear sum, unlike PLANTdex. a(iii),b(iii), Distribution of PLANTdex scores across n = 9,331,200 independent grid cells at a 5 arcmin resolution, split by countries, where larger box-plot distributions indicating greater regional variability for impact per tonne (PLANTdex) with mean (cross) display the median (centre line), IQR (box) and whiskers (minimum and maximum values within 1.5 × IQR, unless outliers are present). The average PLANTdex per tonne of dry mass generally varies between 0.35 and 0.60 and overlaps the median of the distribution at the country level, indicating a normal distribution. Red dots indicate share of total global impact pertaining to a country. a(iv),b(iv), Each country’s ratio contribution of total impacts (production multiplied by PLANTdex) versus production and the correlation between production and PLANTdex within each country at the grid-cell level. A country’s ratio contribution of impacts versus production indicates whether the country is excessively causing high environmental impacts in relation to its contribution to global crop production. c–f, PLANTdex scores across example countries for oil palm and soybean crops. c,d, Southeast Asia (c) and France (d) have impacts versus production contribution ratios above 1. e,f, Western Africa (e) and the United States (f) have impacts versus production contribution ratios below 1.
Between countries, negative correlations between total production and PLANTdex are desirable for reducing global environmental impacts, indicating that high production occurs in regions with lower environmental impacts. While no significant relationships were found at the country level, significant relationships were identified at the grid-cell level, highlighting the importance of analysis at sub-national resolutions. Barley, cotton, maize, potato, rice, soybean, sugar cane and wheat showed negative correlations (r < –0.1, P < 0.001) between total production and PLANTdex, with soybean showing the strongest negative correlation (r = –0.25, P < 0.001; Supplementary Table 3). Conversely, oil palm and rapeseed showed positive correlations (r > 0.1, P < 0.001), indicating higher production in cells with higher environmental impacts, such as Malaysia for oil palm.
While correlation analysis is useful for assessing whether high PLANTdex scores exist in high-production countries or grid cells, it does not present the contribution of total impacts (PLANTdex multiplied by production) versus the contribution of total crop production globally. The ratio of global contributions between total impacts and production (Fig. 3a(iv),b(iv)) indicates, for ratios above 1, countries having disproportionately high environmental impacts globally (due to either poor resource efficiencies or high environmental vulnerabilities), as seen with oil palm in Malaysia and soybean in France. Ratios below 1 suggest lower impact production, as seen with oil palm in Congo and soybean in the United States. Interestingly, while the Congo suffers from high biodiversity loss from land and fertilizer use, there is less GHG emissions-related biodiversity loss than in other oil palm production countries, as shown within the normalized emissions plots (Fig. 3a(ii),b(ii)). These low-impact regions are farther from water courses and at lower elevations, as indicated by crop-specific PLANTdex mapping (Fig. 3c–f). The normalized emissions plots (Fig. 3a(ii),b(ii)) suggested that water stress and land-use biodiversity loss were the main causes of higher oil palm impacts in Malaysia. For oil palm, ratios above 1 of global contributions between total impacts and production were associated with countries with higher production levels, while for soybeans, they were associated with lower production levels, indicating more severe impacts from global production systems for oil palm. Over 40% of global oil palm and soybean production is concentrated in Malaysia and the United States, respectively (Fig. 3a(i),b(i)). By contrast, crops such as wheat, produced both heavily and extensively, showed a lower maximum production percentage in individual countries. For context, rather than a result of this study, no country’s crop production surpassed 50% of the global total, although production concentration varies.
Crop-specific extreme impact analysis
Maize, wheat, rice, sugar cane and soybean represent 76% of the total global dry matter of the crops considered in this study. Hence, these crops have the most impacting global PLANTdex scores (global average weighted by production), as total environmental impacts are heavily reliant on quantity of production (Fig. 4). To compare extreme impacts across crops, we present, for every crop, the global production-weighted 75th-percentile impact score (representing an extreme impact) of this crop for each of the five environmental indicators and compare this with the global 75th (red line) and 50th (blue line) production-weighted percentile scores of all 16 crops for each indicator (Fig. 4).
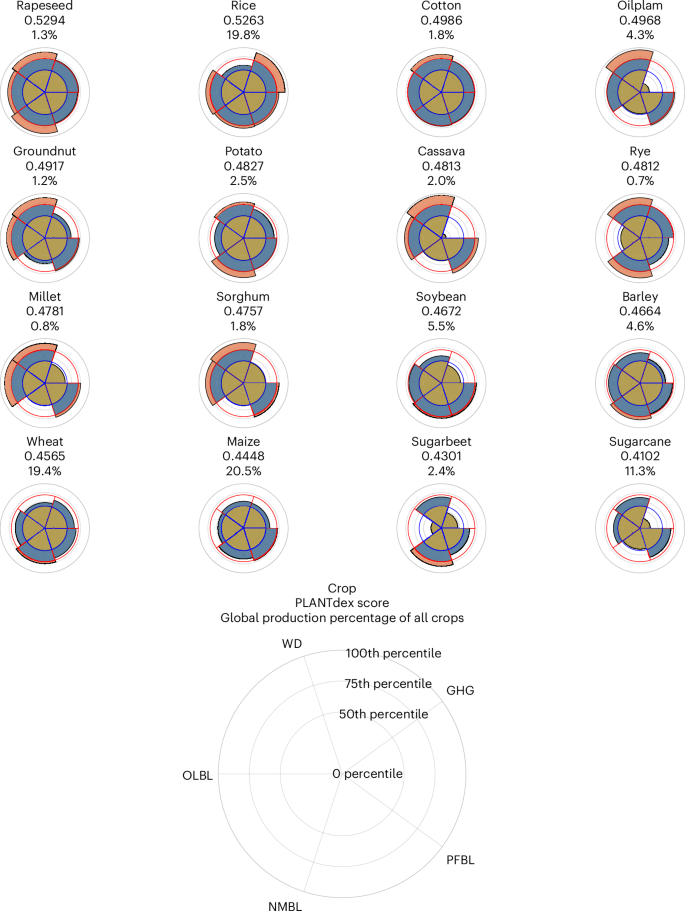
Environmental impacts include water debt (WD), GHG emissions (GHG), phosphorus emission freshwater biodiversity loss (PFBL), nitrogen emission marine biodiversity loss (NMBL) and occupational land biodiversity loss (OLBL). Each crop’s extreme impact is compared with the global 75th (red line) and 50th (blue line) percentiles of all crops. The PLANTdex scores are shown in descending order from high (worst) to low (best). PLANTdex scores, located below the crop name, are globally aggregated by the production-weighted average. The percentage, located below the PLANTdex score, represents the crop’s share of the global total production (in tonnes of dry matter) of all the crops considered in this study.
For the top five most produced crops globally, water-stress impacts were consistently above the global 75th percentile for all 16 crops. Other environmental impacts varied when compared with the global 75th and 50th percentiles (Fig. 4). While rice’s 75th percentile of GHG emissions-related score represented the 97th percentile compared with the global distribution of GHG emissions-related score for all crops (due to rice being the only crop with emissions of methane, a strong GHG), maize and sugar cane 75th percentiles for GHG emissions-related score were below the global 50th percentile of GHG emissions-related scores for all crops. With the least total production, rye was the only crop to show 75th-percentile impacts above the global 75th percentile for all indicators. Some crops–rice, wheat, potato, cotton and rye–showed their extreme impacts verging close to or beyond the global 75th percentile. The crops with the least extreme impact, with their 75th-percentile impact below the global 50th percentile for certain indicators, included sugar cane, oil palm and cassava for GHG emissions, sugar beet for land biodiversity loss and rapeseed for water stress.
Variability in impacts across different conditions
We assessed how specific-crop PLANTdex scores vary across different conditions such as country income, crop production, temperature, precipitation, soil organic carbon content and slope incline (Fig. 5). We chose these conditions to represent common economic and environmental factors that affect resource-use efficiencies at the farm level. In high-production and high-income regions, wheat and potato showed lower impacts than average, whereas rice and oil palm showed higher impacts. In high-production regions, rice production had greater biodiversity impacts than average, especially on marine environments, due to nitrogen fertilizer use. PLANTdex values for oil palm increased in high-production regions due to high water-stress and land biodiversity impacts. This is probably because oil palm grows in wet, tropical regions with high biodiversity (for example, Indonesia) and areas with significant dry periods (for example, West Africa), stressing water resources. All crops except oil palm showed strong reductions in water-stress impacts in high-production regions, suggesting more efficient water use.
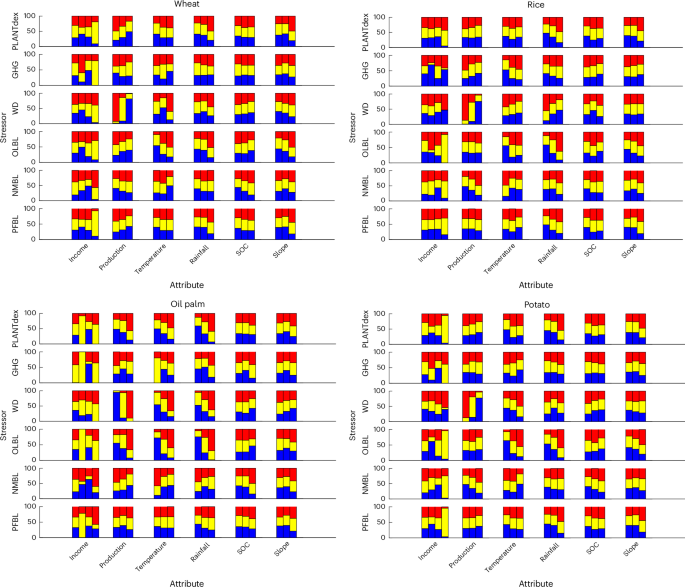
Four individual crop distributions are considered for representation (wheat, rice, oil palm and potato) over varying attributes for income, production, temperature, rainfall, soil organic carbon content (SOC) and slope. Here we split each attribute into low (1st bar), medium (2nd bar) and high (3rd bar) on the basis of its 33rd and 67th percentiles (for example, high production, low precipitation and medium slope) within its specific crop-growing regions. For income, we split into four income groups (low (1st bar), lower middle (2nd bar), upper middle (3rd bar) and high (4th bar)).
We found that PLANTdex scores increased with temperature, precipitation and slope in crop-growing regions (Fig. 5). Soil organic carbon content had a weaker correlation with PLANTdex due to varied results between environmental emissions pathways. Marine and freshwater biodiversity impacts rose with higher soil organic carbon content, probably due to increased nutrient run-off and leaching from rich soils30. Water-stress and terrestrial biodiversity impacts decreased as soil organic carbon content increased, except for rice. High soil organic carbon levels may help maintain micro-habitat functionality (below-ground biodiversity) during droughts by retaining soil moisture (reducing water stress) and supporting above-ground biodiversity31. We found that crops’ GHG emissions increased with precipitation, which could be due to enhanced microbial activity, anaerobic conditions and plant decomposition32. No clear relationship was found between GHG emissions and other physical factors for the crops studied.
Relationships of emissions pathways to environmental impacts
The contribution of emissions pathways to environmental impacts considered in this study indicates complex relationships between environmental emissions pathways, which are not necessarily consistent among countries and crop types. When considering correlations between emissions pathway-related environmental impacts across grid cells within a country, more positive associations existed between indicator pairings than did negative ones. Of 3,200 samples (across all indicators, crop types and country boundaries), we found 1,851 synergies, 937 trade-offs, 387 insignificant relationships, 25 insufficient data (Supplementary Table 5).
Overall, while 31% of the indicator correlations were negative, 57% were positive. The strongest positive associations (>75% of countries exhibiting positive correlations) generally involved emissions pathways relating to biodiversity loss (Supplementary Table 5 and Supplementary Fig. 3). Strong positive correlations also existed between land-use biodiversity loss and GHG emissions (63%) and marine biodiversity loss associated with nitrogen fertilizer use and water stress (71%; Supplementary Table 5). The strongest negative correlations were between GHG emissions and marine biodiversity loss (45%). Roughly equal positive and negative associations were identified with marine biodiversity paired with GHG emissions or land biodiversity loss; 12% of the indicator relationships showed no significant relationship and 1% had insufficient data to provide a conclusive result.
Discussion
The PLANTdex methodology leverages high-spatial-resolution data to evaluate the environmental impacts of five distinct emissions pathways, offering a notable advancement over previous indices. This granular approach reveals nuanced spatial patterns in environmental impacts, demonstrating a decline in PLANTdex scores with increasing distance from water courses and coastlines while showing an elevation-related increase. Such spatially explicit insights, often overlooked in traditional indices due to their focus on resource use rather than direct impact intensity or national-/basin-scale assessments10,12,25, underscore PLANTdex’s capability to provide detailed environmental impact assessments across diverse geographical features. This detail facilitates a deeper understanding of localized environmental emissions pathways, potentially guiding investors, policymakers and farmers towards more targeted crop-specific conservation and management strategies.
As a crop-specific index, PLANTdex revealed that no single crop exhibited similar impact patterns, and some currently less-produced crops exhibited high extreme impacts across all environmental indicators, a concern as demand for these crops increases due to consumption and supply shifts (for example, rye alternatives for wheat due to recent conflicts33 or plant-based proteins such as soybean and groundnuts34). Global policy efforts may utilize PLANTdex’s crop-specific impact analysis and spatially explicit character to legislate more effectively, reducing impacts associated with less-studied and produced crops.
The need to reduce the environmental impact of agriculture while ensuring sufficient production is a clear goal of the SDGs. Our results identified no clear correlations between environmental impact intensities (PLANTdex score) and production at the 5 arcmin resolution. Suggesting productivity increases has not improved efficiencies or reduced environmental impacts. Instead, our results suggest resource-use intensities are excessively high regardless of crop yield (for example, East Asia, North America), and the local environmental sensitivity plays an important role such as within tropical and arid land regions and temperate marine areas (for example, North Sea). The PLANTdex ratio of contribution between total impact (PLANTdex multiplied by production) versus production indicates regions where crop production is productive and exhibits lower impacts (ratios below 1) and highlights areas where ratios exceed 1, suggesting the need for policies and practices to mitigate environmental impacts. In this study, this ratio was formulated at the national scale to allow for benchmarking and ease of interpretation; however, this ratio can also be formulated at the sub-national scale (down to grid cell). Utilizing metrics such as PLANTdex and the ratio indicator may prompt stakeholders to improve resource-use efficiencies through technology or regenerative agricultural approaches35,36. However, it could also prompt stakeholders to adjust crop production on the basis of the evaluated impact conditions at various locations, which may not always be practical. Certain regions might lack the optimal environmental conditions to boost production, and cultural or dietary preferences could limit demand for specific crops. Furthermore, increasing crop production distance from consumption sites exacerbates environmental impacts through enhanced transportation and distribution effects37. Reducing production or diminishing interest in agriculture in specific areas could jeopardize local food security, strand food supplies and affect livelihoods reliant on specific crops, particularly in developing countries38,39,40. Thus, PLANTdex should be integrated into a comprehensive sustainability assessment that considers economic and social factors, areas not covered by this study.
PLANTdex identified significant positive associations between emissions pathways within countries (synergies), in contrast to previous studies with inconclusive results between countries. However, most indicator pairings in this study also showed negative (trade-offs) or inconsistent positive associations, suggesting that policies reducing impacts in one area may adversely affect another depending on location and crop type. Specifically, wheat and oil palm demonstrated average correlations of 0.33 and –0.37, respectively, between GHG emissions-related biodiversity loss and water stress (Supplementary Fig. 3). This implies that while irrigation strategies may reduce GHG emissions in wheat production, they could increase them in oil palm cultivation. Sustainable irrigation strategies have potential but vary in effectiveness on the basis of crop, irrigation method, gases emitted and cultivation practices (for example, flooded fields)41. Consistent correlations across different crops in some countries, such as India for land and freshwater biodiversity loss, reflect environmental sensitivity (Supplementary Fig. 3). By contrast, countries such as China show varying correlations for GHG-related biodiversity loss and water stress depending on crop type (Supplementary Fig. 3), indicating the influence of cropping system efficiencies and resource-use intensities. Understanding these associations supports stronger policy development and cost-effective management strategies targeting multiple emissions pathways from farmlands4.
Economic and physical attributes influence these environmental indicators. Some high-income regions may exhibit lower impacts due to efficient farming practices, while some lower-income regions might benefit from naturally favourable conditions or minimal use of intensive inputs. Areas with high soil organic carbon content support better soil structure and drainage, aiding groundwater replenishment but potentially increasing nitrogen nutrient leaching, which negatively impacts marine biodiversity and reduction of GHG emissions20. Regions with high temperatures, rainfall and steep slopes may experience greater nutrient run-off, exacerbating aquatic environmental impacts15,16,20. Targeted environmental management must consider both economic capabilities and physical characteristics of each region to mitigate adverse ecological effects. Knowledge sharing between regions with similar environments can promote the reapplication of effective mitigation practices and policies. Detailed findings are presented in Supplementary Fig. 4.
By choosing only meaningful methodological constructions for PLANTdex, the uncertainty due to the index build is highly reduced (varying normalization, weighting and aggregation; ‘Index uncertainty and sensitivity analysis’; Fig. 6), relaying the importance of a methodology that fits the data distribution and considers the index’s goal. While each of PLANTdex’s indicators has been validated individually, PLANTdex has also been compared with national-scale agricultural indices, such as those by Zhang et al.13 (‘Comparison with previous indices research’). PLANTdex’s sensitivity analysis highlights the importance of expertise, transparency and goals in composite indicator building due to the high sensitivity to transformation, normalization and aggregation techniques (‘Index uncertainty and sensitivity analysis’). PLANTdex aims to address existing methodological limitations by providing a globally applicable, spatially explicit and multi-dimensional assessment of environmental impacts in agriculture. Despite its strengths, the index is limited by lack of stakeholder opinion, target thresholds (meaning low-impact regions are probably still above sustainable thresholds) and consistent temporal data (‘Index method limitations’). Using a single temporal reference point (year 2000) does not reflect dynamic changes in agricultural practices and environmental policies over time.
Technological advancements do not necessarily cause excessive resource use or manifold environmental impacts. Instead, policies and financial investments promoting the overuse of inputs that seep into the environment and the expansion of cultivation into environmentally vulnerable regions unable to sustain high levels of intensification are more impactful42. PLANTdex highlights regions at risk of higher impacts, guiding sustainable investment, certification schemes and policy incentives. Financial institutions and policymakers can use PLANTdex to prioritize mitigation efforts for high-impact regions and crops, aligning with sustainability goals. The tool supports initiatives such as the TNFD (using the Locate, Evaluate, Assess and Prepare framework; https://tnfd.global/) by offering a streamlined, spatially harmonized and time-uniform scoring system for assessing biodiversity and water-stress impacts. PLANTdex helps stakeholders understand their nature-related impacts, disclose emissions (through the underlying datasets) and assess biodiversity risks. It aids investors and financial institutions in evaluating biodiversity impacts of crop-related assets, screening high-impact locations (similar to use cases for iBAT43 or deforestation fronts44 data) and estimating environmental impacts in supply chains. Users can multiply their crop production quantities by location-specific metrics to estimate the associated environmental impacts for emissions and impact disclosures. However, PLANTdex is a crop-specific tool designed for comparative assessments, benchmarking and identifying environmental hotspots, rather than for fine-scale decision-making or absolute impact quantification.
Ongoing research is to update and refine the PLANTdex index with more recent data to capture historical and ongoing changes in agricultural practices. Time-series data on crop production practices, biodiversity impacts and stakeholder-driven weighting adjustments will enhance its reliability and applicability in future iterations. In addition, efforts to expand the index to include socioeconomic and cultural impacts would provide a more comprehensive assessment of sustainability. We recommend further research into developing evidence-based indicators for good agricultural practices or policies to allow leveraging against PLANTdex scores and offsetting environmental impacts in decision-making processes. We also recommend that livestock is also considered, as 65% of all agricultural land is used for pastoral farming4.
Methods
Index construction
The steps and methodological choices to build PLANTdex are summarized as follows:
-
The index was built by selecting multiple sub-indicators relevant to environmental impacts. Each sub-indicator is independent and represents distinct emissions pathways affecting biodiversity or water stress. The inclusion of sub-indicators was based on their relevance and importance to environmental impact, without double counting.
-
Different units of sub-indicators required normalization to make them comparable. The study applied the Box–Cox transformation, a statistical power transformation technique that is suitable for datasets where extreme values (outliers) need to be accentuated. Following this transformation, min–max normalization was applied to scale the data to a [0,1] range, ensuring consistent comparison across indicators45.
-
Equal weighting was chosen for all sub-indicators under the assumption that each indicator (or emissions pathway) holds equal importance in the context of environmental impact. This avoids double counting and emphasizes the independence of the sub-indicators.
-
The study used a compensatory aggregation method—TOPSIS—to rank performance across environmental indicators26. TOPSIS was selected for its ability to compute relative closeness to an ideal solution (minimum environmental impact) and a negative solution (maximum environmental impact). This approach allowed for efficient computation of results at a 5 arcmin resolution, avoiding the complexity of non-compensatory methods such as outranking.
-
The uncertainty analysis focused on exploring different potential index designs that were suitable, including the comparison of normalization techniques (min–max and vector normalization) and four different non-compensatory aggregation methods (TOPSIS, PROMETHEE46, EDAS47 and CODAS48). The uncertainty was evaluated through Monte Carlo simulations. The sensitivity of the index was assessed across a variety of scenarios (including unsuitable methodologies related to transformation, normalization, weighting and aggregation) using wheat, rice, oil palm and soybean production data for countries contributing more than 0.5% of global production.
Conceptually, indices are based on sub-indicators, x, that may not have a standard unit of measurement. An index, I, is built as follows:
Where x is the normalized variable, and W is the weight attached to x. As such, the formula indicates that normalization and weighted aggregation of the variables are essential steps for developing an index.
The reliability of an index depends on the relevance and accuracy of its indicators and the methods used in its construction.49. A ‘meaningful’ indicator, as defined by ref. 50, ensures the index’s value remains consistent across different scales and indicators. However, scientific debate surrounds index methods. Reference 51 argued that indices may inadequately explain complex phenomena, ref. 52 identified bias in method selection and ref. 53 noted a lack of clarity in methodologies, which may lead to misuse in policy support54. Method choices in normalization, weighting and aggregation introduce uncertainties53, which we address through tailored techniques suited to our data’s distribution and interests, as well as through uncertainty and sensitivity analyses to assess PLANTdex’s reliability.
Normalization is the process of transforming indicators with different units of measurement into dimensionless variables. It is an essential step before weighting and aggregation. However, it increases the probability of uncertainty in measurement error due to manipulation of the data55. Hence, the choice of the normalization technique is an essential factor. Several normalization techniques can be broadly categorized into linear, log and power normalizations. Although linear normalization is most commonly used, a modeller may choose a log or power normalization technique depending on whether changes are more significant at the distribution’s lower end (log) or higher end (exponential or power). Here our interests lie within the extreme value of our dataset distributions to identify hotspots for environmental impacts. Hence, we applied Box–Cox transformations (a statistical power transformation technique) to accentuate extreme values. Box–Cox transformation is applied to each data point yij for the ith grid-cell data point and jth indicator:
The transformed data (y_ij^left(lambda right)) with a specific value of λ is normalized to the range [0,1] using a min–max normalization:
where (max (y_ij^(lambda ))) and (min (y_ij^left(lambda right))) are the maximum and minimum values of the Box–Cox transformed data for the jth indicator.
The incorporation of subjective weighting, from expert and/or stakeholder opinion, is often sought for places with specific issues, concerns or goals. However, at the global scale, weighting is not possible due to multiple conflicting interests. Statistical weighting has been widely used for decision-making in recent years due to the advantage of avoidance of human interface, particularly when decision-makers have conflicting perspectives for the values of weights. In addition, statistical weighting reduces the impact (compared with equal weighting) of double counting by giving more precedence to indicators with low degrees of mutual correlation56. This study assigned equal weights wj under the rationale that each indicator represents separate and independent emissions pathways that impact biodiversity or water stress. It is important to note, however, that certain pathways share common drivers, such as GHG emissions and nitrogen leaching, both influenced by nitrogen fertilizer inputs. Nevertheless, since the models are designed to track independent pathways (for example, air, soil or water), concerns about double counting were mitigated. Statistical methods, including CRITIC and Entropy, applied during testing, further validated that equal weighting was appropriate as the calculated weights varied by less than 10% from one another. This confirms that each emissions pathway holds comparable significance, justifying the use of equal importance in the analysis:
where n is the number of criteria.
The weighted normalized decision matrix vij is calculated as follows:
Aggregation techniques are classified as compensatory or non-compensatory. Compensatory methods allow trade-offs, where a disadvantage in one indicator can be offset by an advantage in another, while non-compensatory methods avoid such trade-offs, aligning with the ‘strong sustainability’ concept of holistic environmental improvement57. Despite non-compensatory methods being preferred for sustainability indices to prevent trade-offs58,59, most indices use compensatory methods for simplicity and stakeholder transparency. Although we initially considered non-compensatory outranking methods for this study, their high computational demand at 5 arcmin resolution led us to select compensatory methods. Non-compensatory aggregation was, however, included in our sensitivity analysis at the national scale.
In this study, we use the TOPSIS aggregation, a compensatory technique based on the distance to target presented in ref. 26. TOPSIS is based on the principle that the best performance (best ranked) of indicator sets should have the shortest geometric distance from the positive ideal solution (zero environmental impact) and the farthest geometric distance from the negative ideal solution (worst-case environmental impact). The methodology first identifies the ideal positive (A+) and negative (A–) solutions for each normalized indicator:
second, calculates the separation measures Si+ and Si– using the Euclidean distance:
and third, calculates the relative closeness to the ideal solution and develops PLANTdex score Ci*:
where Ci* ranges within [0,1] and a lower Ci* PLANTdex score indicates the best solution (least environmental impact).
We multiplied and normalized the PLANTdex scores by production Pi in each cell to assess the total impact Ii caused by production of each crop:
Index uncertainty and sensitivity analysis
We assess the sensitivity of PLANTdex to different suitable methodologies (for its construction and to evaluate its robustness to various approaches). Uncertainty in indexes arises from multiple steps involved in their construction, including the selection of sub-indicators, data selection, data transformation, data normalization, the weighting scheme and the aggregation technique.
Our study focused on assessing the uncertainty only for suitable methodological designs for PLANTdex, recognizing the potential to obtain any score outcome using unsuitable methodologies. We specifically evaluated the sensitivity of the index to the choice of normalization and aggregation approaches with two normalization approaches (min–max and vector normalization) and four non-compensatory aggregation techniques (TOPSIS, PROMETHEE, EDAS and CODAS) applied to wheat, rice, oil palm and soybean production at the country scale. Our analysis was restricted to countries contributing over 0.5% of global production for each crop. We used a Monte Carlo approach, which is based on multiple evaluations of the model with randomly selected index model designs.
Normalization approaches were chosen on the basis of high-ranking Spearman’s correlations (>0.90) between normalization methods. Among the seven tested normalization approaches, three demonstrated consistently high correlations in over 600 iterations out of 1,000 runs: min–max, vector and z score. We excluded z-score normalization from the uncertainty analysis due to its deviation from the desired distributional properties (not confined to the range of 0 to 1) and its impact on the consistency of mean and standard deviation across indicators. Preserving variability in mean and standard deviation aligns with our study’s objective of maintaining data distribution variability, allowing us to identify skewness and determine whether extreme impacts are present within the data. For aggregation, we exclusively assessed PLANTdex against non-compensatory aggregation methods (TOPSIS, PROMETHEE, EDAS and CODAS) to align with strong sustainability principles. Sensitivity to the choice of transformation techniques and weighting is not analysed because the transformation technique depends on the data distribution, and the equal weighting is chosen because each emissions pathway represents independent emissions impacting biodiversity separately.
The uncertainty analysis (Fig. 6a) reveals a strong correlation between the median PLANTdex scores derived from alternative indicator design combinations and the original PLANTdex scores for four assessed crops, with the following R2 values: 0.97 for wheat, 0.99 for rice, 0.931 for oil palm and 0.92 for soybean (all correlations are significant, with P < 0.001).
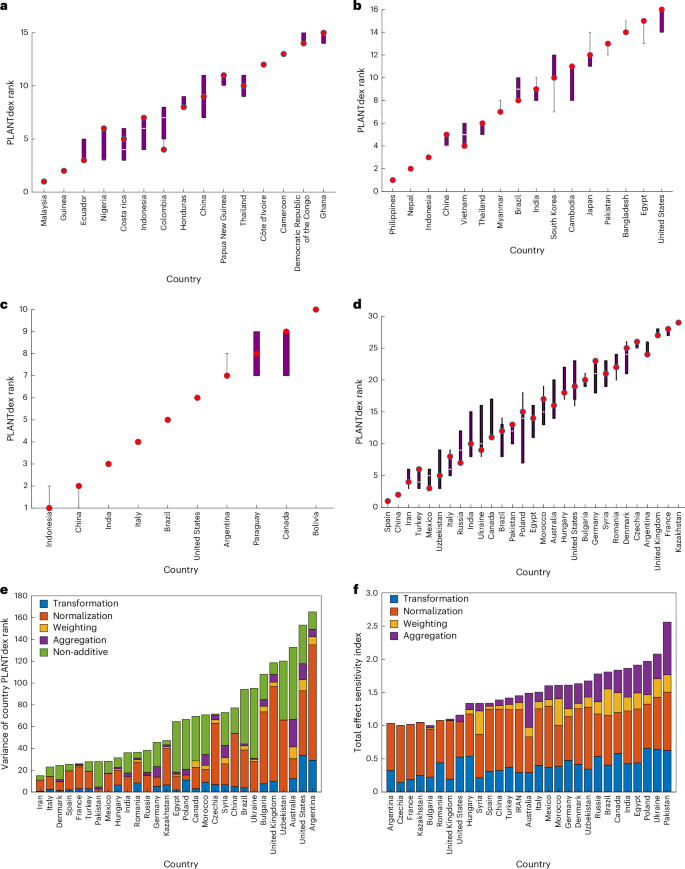
a–d, The uncertainty in country ranking from different suitable variations of producing the PLANTdex across n = 3,500 model runs for four crops: oil palm (a), rice (b), soybean (c) and wheat (d). The median (white bar) and the corresponding 5th and 95th percentiles of the distribution of potential PLANT index values per country are also presented (box), with minima and maxima whiskers. The red circle indicates the original PLANT index value used in this study. e, Variance of country ranking split by the contributing input factor on the basis of Sobol first-order indices. The part of variance that is not described by the first-order indices is noted as non-additive. Countries are listed in ascending order of total variance. f, Total effect sensitivity indices for the variance of each country’s rank.
The strong correlation between alternative design combinations and the original scores indicates that the PLANTdex model is robust across different methodological variations. Moreover, the original scores consistently fall within the interquartile range of the variations (Fig. 6a), further affirming the reliability of the PLANTdex build. This highlights that the chosen methodology is well suited for building a transparent and comprehensive index for sustainability. However, analysis using unsuitable methodologies led to high uncertainties in the index ranking (Supplementary Fig. 5).
The sensitivity analysis was conducted to evaluate and rank the significance of each stage of construction of the index. For the sensitivity analysis, we assessed three transformation types, seven normalization approaches, four weighting schemes and nine aggregation techniques. This comprehensive analysis allowed us to assess the sensitivity of the model to commonly used composite indicator methods. Given the nonlinear nature of the PLANTdex model, variance-based techniques were employed as these are best suited for models where multiple layers of uncertainty are present, making PLANTdex nonlinear and non-additive.60,61. These techniques help in understanding how each input contributes to the overall variability of the model outputs.
The first-order sensitivity index is used to measure the fraction of the variance in the index value attributable to uncertainty in each input factor. This index isolates the effect of each factor independently. Our first-order sensitivity analysis (Fig. 6b) identified the transformation and normalization method as the most sensitive construction stage in determining the PLANTdex score, followed by the aggregation method and the weighting method. However, the high non-additivity and nonlinearity within the model, evidenced by the substantial variance unexplained by the first-order indices, suggest that interactions between these factors are significant. In Kazakhstan, the non-additive variance (measures the extent to which combination of input factors (the varying steps to build the index) contribute to the variability in the model’s output) is as low as 0.6% (meaning the model behaves linearly, and the first-order (individual) factors explain nearly all the variability in the model’s output), but in Ukraine, it reaches as high as 87% for wheat production (meaning the model behaves in a more complex nonlinear manner and that higher-order interactions are the primary contributors to model variability). For most countries, this non-additive variance exceeds 50%, indicating that higher-order interactions are critical to fully understanding the model’s sensitivity. Since computing these higher-order indices can be computationally intensive, we focused on the total effect sensitivity indices, which consolidate all interactions involving a given input factor into a single term. This method, following ref. 60, allows for a comprehensive assessment of interactions while reducing computational burden.
The total effect sensitivity indices (Fig. 6c) consolidate both direct effects and all interactions of each input factor. If a total effect index exceeds 1, it indicates a high degree of interaction and nonlinearity among input factors. If there were no interactions between the input factors, the first-order and total effect sensitivity indices would have summed up to 1. Most countries have total effect sensitivity indices greater than 1, further supporting the presence of strong interactions between the transformation, normalization, weighting and aggregation methods. This suggests that the final PLANTdex score is heavily influenced by the combined effects of multiple input factors rather than just their individual contributions. The high interaction levels reinforce the need for careful methodological design, involving experts who understand the dataset correlations and the goal of the index (for example, weak versus strong sustainability).
The uncertainty and sensitivity analysis underscores the importance of a clear and transparent methodology that targets relevant data, particularly extreme values. It emphasizes collaboration with stakeholders and experts to develop a tool that is both useful and policy-relevant. In addition, it highlights the need for a clear goal for the index, whether aimed at weak sustainability, where good performance in one domain can compensate for poor performance in another, or strong sustainability, which requires all domains to demonstrate good performance for a favourable index score. By applying suitable indicator construction techniques, the uncertainty in composite indicators such as PLANTdex can be significantly reduced.
Comparison with previous indices research
Studies by Zhang et al.13 and Béné et al.12 are the two most recent ones (to our knowledge) to develop globally applicable indices for agricultural sustainability and performance at the national scale. Both studies highlight the need for higher-resolution data and improved measurement consistency. While the environmental indicators differ across these two studies and with this study, we compared individual indicators that best represented indicators within this study.
Béné et al.12 identified larger inconsistencies in data availability across indicators and used environmental indicators that were loosely comparable to PLANTdex indicators. Therefore, we only compared PLANTdex results with those of Zhang et al.13 and their underlying environmental indicators for 198 countries, aiming to identify strong negative correlations (Supplementary Table 6); the higher scores of Zhang et al.13 represent better environmental sustainability, while PLANTdex higher scores represent higher impacts. PLANTdex was aggregated to the country level by calculating production-weighted averages across crops within grid cells and across grid cells within each country. Despite achieving a correlation of r = -0.3209 (P < 0.05), this relatively low value was attributed to differences in aggregation methods: Zhang uses a sum-based approach (weak sustainability) while PLANTdex’s TOPSIS approach limits compensation effects, ensuring poor scores in some indicators are not offset by good scores in others.
When comparing individual indicators, we found that Zhang’s13 soil erosion indicator was a better proxy for freshwater impacts related to phosphorus emissions in our model, compared with their phosphorus surplus indicator. This reflects the fact that, in PLANTdex, freshwater impacts from phosphorus are heavily linked to soil erosion. Overall, most indicators (except water stress) showed negative correlations greater than –0.4 (P < 0.05). For water stress, a weaker correlation (–0.08, P > 0.05) was probably due to methodological differences. Zhang’s approach focuses on long-term irrigation sustainability at broader scales, while PLANTdex’s water-debt approach provides a more localized, detailed assessment of water replenishment and overuse.
In conclusion, the observed differences in correlation stem from the contrasts between pressure-based indicators (Zhang13) and impact-based indicators (PLANTdex), as well as differences in scale, normalization and aggregation techniques. PLANTdex complements Zhang et al.13 by offering high-resolution, crop-specific environmental impact data, enhancing the precision of sustainability assessments for localized policymaking and targeted interventions.
Index method limitations
The current design of PLANTdex has several limitations that future work should address. First, this study’s environmental impact datasets, based on crop production data from 1997–200322,23,62, could be updated using more recent data such as MapSPAM, which spans up to 202063. However, MapSPAM lacks phosphorus and nitrogen fertilizer application rates per crop, which are crucial for assessing biodiversity impacts in fresh and marine waters. Updating these data inputs as more crop-specific global fertilizer-use data become available would improve the study’s relevance to present-day conditions.
Second, while we used a literature review to shape PLANTdex, incorporating expert and stakeholder insights at each development stage would enhance the index’s transparency and usability. Our literature review informed decisions on data normalization, weighting and aggregation, but broader expert engagement could strengthen applicability.
Third, the index relies on input data quality, and although we used high-resolution environmental impact datasets, each model carries inherent limitations and biases. In addition, this study does not fully model the correlations between environmental indicators. Although regression analysis highlights trade-offs and synergies, more detailed modelling could capture incremental and measurable interconnections, such as between GHG emissions and nitrogen’s impact on marine environments through eutrophication.
Fourth, while PLANTdex currently uses five indicators for environmental impact, additional factors such as acidification, land degradation, deforestation and desertification could provide a more comprehensive view. This study also presents a worst-case baseline scenario, excluding policy impacts, incentive programmes and sustainable practices due to limited data availability64. Nonetheless, PLANTdex’s high spatial resolution enables regional knowledge transfer partnerships, promoting policy alignment and sustainable practices within similar economic and environmental contexts65,66,21.
Finally, PLANTdex focuses on crop production’s environmental sustainability and is designed for integration into broader sustainability initiatives, enabling policymakers to make more informed decisions regarding specific crop production systems. We acknowledge that impacts from other activities such as livestock farming, mining and energy production contribute substantially to global environmental health.
Reporting summary
Further information on research design is available in the Nature Research Reporting Summary linked to this article.
Data availability
The data inputs used in this study are available from the respective published papers cited within this Article. Readers can access the original datasets by referring to the cited sources. Further details on data processing and analysis are provided in Methods. All data processing, modelling and figure creation were developed in MATLAB version 2022 (https://www.mathworks.com/). PLANTdex datasets generated during this study, including normalized indicators and final output, are available via Harvard Dataverse at https://doi.org/10.7910/DVN/AOUHGI. Source data are provided with this paper.
References
-
Benton, T. G., Bieg, C., Harwatt, H., Pudasaini, R. & Wellesley, L. Food System Impacts on Biodiversity Loss (Chatham House, 2021).
-
Bar-On, Y. M., Phillips, R. & Milo, R. The biomass distribution on Earth. Proc. Natl Acad. Sci. USA 115, 6506–6511 (2018).
-
IPCC: Summary for Policymakers. In Special Report on Climate Change and Land (eds Shukla, P. R. et al.) (IPCC, 2019).
-
Ritchie, H. & Roser, M. Environmental Impacts of Food Production (Our World in Data, 2020).
-
Pendrill, F. et al. Disentangling the numbers behind agriculture-driven tropical deforestation. Science 377, eabm9267 (2022).
-
FAO The State of the World’s Land and Water Resources for Food and Agriculture (Routledge, 2013); https://doi.org/10.4324/9780203142837
-
Poore, J. & Nemecek, T. Reducing food’s environmental impacts through producers and consumers. Science 360, 987–992 (2018).
-
Kanter, D. R. et al. Translating the Sustainable Development Goals into action: a participatory backcasting approach for developing national agricultural transformation pathways. Glob. Food Sec. 10, 71–79 (2016).
-
Terazono, E. Food industry starts to measure sustainability. Financial Times (26 July 2021).
-
Chaudhary, A., Gustafson, D. & Mathys, A. Multi-indicator sustainability assessment of global food systems. Nat. Commun. 9, 848 (2018).
-
Gerten, D. et al. Feeding ten billion people is possible within four terrestrial planetary boundaries. Nat. Sustain. 3, 200–208 (2020).
-
Béné, C. et al. Global map and indicators of food system sustainability. Sci. Data. 6, 279 (2019).
-
Zhang, X., Yao, G., Vishwakarma, S. & Davidson, E. Measuring sustainable agriculture on a national scale. Earth Space Sci. Open Arch. 10.1002/essoar.10502709.1 (2020).
-
Springmann, M. et al. Options for keeping the food system within environmental limits. Nature 562, 519–525 (2018).
-
Tuninetti, M., Tamea, S. & Dalin, C. Water debt indicator reveals where agricultural water use exceeds sustainable levels. Water Resour. Res. 55, 2464–2477 (2019).
-
Carlson, K. M. et al. Greenhouse gas emissions intensity of global croplands. Nat. Clim. Change 7, 63–68 (2017).
-
Payen, S., Cosme, N. & Elliott, A. H. Freshwater eutrophication: spatially explicit fate factors for nitrogen and phosphorus emissions at the global scale. Int. J. Life Cycle Assess. https://doi.org/10.1007/s11367-020-01847-0 (2021).
-
Global Map of Environmental and Social Risks in Agro-Commodity Production (GMAP) (International Finance Corporation, accessed 1 December 2022); https://gmaptool.org/
-
Verones, F. et al. LC-IMPACT: a regionalized life cycle damage assessment method. J. Ind. Ecol. 24, 1201–1219 (2020).
-
Jwaideh, M. A. A., Sutanudjaja, E. H. & Dalin, C. Global impacts of nitrogen and phosphorus fertiliser use for major crops on aquatic biodiversity. Int. J. Life Cycle Assess. 27, 1058–1080 (2022).
-
Dalin, C. et al. Global greenhouse gas emissions associated with the production of crop and livestock products at 5 arc minutes resolution, 1997–2003. EIDC https://doi.org/10.5285/76f8c5c0-6dde-407a-9710-2bca2e041512 (2024).
-
Mueller, N. D. et al. Closing yield gaps through nutrient and water management. Nature 490, 254–257 (2012).
-
Monfreda, C., Ramankutty, N. & Foley, J. A. Farming the planet: 2. Geographic distribution of crop areas, yields, physiological types, and net primary production in the year 2000. Glob. Biogeochem. Cycles 22, GB1022 (2008).
-
Adalibieke, W., Cui, X., Cai, H., You, L. & Zhou, F. Global crop-specific nitrogen fertilization dataset in 1961–2020. Sci. Data. 10, 617 (2023).
-
Halpern, B. S. et al. The environmental footprint of global food production. Nat. Sustain. 5, 1027–1039 (2022).
-
Chen, S.-J. & Hwang, C.-L. in Fuzzy Multiple Attribute Decision Making: Methods and Applications (eds Chen, S.-J. & Hwang, C.-L.) 289–486 (Springer, 1992); https://doi.org/10.1007/978-3-642-46768-4_5
-
Kim, G., Park, C. S. & Yoon, K. P. Identifying investment opportunities for advanced manufacturing systems with comparative-integrated performance measurement. Int. J. Prod. Econ. 50, 23–33 (1997).
-
Bjørn, A. et al. Life cycle assessment applying planetary and regional boundaries to the process level: a model case study. Int. J. Life Cycle Assess. 25, 2241–2254 (2020).
-
Ryberg, M. W., Owsianiak, M., Richardson, K. & Hauschild, M. Z. Development of a life-cycle impact assessment methodology linked to the Planetary Boundaries framework. Ecol. Indic. 88, 250–262 (2018).
-
Beusen, A. H. W., Van Beek, L. P. H., Bouwman, A. F., Mogollón, J. M. & Middelburg, J. J. Coupling global models for hydrology and nutrient loading to simulate nitrogen and phosphorus retention in surface water—description of IMAGE–GNM and analysis of performance. Geosci. Model Dev. 8, 4045–4067 (2015).
-
RamÃrez, P. B., Machado, S., Singh, S., Plunkett, R. & Calder¢n, F. J. Addressing the effects of soil organic carbon on water retention in US Pacific Northwest wheat–soil systems. Front. Soil Sci. 3, 1233886 (2023).
-
Yang, J. et al. Effects of warming and precipitation changes on soil GHG fluxes: A meta-analysis. Sci. Total Environ. 827, 154351 (2022).
-
Wang, Y. & Jian, C. Sustainable plant-based ingredients as wheat flour substitutes in bread making. NPJ Sci. Food 6, 49 (2022).
-
Henchion, M., Hayes, M., Mullen, A. M., Fenelon, M. & Tiwari, B. Future protein supply and demand: strategies and factors influencing a sustainable equilibrium. Foods 6, 53 (2017).
-
Fruit-picking robots and carbon-saving animal feeds: government confirms £24m agri-tech funding boost. Business Green https://www.businessgreen.com/news/4017952/fruit-picking-robots-carbon-saving-animal-feeds-government-confirms-gbp24m-agri-tech-funding-boost (2020).
-
Regenerative agriculture: results plant hope for the future. Unilever https://www.unilever.com/news/news-search/2023/impact-results-from-unilevers-first-set-of-regenerative-agriculture-projects/ (2023).
-
Alhashim, R., Deepa, R. & Anandhi, A, Environmental impact assessment of agricultural production using LCA: a review. Climate 9, 164 (2021).
-
Vijayan, S. Finance, Nature, and Food Transitions (NatureFinance, 2022); https://www.naturefinance.net/wp-content/uploads/2022/09/FinanceNatureandFoodTransitions.pdf
-
Wynn Mitscherlich, C. C. et al. Balancing international trade and local production for food and nutrition security: animal-sourced foods’ contribution to human welfare. Anim. Front. https://doi.org/10.1093/af/vfab058 (2021).
-
Thornton, P., K. et al. Rural Livelihoods, Food Security, and Rural Transformation under Climate Change (Global Center on Adaptation, 2020); https://gca.org/wp-content/uploads/2020/12/RuralLivelihoodsFoodSecurityRuralTransformation_V2.pdf
-
Sapkota, A., Haghverdi, A., Avila, C. C. E. & Ying, S. C. Irrigation and greenhouse gas emissions: a review of field-based studies. Soil Syst. 4, 20 (2020).
-
Pretty, J. & Bharucha, Z. P. Sustainable intensification in agricultural systems. Ann. Bot. 114, 1571–1596 (2014).
-
Integrated Biodiversity Assessment Tool (IBAT) (IBAT Alliance, accessed 21 September 2022); https://www.ibat-alliance.org
-
Deforestation Fronts (WWF, accessed 28 September 2022); https://wwf.panda.org/discover/our_focus/forests_practice/deforestation_fronts_/
-
Duda, R., Hart, P. & Stork, D. G. Pattern Classification (Wiley, 2001).
-
Brans, J. P. & Vincke, P. How to select and how to rank projects: the Promethee method. Eur. J. Oper. Res. 24, 228–238 (1986).
-
Keshavarz-Ghorabaee, M., Zavadskas, E., Amiri, M. & Esmaeili, A. Multi-criteria evaluation of green suppliers using an extended WASPAS method with interval type-2 fuzzy sets. J. Clean. Prod. 137, 213–229 (2016).
-
Keshavarz-Ghorabaee, M., Zavadskas, E., Turskis, Z. & Antucheviciene, J. A new combinative distance-based assessment (CODAS) method for multi-criteria decision-making. Econ. Comput. Econ. Cybern. Stud. Res. 50, 25–44 (2016).
-
Zhou, P. & Zhang, L. P. in Energy, Environment and Transitional Green Growth in China (eds Pang, R. et al.) 15–36 (Springer, 2018); https://doi.org/10.1007/978-981-10-7919-1_2
-
Ebert, U. & Welsch, H. Meaningful environmental indices: a social choice approach. J. Environ. Econ. Manage. 47, 270–283 (2004).
-
Sharpe, A. Literature Review of Frameworks for Macro-indicators (CSIS, 2004).
-
Mayer, A. L. Strengths and weaknesses of common sustainability indices for multidimensional systems. Environ. Int. 34, 277–291 (2008).
-
The problem with composite indicators. BMJ Qual. Saf. https://doi.org/10.1136/bmjqs-2018-007798 (2019).
-
Nardo, M. et al. Handbook on Constructing Composite Indicators and User Guide (OECD, 2008).
-
HudrlÃková, L., Kramulová, J. & Zeman, J. Measuring sustainable development at the lower regional level in the Czech Republic based on composite indicators: measuring sustainable development in Czech LAU 1 regions using composite indicators. Reg. Stat. 3, 117–140 (2013).
-
Becker, W., Saisana, M., Paruolo, P. & Vandecasteele, I. Weights and importance in composite indicators: closing the gap. Ecol. Indic. 80, 12–22 (2017).
-
Barbier, E. & Burgess, J. Natural resource economics, planetary boundaries and strong sustainability. Sustainability https://doi.org/10.3390/SU9101858 (2017).
-
El Gibari, S., Gómez, T. & Ruiz, F. Building composite indicators using multicriteria methods: a review. J Bus. Econ. 89, 1–24 (2019).
-
Greco, S., Ishizaka, A., Tasiou, M. & Torrisi, G. On the methodological framework of composite indices: a review of the issues of weighting, aggregation, and robustness. Soc. Indic. Res. 141, 61–94 (2019).
-
Saltelli, A., Tarantola, S. & Campolongo, F. Sensitivity analysis as an ingredient of modeling. Stat. Sci. 15, 377–395 (2000).
-
Saltelli, A. et al. Global Sensitivity Analysis: The Primer (Wiley, 2008).
-
West, P. C. et al. Leverage points for improving global food security and the environment. Science 345, 325–328 (2014).
-
IFPRI Global spatially-disaggregated crop production statistics data for 2020 version 1.0. Harvard Dataverse https://doi.org/10.7910/DVN/SWPENT (2024).
-
Piñeiro, V. et al. A scoping review on incentives for adoption of sustainable agricultural practices and their outcomes. Nat. Sustain. 3, 809–820 (2020).
-
Bodin, Ö. Collaborative environmental governance: achieving collective action in social-ecological systems. Science https://doi.org/10.1126/science.aan1114 (2017).
-
Collaborative Framework for Food Systems Transformation. A Multi-stakeholder Pathway for Sustainable Food Systems (One Planet, 2019); https://www.oneplanetnetwork.org/knowledge-centre/resources/collaborative-framework-food-systems-transformation-multi-stakeholder
Acknowledgements
M.A.A.J. was supported by a PhD award from the Engineering and Physical Sciences Research Council (EPSRC) (award no. 1920804). C.D. was supported by an Independent Research Fellowship from the Natural Environment Research Council (grant no. NE/N01524X/1). C.D. acknowledges funding by the European Union (ERC, FLORA, 101039402). Views and opinions expressed are, however, those of the authors only and do not necessarily reflect those of the European Union or the European Research Council Executive Agency. Neither the European Union nor the granting authority can be held responsible for them.
Author information
Authors and Affiliations
Contributions
M.A.A.J. conducted the research as part of his PhD studies, performing all primary analyses and drafting the manuscript. C.D. supervised the project, provided guidance throughout the research process and reviewed and contributed to revisions of the manuscript.
Corresponding author
Ethics declarations
Competing interests
The authors declare no competing interests.
Peer review
Peer review information
Nature Sustainability thanks Francisco Areal, Michael Clark, Fabio Santeramo and the other, anonymous, reviewer(s) for their contribution to the peer review of this work.
Additional information
Publisher’s note Springer Nature remains neutral with regard to jurisdictional claims in published maps and institutional affiliations.
Supplementary information
Supplementary Information
Supplementary Figs. 1–5, Tables 1–6 and Discussion.
Supplementary Code 1
Code function to run PLANTdex.
Source data
Source Data Fig. 2
Table of values for figures.
Source Data Fig. 3
Table of values for figures.
Source Data Fig. 4
Table of values for figures.
Rights and permissions
Open Access This article is licensed under a Creative Commons Attribution 4.0 International License, which permits use, sharing, adaptation, distribution and reproduction in any medium or format, as long as you give appropriate credit to the original author(s) and the source, provide a link to the Creative Commons licence, and indicate if changes were made. The images or other third party material in this article are included in the article’s Creative Commons licence, unless indicated otherwise in a credit line to the material. If material is not included in the article’s Creative Commons licence and your intended use is not permitted by statutory regulation or exceeds the permitted use, you will need to obtain permission directly from the copyright holder. To view a copy of this licence, visit http://creativecommons.org/licenses/by/4.0/.
About this article
Cite this article
Jwaideh, M.A.A., Dalin, C. The multi-dimensional environmental impact of global crop commodities.
Nat Sustain (2025). https://doi.org/10.1038/s41893-025-01528-6
-
Received: 04 July 2023
-
Accepted: 18 February 2025
-
Published: 24 March 2025
-
DOI: https://doi.org/10.1038/s41893-025-01528-6
Search
RECENT PRESS RELEASES
Related Post


