Top 3 gainers Fartcoin, POL, DeepBook: Altcoins surge as Bitcoin nears $90,000
April 22, 2025
- Investors in select altcoins like Fartcoin, POL and DeepBook welcome double-digit gains.
- Bitcoin inches closer to $90,000, potentially waking up as digital Gold amid uncertainty in the macro environment.
- Farcoin’s price rallies above $1.00, completing a 66% cup and handle breakout target.
- POL breaks out, signaling the potential for a massive rally, as DeepBook surges more than 40% on the day.
Fartcoin price extends gains above the $1.00 level at the time of writing on Tuesday after recovering from a dip triggered by profit-taking activity ahead of the weekend. POL, formerly known as MATIC, changed course, reversing the trend in favor of the bulls to trade at $0.2195 at the time of writing. On the other hand, DeepBook (DEEP) explodes in double-digit gains following the protocol’s launch on the Sui Network.
The largest cryptocurrency by market capitalization, Bitcoin (BTC), popped up above $88,000 during the Asian session on Tuesday, tagging an intraday peak of $88,877. Spot Bitcoin Exchange Traded Funds (ETFs) recorded a total net inflow of $381 million on Monday, with none of the 12 licensed products posting net outflows, representing the return of institutional demand. This inflow surge underscores Bitcoin’s role as a hedge during times of uncertainty in global markets, especially now with the US dollar (USD) sliding against major currencies.
US President Donald Trump’s hostile gestures towards the Federal Reserve (Fed) shook the US dollar (USD), triggering a sharp drop on Monday as Trump criticized Fed Chair Jerome Powell for not cutting interest rates.
As FXStreet reported, “the US Dollar Index (DXY), which tracks the Greenback’s value against six major currencies, hitting a three-year low, with markets interpreting the White House’s direct attack on the Fed Chair Jerome Powell as threatening the central bank’s independence.”
Fartcoin’s price has worked its way above the psychological $1.00 level, increasing by over 10% on the day. At the time of writing, the meme coin exchanges hands at $1.06 after completing a cup and handle pattern’s 66% breakout target, highlighted in previous analyses.
Fartcoin holds above the 50, 100 and 200 Exponential Moving Average (EMA) indicators on the 12-hour chart, signaling a strong bullish outlook toward the next target at $1.20, a resistance level tested in December and January.
The Relative Strength Index (RSI) indicator’s move above 70 suggests buyers have the upper hand. However, entry into the overbought region introduces another risk of a potential pullback, especially if investors take profit.
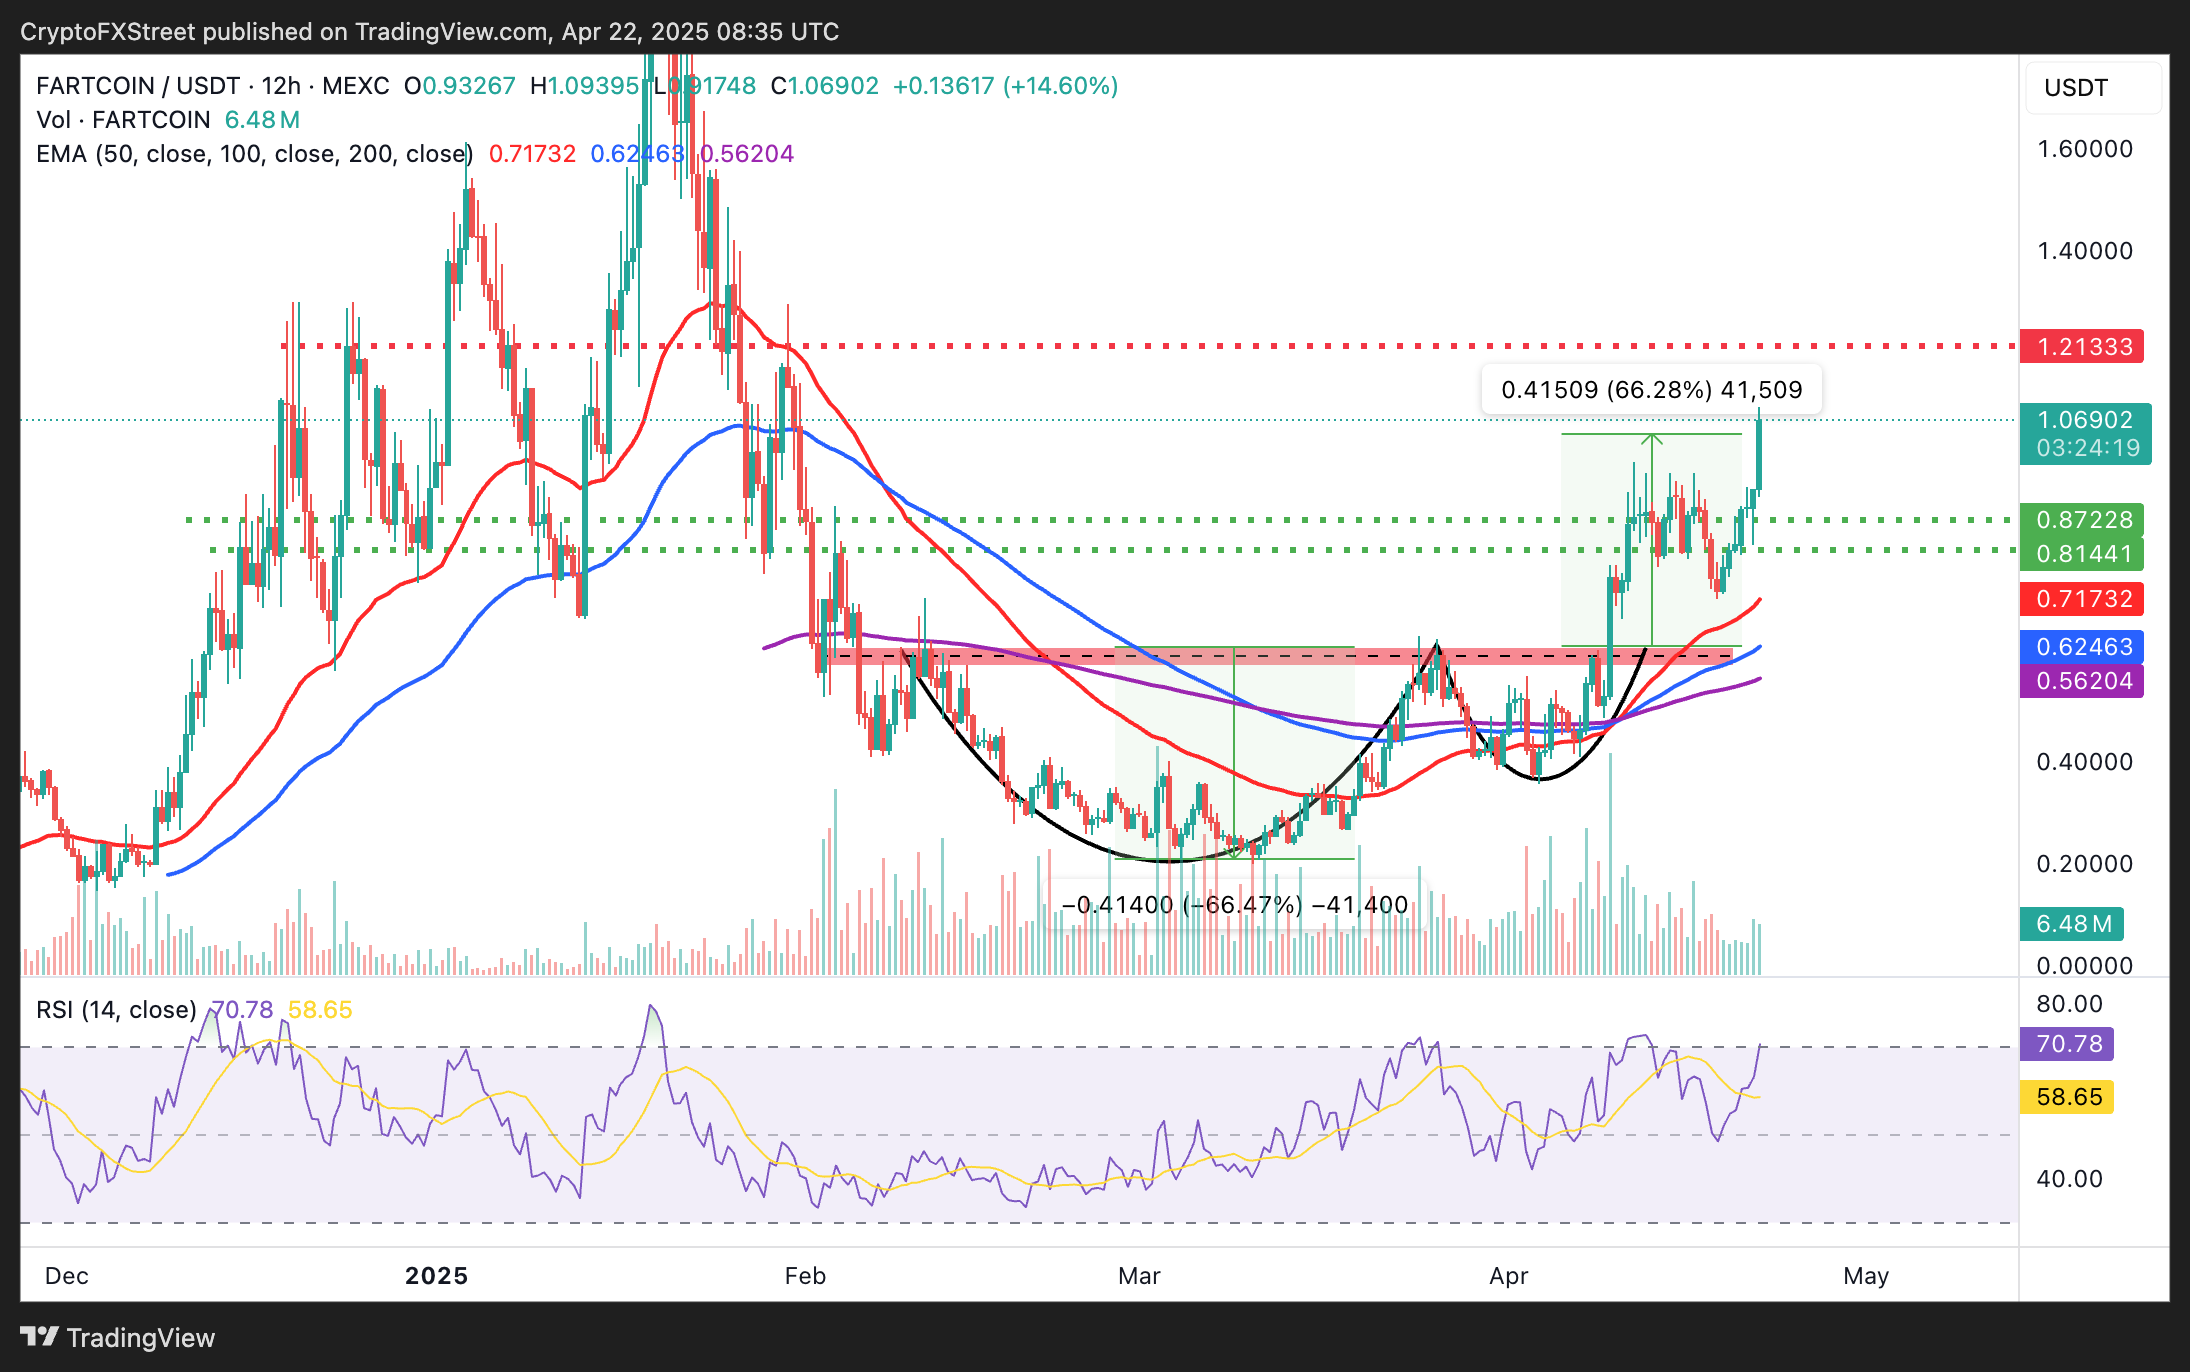
FARTCOIN/USDT 12-hour chart
Traders would look for a 12-hour to a daily close above the immediate $1.00 support to ascertain the uptrend’s strength. Declines below this level could cause a sharp price drop to the recent support level at $0.90 before extending the leg to $0.80 and $0.72.
POL’s price increases by nearly 10% to hover at $0.2195 at the time of writing on Tuesday. The token appears to have bottomed out at $0.1519, following the widespread crash in the crypto market on April 7.
The upward-pointing RSI indicator at 63.52 suggests strong bullish momentum and that POL may continue to move higher in the coming sessions and days.
Higher support is anticipated above the 50-day EMA around $0.2175, which may play a huge role in POL’s ability to extend the uptrend to key targets at the 100 EMA holding $0.2676 and the 200-day EMA at $ 0.3537.
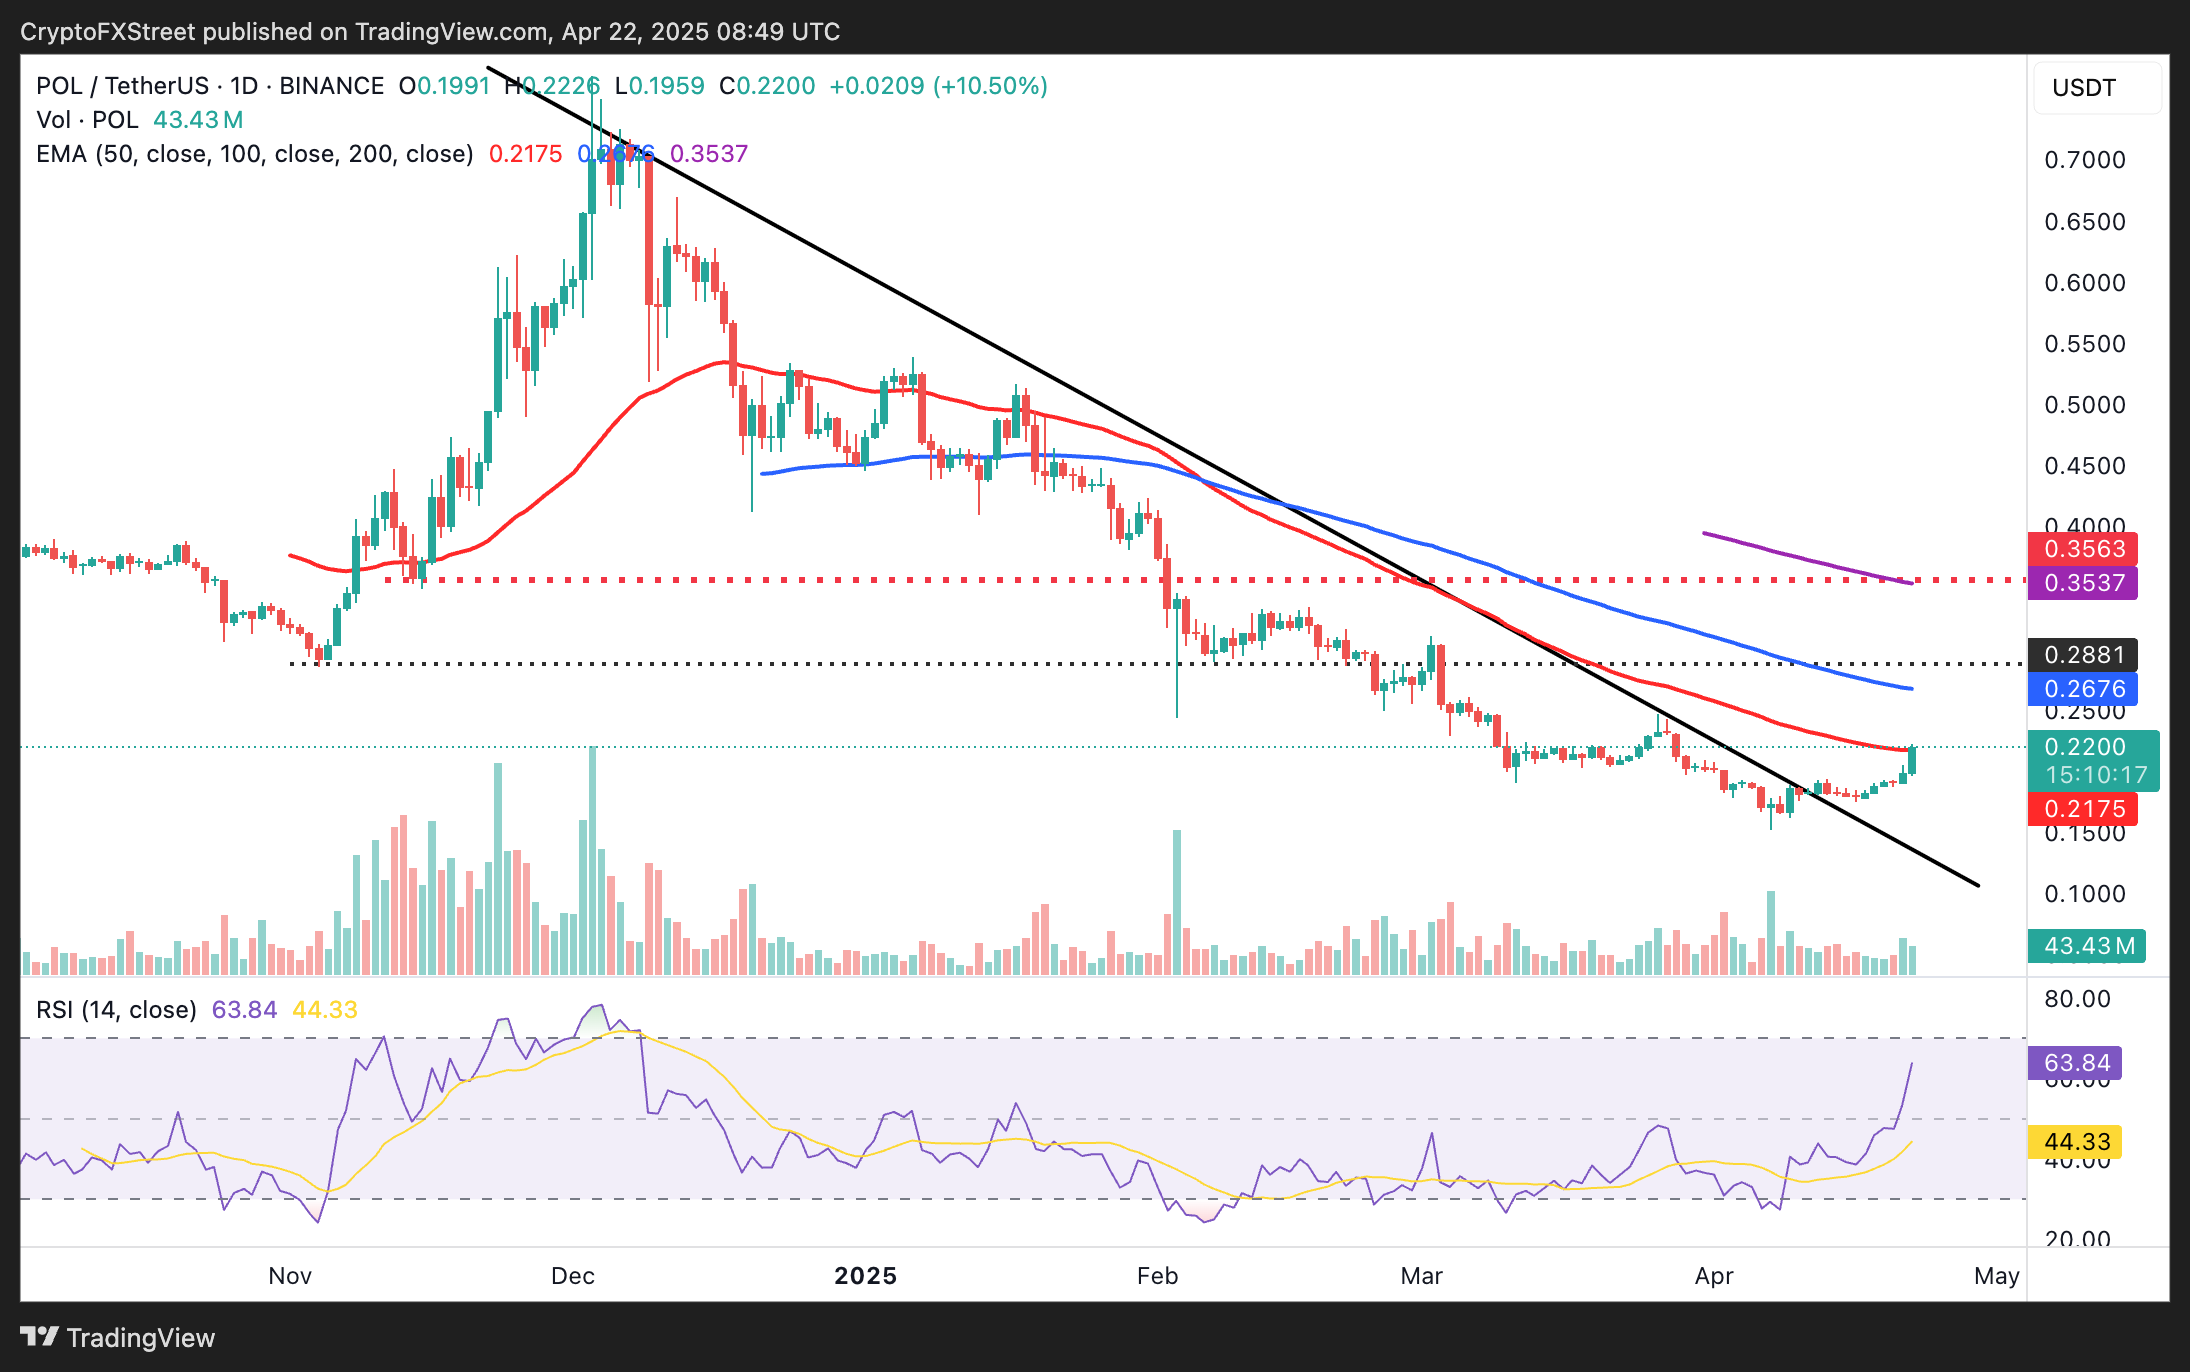
POL/USDT daily chart
On the flip side, if POL cannot hold above the 50-day EMA, some traders may choose to reduce exposure, anticipating a drop to the year-to-date low at $0.1519.
DeepBook’s massive rally could break the downtrend
DeepBook’s launch on Sui Network on April 16 continues to positively impact the performance of DEEP, which tagged $0.1991, its highest level since mid-February. Despite the token surging by more than 40% on Tuesday, it has pulled back from the intraday high and currently hovers at $0.1256 at the time of writing.
DEEP/USDT daily chart
It is unclear whether the rally will continue, considering the RSI indicator is overbought at 75.90. If investors liquidate for profit, sell-side pressure could claw back the accrued gains. Traders may seek support at the 100-day EMA ($0.1026) and the 50-day EMA ($0.0901).
Token launches influence demand and adoption among market participants. Listings on crypto exchanges deepen the liquidity for an asset and add new participants to an asset’s network. This is typically bullish for a digital asset.
A hack is an event in which an attacker captures a large volume of the asset from a DeFi bridge or hot wallet of an exchange or any other crypto platform via exploits, bugs or other methods. The exploiter then transfers these tokens out of the exchange platforms to ultimately sell or swap the assets for other cryptocurrencies or stablecoins. Such events often involve an en masse panic triggering a sell-off in the affected assets.
Macroeconomic events like the US Federal Reserve’s decision on interest rates influence crypto assets mainly through the direct impact they have on the US Dollar. An increase in interest rate typically negatively influences Bitcoin and altcoin prices, and vice versa. If the US Dollar index declines, risk assets and associated leverage for trading gets cheaper, in turn driving crypto prices higher.
Halvings are typically considered bullish events as they slash the block reward in half for miners, constricting the supply of the asset. At consistent demand if the supply reduces, the asset’s price climbs.
Share:
Cryptos feed
Information on these pages contains forward-looking statements that involve risks and uncertainties. Markets and instruments profiled on this page are for informational purposes only and should not in any way come across as a recommendation to buy or sell in these assets. You should do your own thorough research before making any investment decisions. FXStreet does not in any way guarantee that this information is free from mistakes, errors, or material misstatements. It also does not guarantee that this information is of a timely nature. Investing in Open Markets involves a great deal of risk, including the loss of all or a portion of your investment, as well as emotional distress. All risks, losses and costs associated with investing, including total loss of principal, are your responsibility. The views and opinions expressed in this article are those of the authors and do not necessarily reflect the official policy or position of FXStreet nor its advertisers. The author will not be held responsible for information that is found at the end of links posted on this page.
If not otherwise explicitly mentioned in the body of the article, at the time of writing, the author has no position in any stock mentioned in this article and no business relationship with any company mentioned. The author has not received compensation for writing this article, other than from FXStreet.
FXStreet and the author do not provide personalized recommendations. The author makes no representations as to the accuracy, completeness, or suitability of this information. FXStreet and the author will not be liable for any errors, omissions or any losses, injuries or damages arising from this information and its display or use. Errors and omissions excepted.
The author and FXStreet are not registered investment advisors and nothing in this article is intended to be investment advice.
Search
RECENT PRESS RELEASES
Related Post


