Top 3 Price Prediction Bitcoin, Ethereum, Ripple: BTC, ETH, and XRP brace for correction
July 1, 2025
- Bitcoin drops below $106,000 on Wednesday, extending its decline by 2.47% over the past two days.
- Ethereum slips below critical support at $2,461, signaling a potential for further downside.
- XRP fails to close above its key resistance level at $2.23, increasing the risk of a short-term pullback.
Bitcoin (BTC), Ethereum (ETH), and Ripple (XRP) are showing signs of weakness mid-week as bullish momentum continues to fade. BTC extends its decline to trade below $106,000, while ETH and XRP slip below their key support levels, raising concerns of a deeper correction on the horizon.
Bitcoin price rose sharply by 7.32% last week, closing above $108,000. However, it faced a correction on Monday and continued its decline, closing below $106,000 the following day. At the time of writing, it hovers at around $106,100.
If BTC continues to face a pullback and closes below its 50-day Exponential Moving Average (EMA) at $104,245, it could extend the decline toward its psychological level of $100,000.
The Relative Strength Index (RSI) on the daily chart reads 51 and is hovering around its neutral level of 50, indicating indecisiveness among traders. For the bearish momentum to be sustained, the RSI must move below its neutral level. The Moving Average Convergence Divergence (MACD) hints at a bearish crossover (the MACD line is close to crossing below the signal line), which, if completed, would give a sell signal.
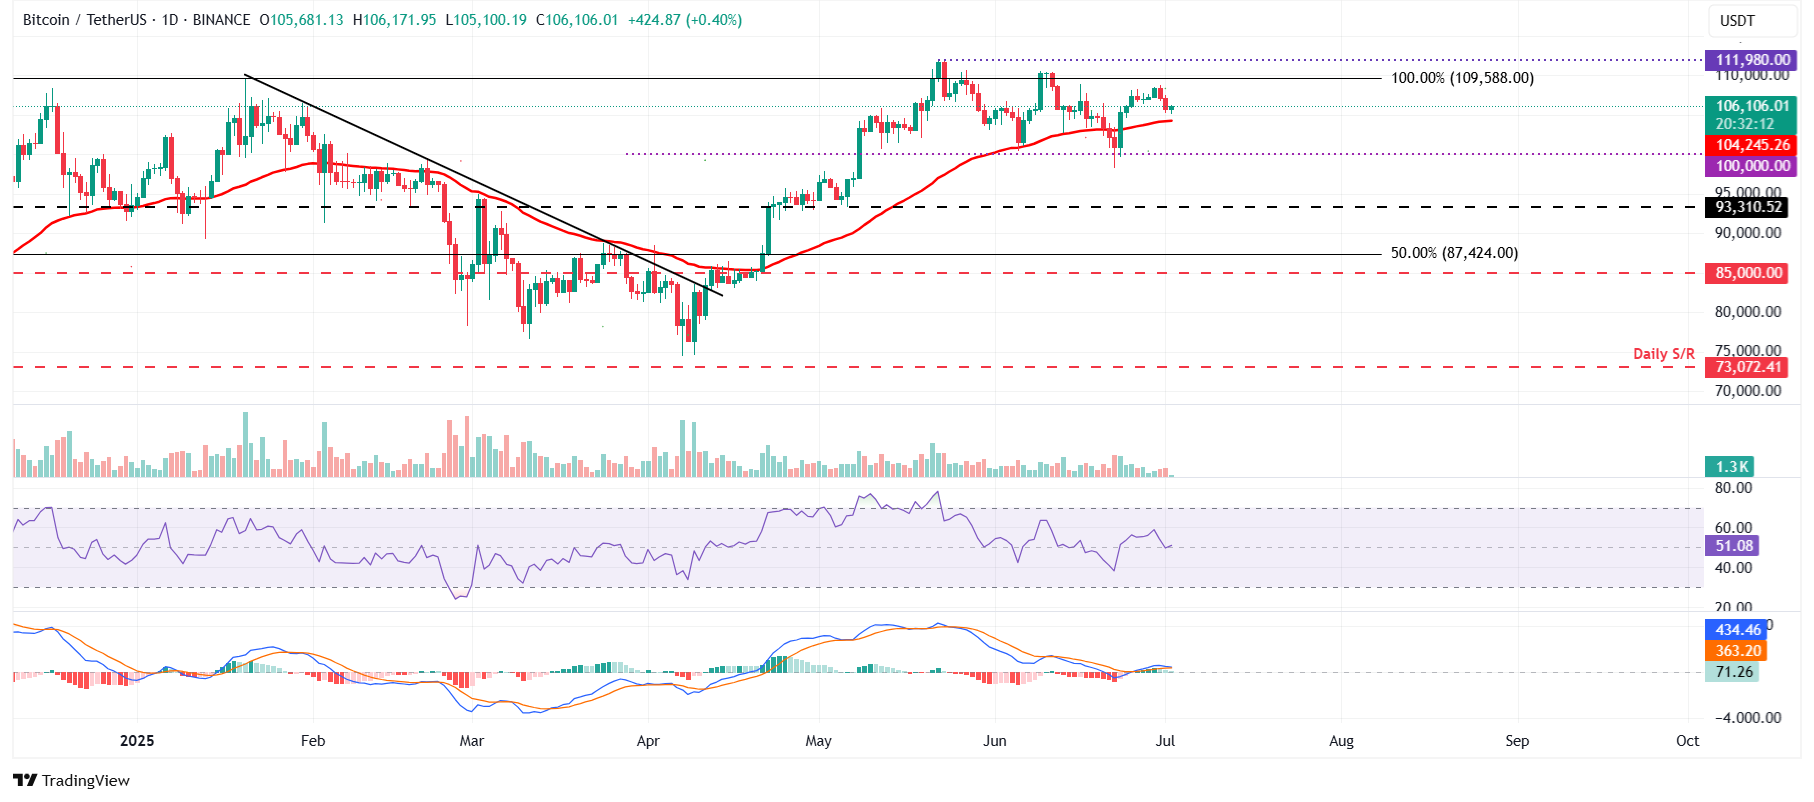
BTC/USDT daily chart
However, if the 50-day EMA level at $104,245 remains strong as support, BTC could extend its rally toward the May 22 all-time high at $111,980.
Ethereum price failed to find support around its daily level of $2,461 earlier this week and closed below its 50-day EMA at $2,428 on Tuesday. At the time of writing on Wednesday, it hovers around $2,428.
If ETH continues its correction, it could extend the decline to retest its June 22 low of $2,111.
The RSI on the daily chart reads 47, below its neutral level of 50, indicating that bearish momentum is gaining traction. The MACD indicator also coils against each other, indicating indecisiveness among traders.
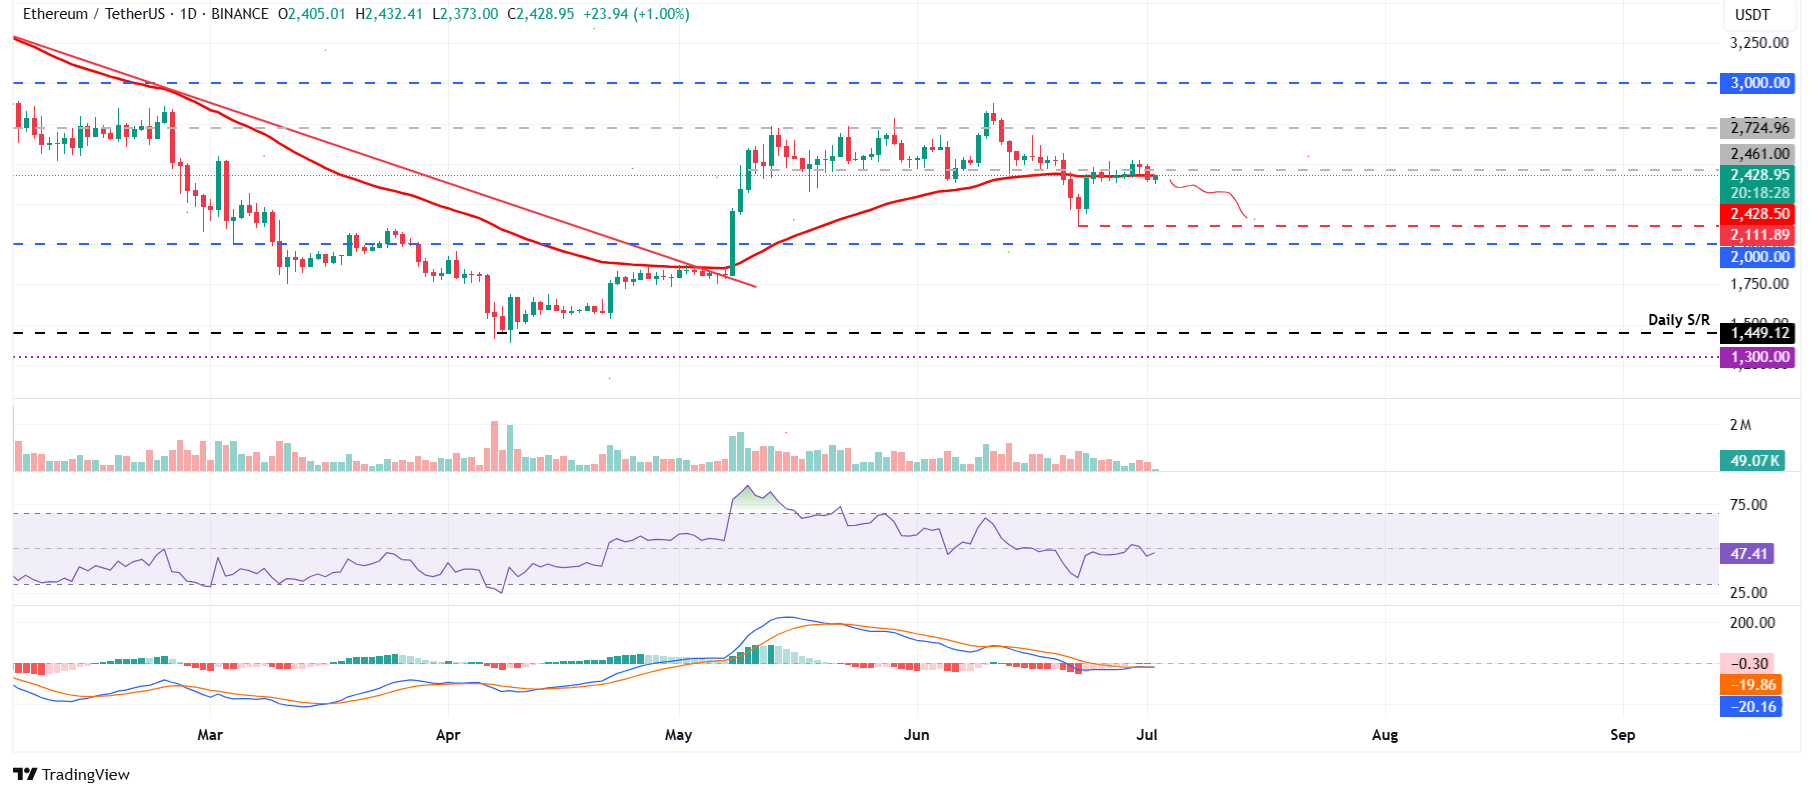
ETH/USDT daily chart
On the other hand, if ETH recovers and closes above the $2,461 level, it could extend the rally toward its next daily resistance level at $2,724.
XRP price failed to close above its daily resistance level at $2.23 on Monday and declined nearly 3% the next day. At the time of writing on Wednesday, it hovers at around $2.18.
If XRP continues its correction, it could extend the decline to retest its next daily support at $1.96.
The RSI on the daily chart hovers around its neutral level of 50, indicating indecisiveness among traders. For the bearish momentum to be sustained, the RSI must move below its neutral level.
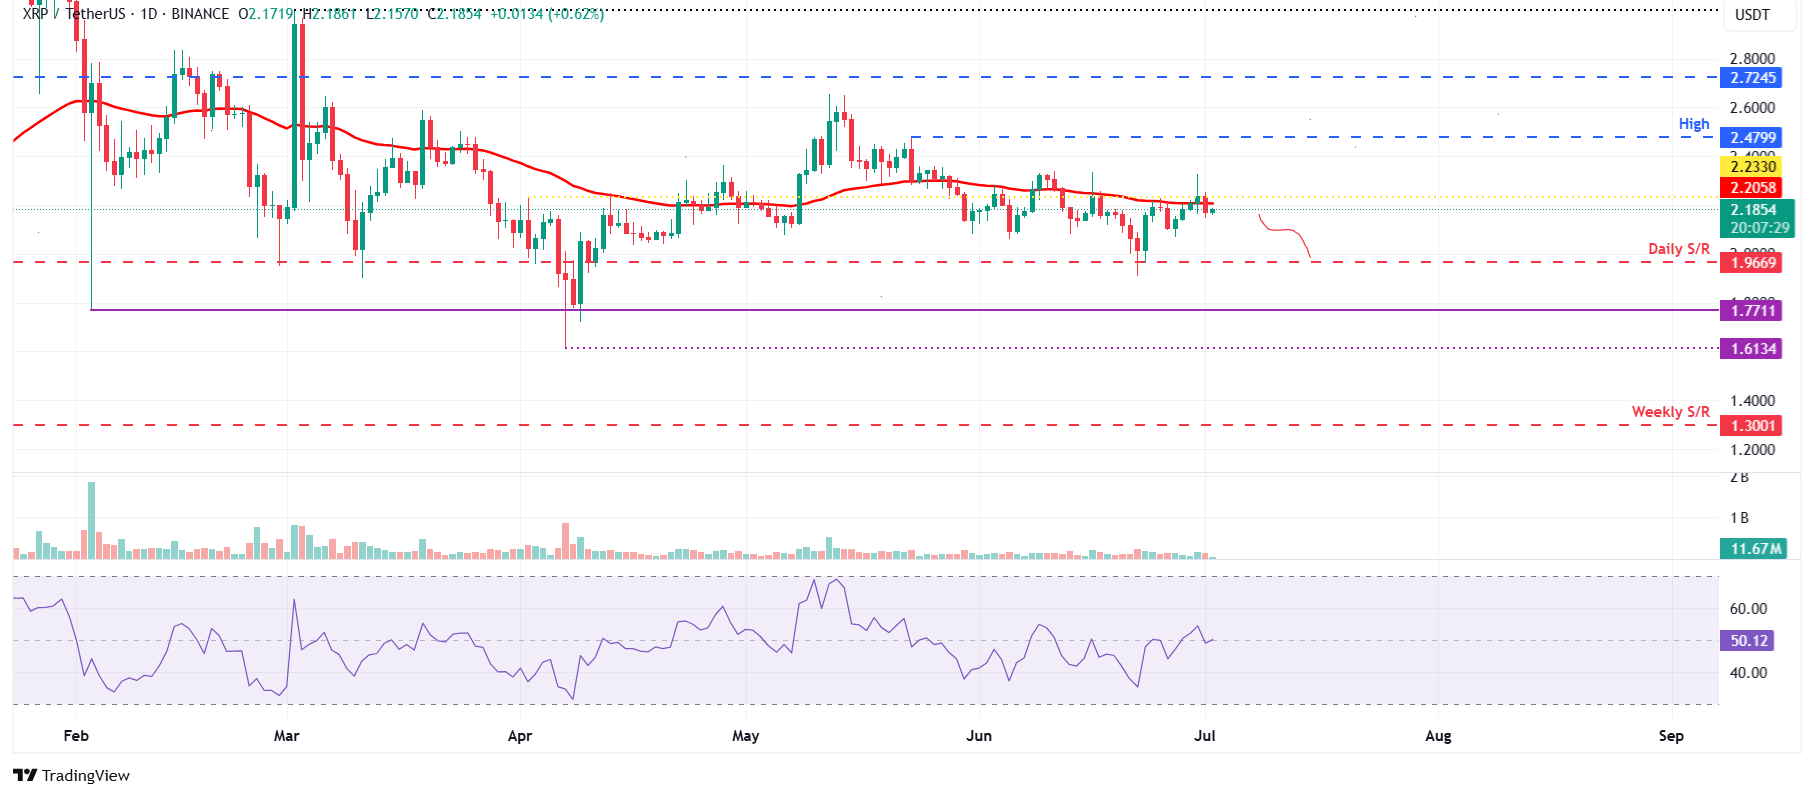
XRP/USDT daily chart
Conversely, if XRP recovers and closes above the daily resistance at $2.23, it could extend the rally toward its May 23 high of $2.47.
Bitcoin is the largest cryptocurrency by market capitalization, a virtual currency designed to serve as money. This form of payment cannot be controlled by any one person, group, or entity, which eliminates the need for third-party participation during financial transactions.
Altcoins are any cryptocurrency apart from Bitcoin, but some also regard Ethereum as a non-altcoin because it is from these two cryptocurrencies that forking happens. If this is true, then Litecoin is the first altcoin, forked from the Bitcoin protocol and, therefore, an “improved” version of it.
Stablecoins are cryptocurrencies designed to have a stable price, with their value backed by a reserve of the asset it represents. To achieve this, the value of any one stablecoin is pegged to a commodity or financial instrument, such as the US Dollar (USD), with its supply regulated by an algorithm or demand. The main goal of stablecoins is to provide an on/off-ramp for investors willing to trade and invest in cryptocurrencies. Stablecoins also allow investors to store value since cryptocurrencies, in general, are subject to volatility.
Bitcoin dominance is the ratio of Bitcoin’s market capitalization to the total market capitalization of all cryptocurrencies combined. It provides a clear picture of Bitcoin’s interest among investors. A high BTC dominance typically happens before and during a bull run, in which investors resort to investing in relatively stable and high market capitalization cryptocurrency like Bitcoin. A drop in BTC dominance usually means that investors are moving their capital and/or profits to altcoins in a quest for higher returns, which usually triggers an explosion of altcoin rallies.
Information on these pages contains forward-looking statements that involve risks and uncertainties. Markets and instruments profiled on this page are for informational purposes only and should not in any way come across as a recommendation to buy or sell in these assets. You should do your own thorough research before making any investment decisions. FXStreet does not in any way guarantee that this information is free from mistakes, errors, or material misstatements. It also does not guarantee that this information is of a timely nature. Investing in Open Markets involves a great deal of risk, including the loss of all or a portion of your investment, as well as emotional distress. All risks, losses and costs associated with investing, including total loss of principal, are your responsibility. The views and opinions expressed in this article are those of the authors and do not necessarily reflect the official policy or position of FXStreet nor its advertisers. The author will not be held responsible for information that is found at the end of links posted on this page.
If not otherwise explicitly mentioned in the body of the article, at the time of writing, the author has no position in any stock mentioned in this article and no business relationship with any company mentioned. The author has not received compensation for writing this article, other than from FXStreet.
FXStreet and the author do not provide personalized recommendations. The author makes no representations as to the accuracy, completeness, or suitability of this information. FXStreet and the author will not be liable for any errors, omissions or any losses, injuries or damages arising from this information and its display or use. Errors and omissions excepted.
The author and FXStreet are not registered investment advisors and nothing in this article is intended to be investment advice.
Search
RECENT PRESS RELEASES
Related Post


